(34) Using country polygons for plotting and shading
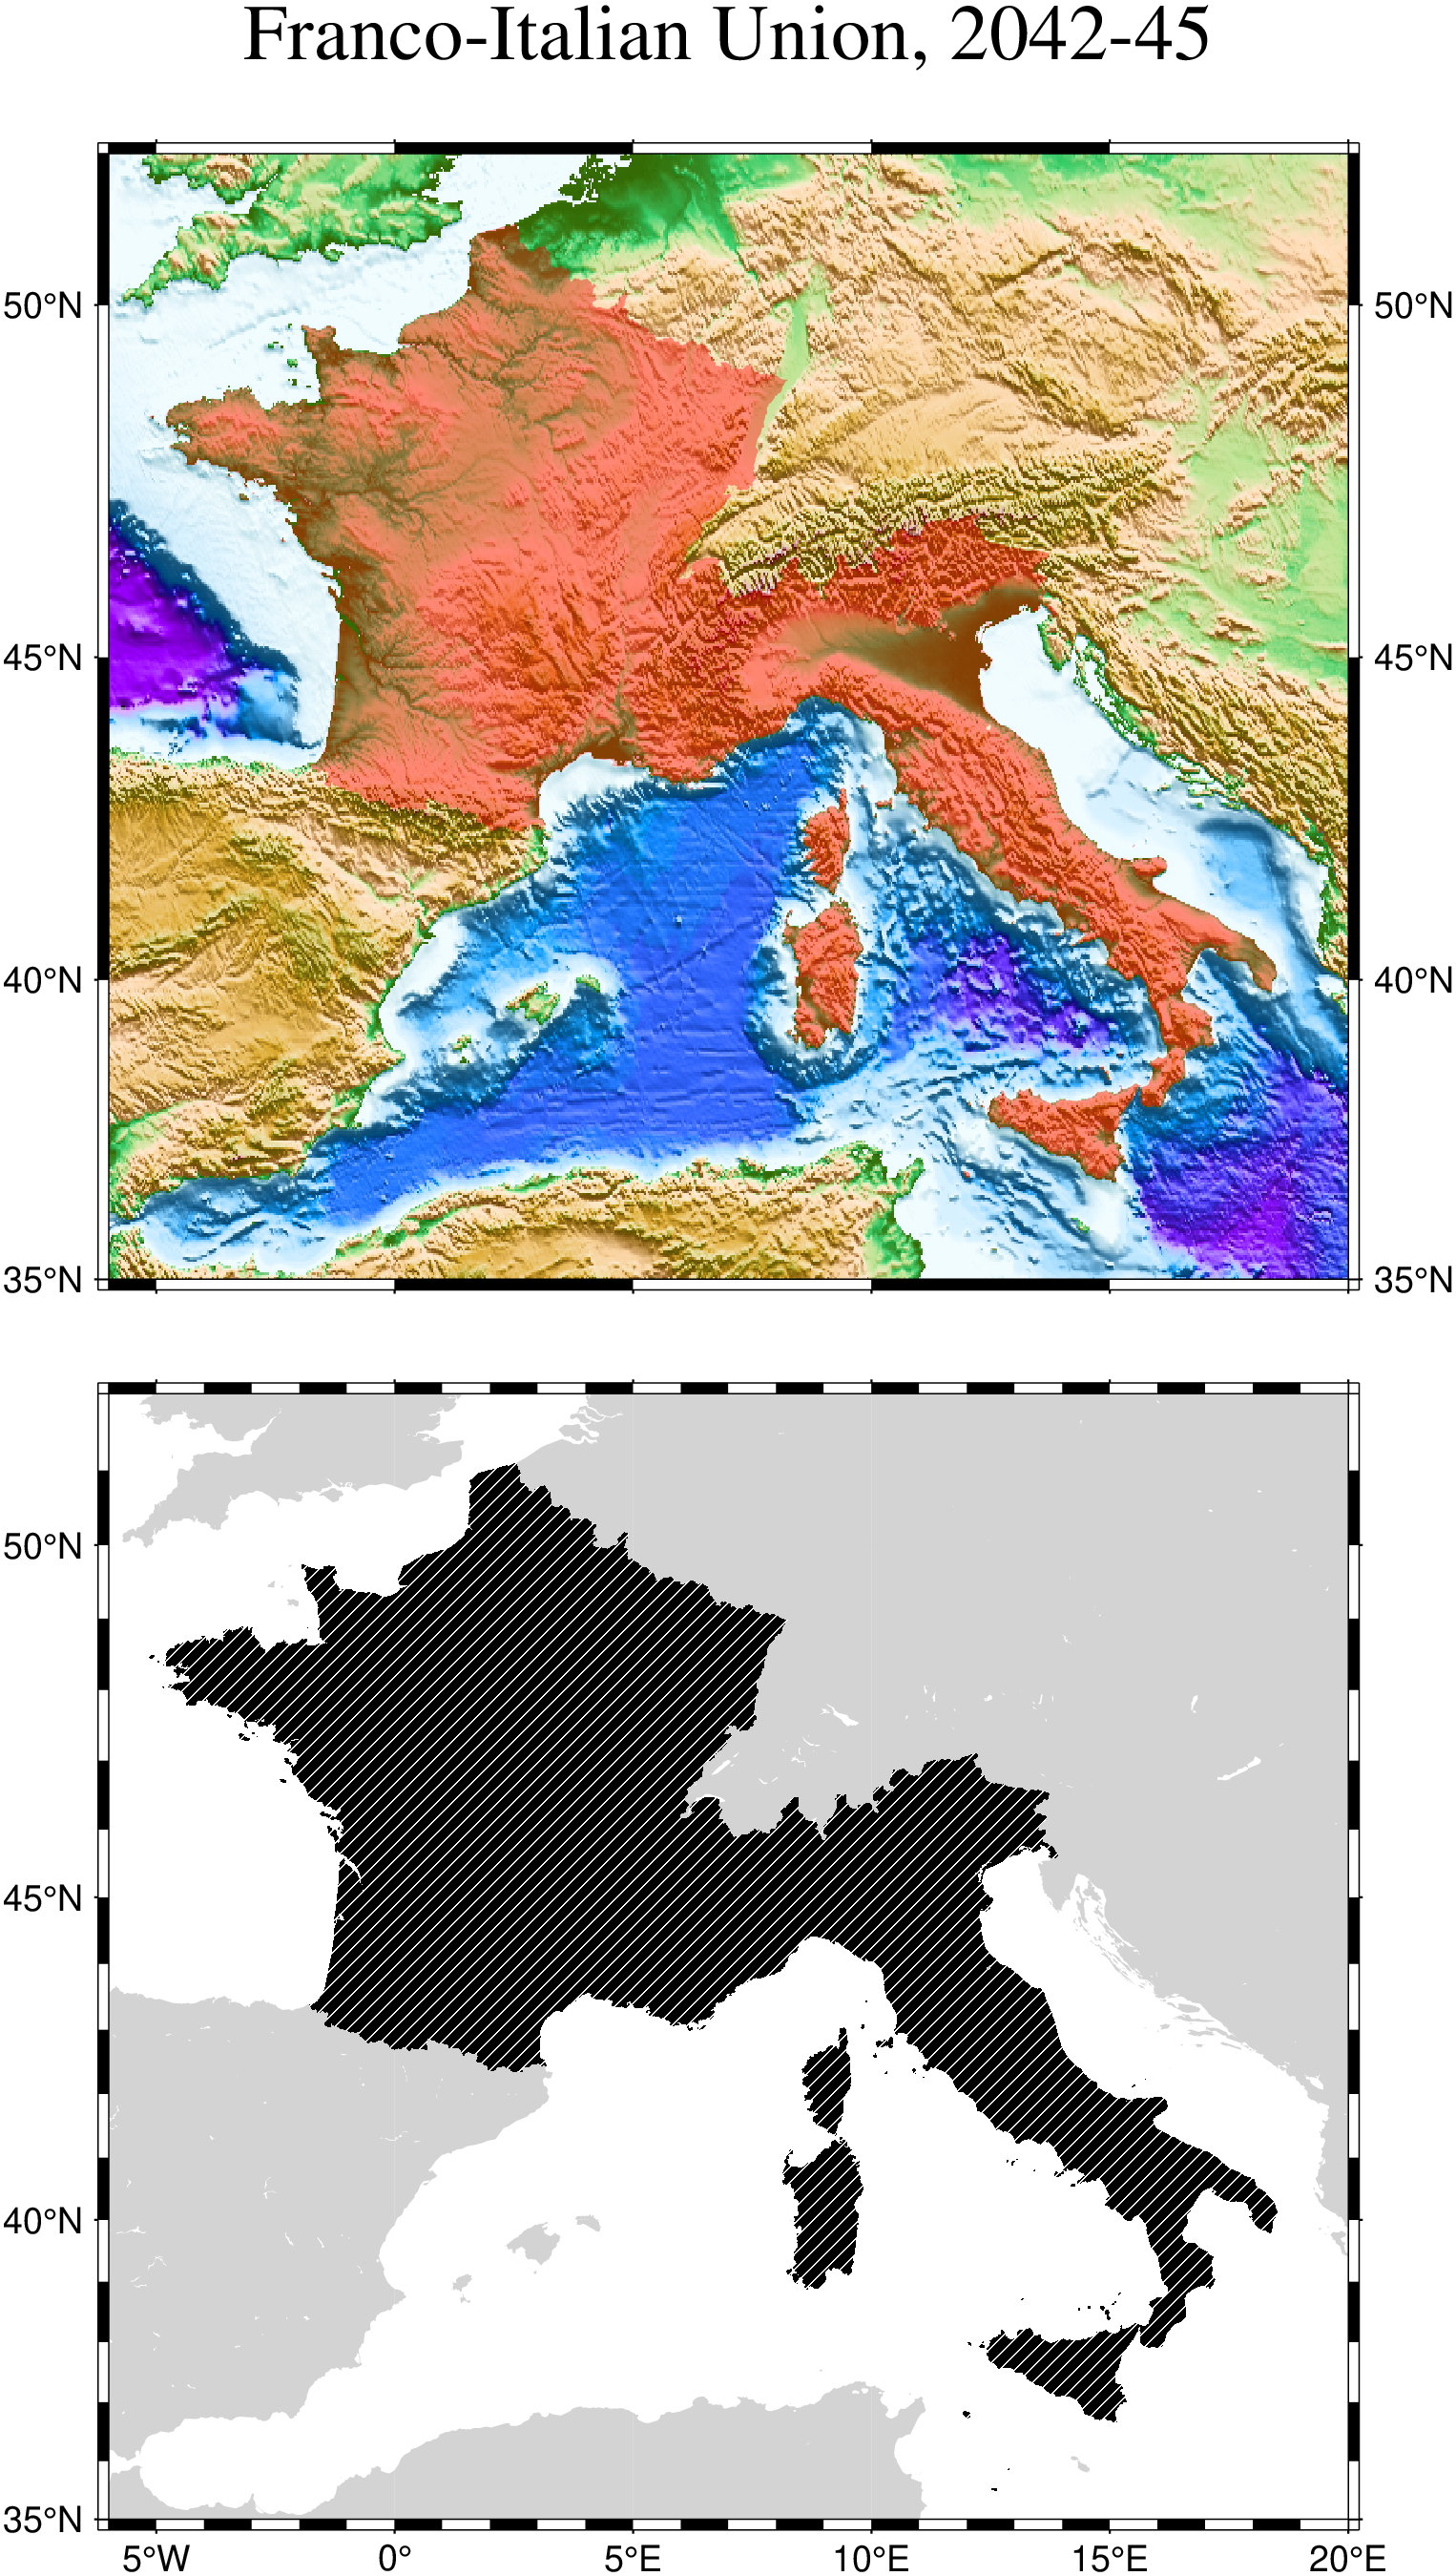
The script produces the plot in Figure. Here we demonstrate how coast can be used to extract and plot country polygons from the optional DCW dataset. We show two panels; one in which we do a basic basemap and another where we lay down a color topography image and then place a transparent layer identifying the future Franco-Italian Union, whose untimely breakup in 2045 the historians will continue to debate for some time.
using GMT

pscoast(region=(-6,20,35,52), DCW=(country="FR,IT", fill=(inv_pattern=8, dpi=300)),
        land=:lightgray, proj=:Mercator, figsize=11, xshift=5)

# Extract a subset of ETOPO2m for this part of Europe
makecpt(cmap=:globe, range=(-5000,5000,50), continuous=true)
grdimage!("@FR+IT.nc", shade=(azim=15, norm="e0.75"),
          frame=(axes=:WsnE, annot=:auto, title="Franco-Italian Union, 2042-45"), yshift=11)
coast!(DCW=(country="FR,IT", fill="red@60"),  show=true)
© GMT.jl. Last modified: November 08, 2025. Website built with Franklin.jl and the Julia programming language.
These docs were autogenerated using GMT: v1.33.1