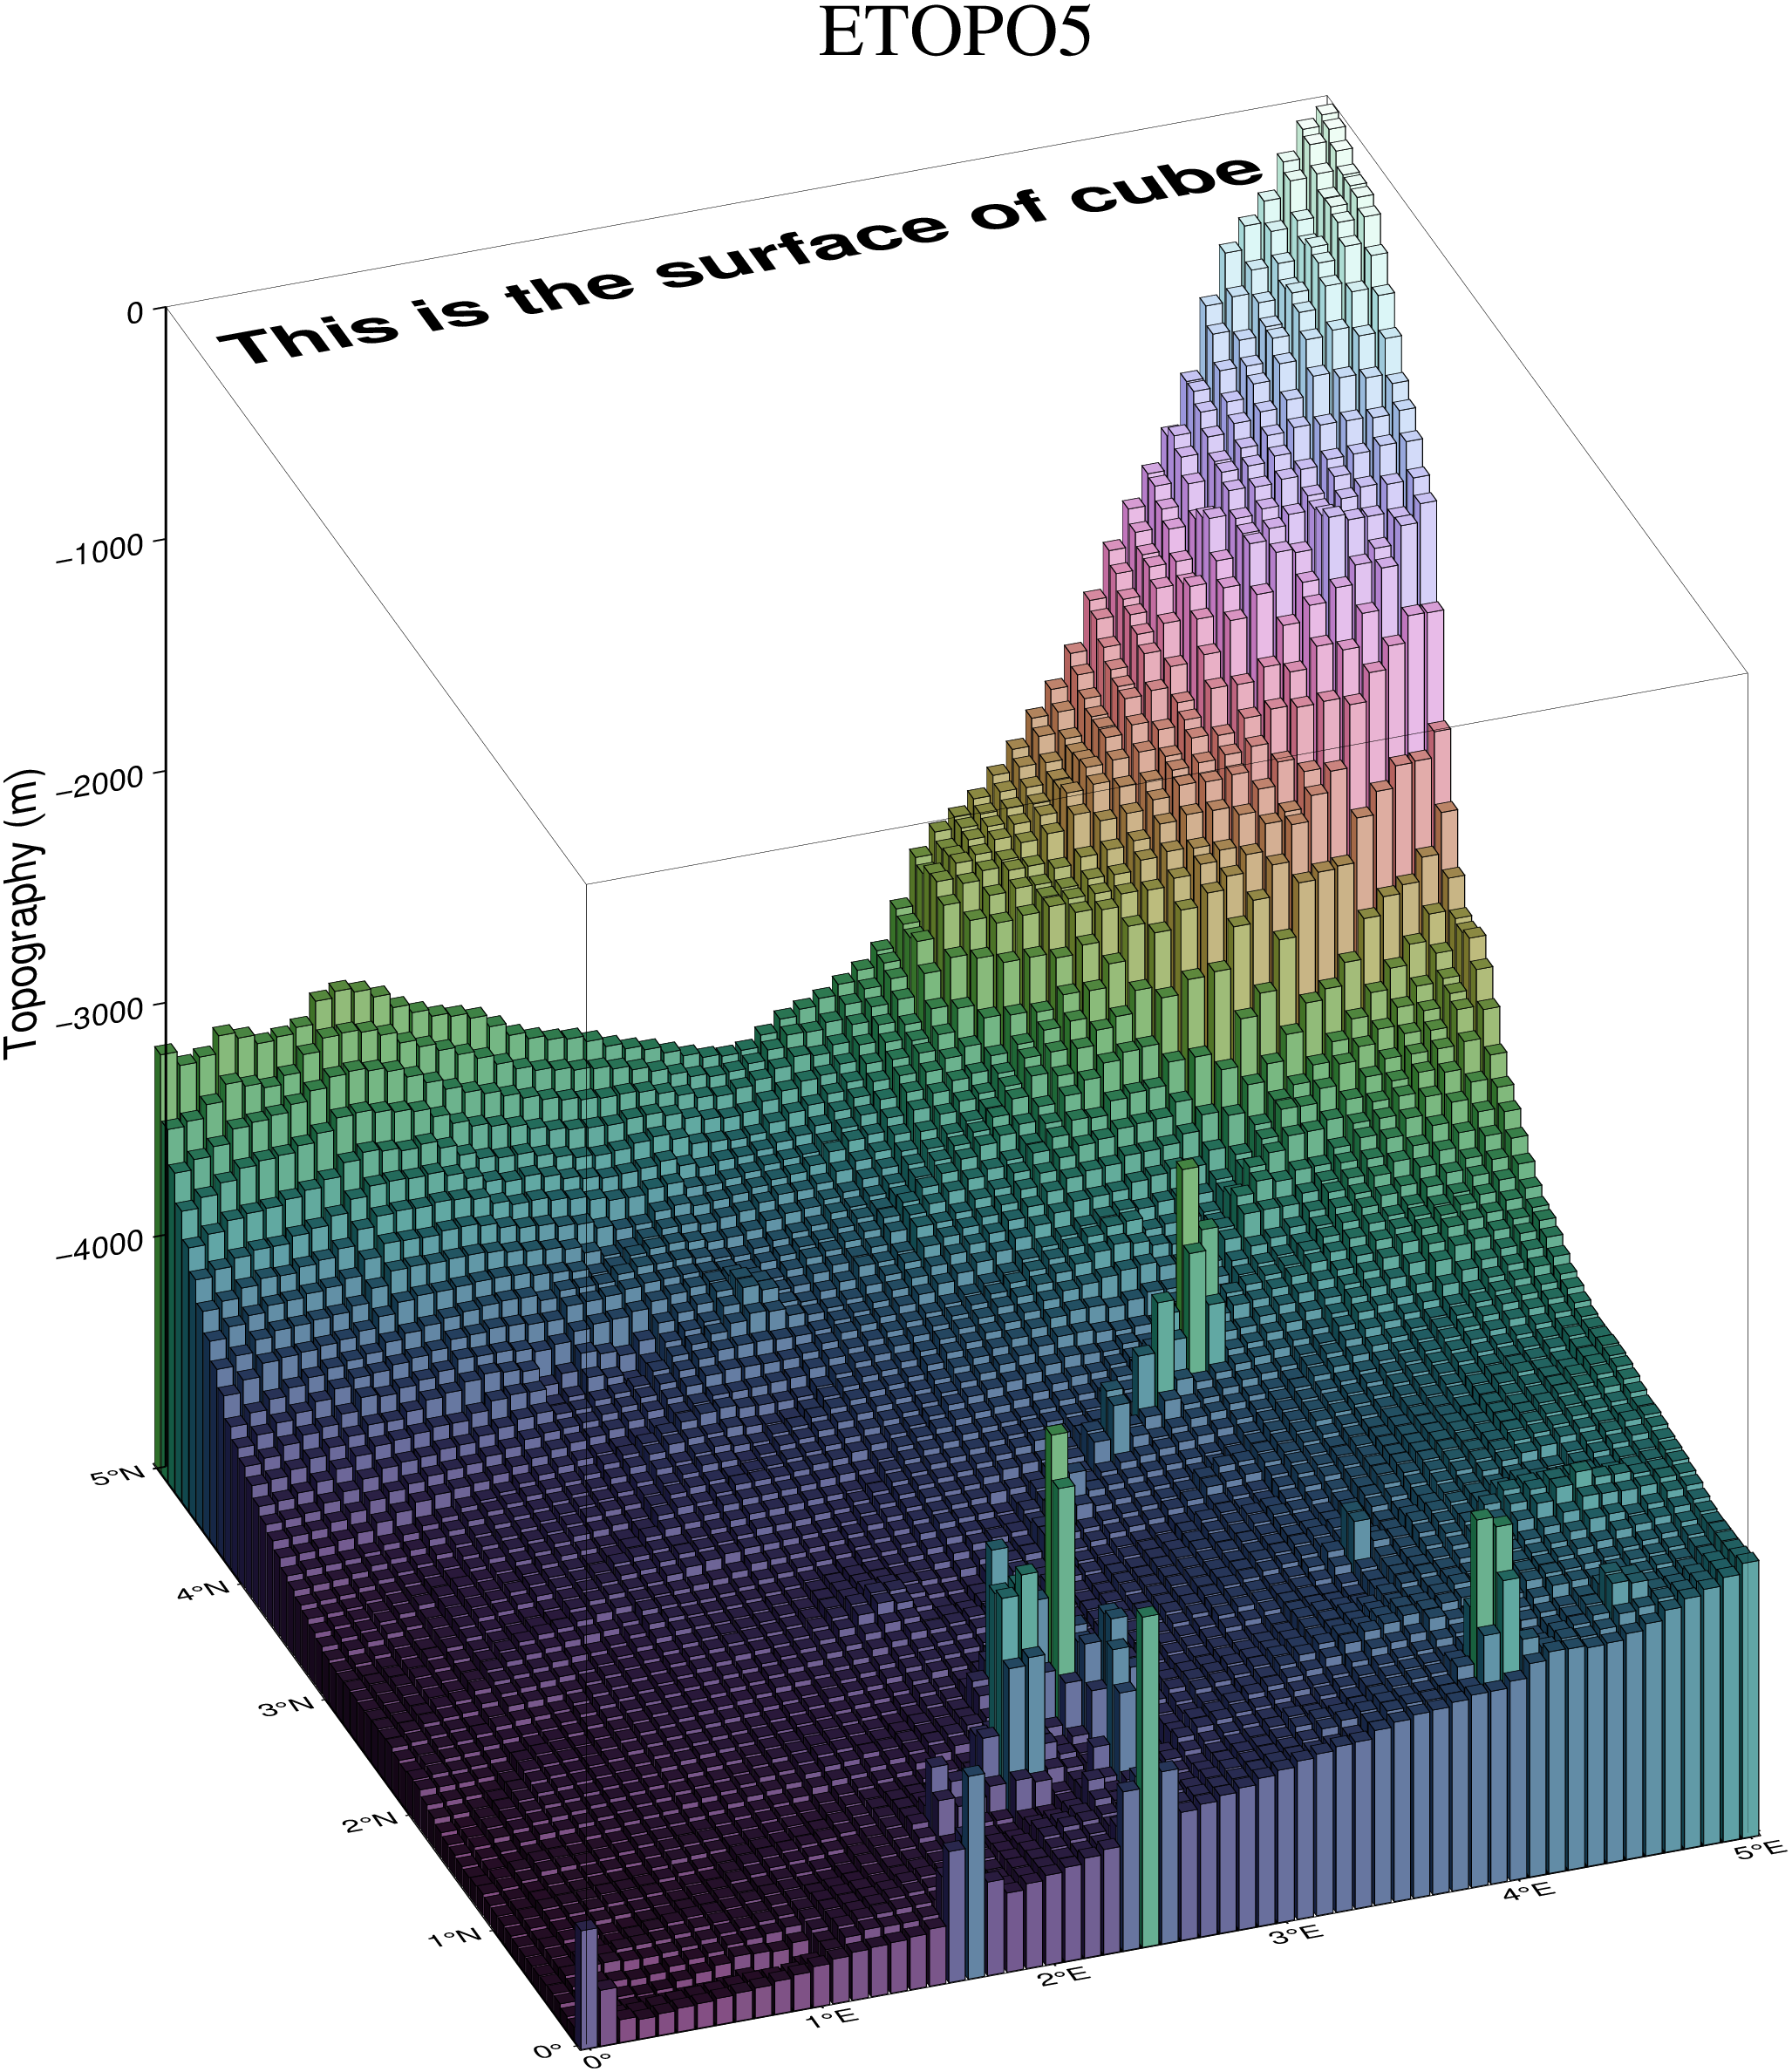
The program [plot3d] allows us to plot three-dimensional symbols, including columnar plots. As a simple demonstration, we will convert a gridded netCDF of bathymetry into an ASCII xyz table and use the height information to draw a 2-D histogram in a 3-D perspective view. We also use the height information to set to color of each column via a CPT file. Our gridded bathymetry file is the 5 arc-minute global relief. Depth ranges from -5000 meter to sea-level. We produce the Figure by running this script:
usingGMTC =makecpt(color=:cubhelix, T=(-5000,0))bar3(gmtread("@earth_relief_05m_g", region=(0,5,0,5)), region=(0,5,0,5,-5000,0), base=-5000, frame=(annot=1, axes=:WSneZ, title=:ETOPO5, cube=true), zaxis=(annot=1000, label="Topography (m)"), color=C, lw=:thinnest, proj=:Mercator, figsize=12, zsize=13, view=(200,30))text!(mat2ds([0.14.7], "This is the surface of cube"), JZ=true, Z=0, font=(24,"Helvetica-Bold"), justify=:TL, show=true)