using GMT

bar(rand(10), show=true)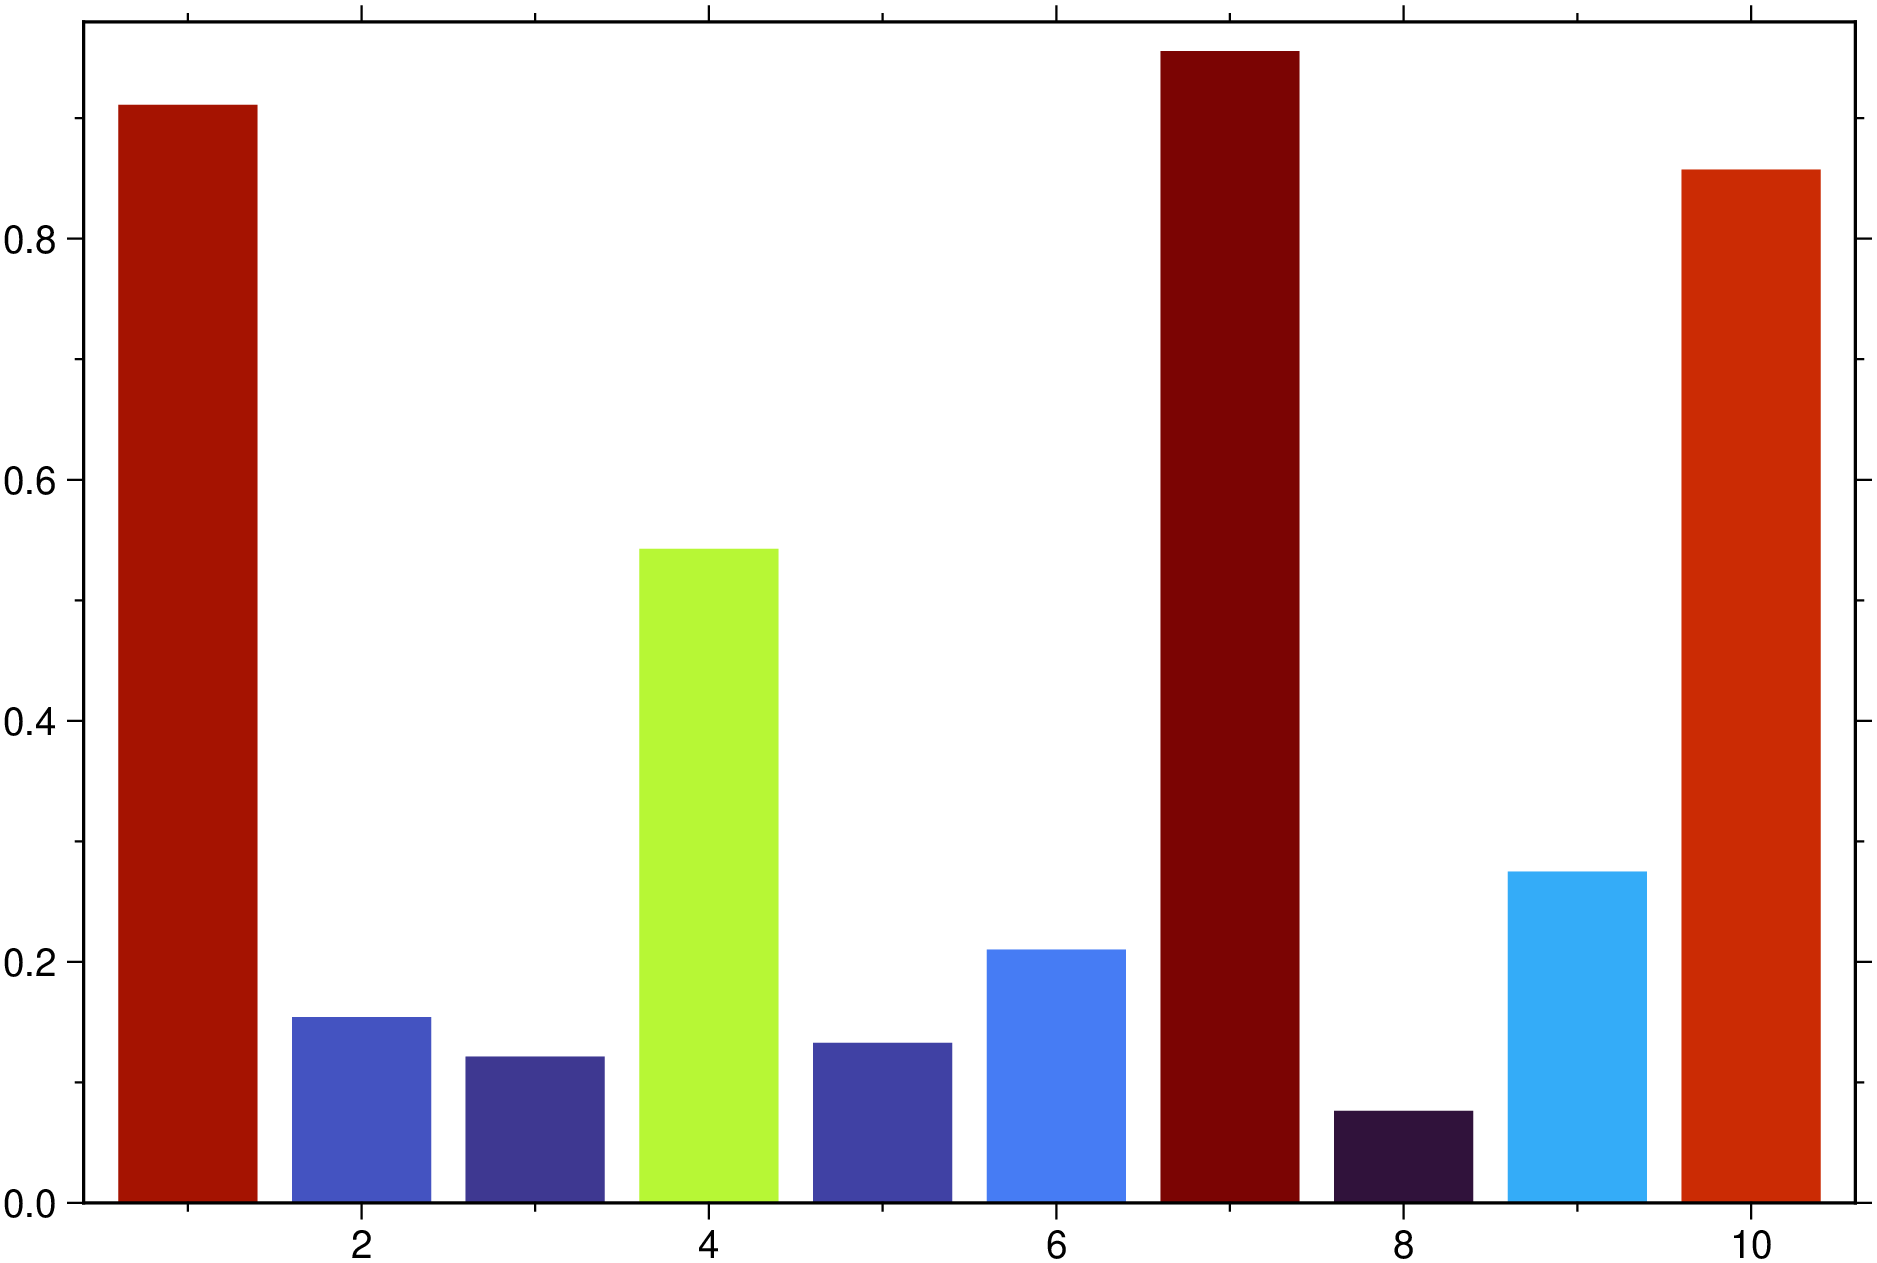
bar(cmd0::String="", arg1=[]; kwargs...)Reads (x,y) pairs and plots a bar graph. This module is a subset of plot to make it simpler to draw bar plots. So not all (fine) controlling parameters are listed here. For a finer control, user should consult the plot module.
If input is a MxN array and N > 2 it will plot a bar-group with M groups and N-1 bars in each group (first column holds always the coordinates).
B or axes or frame
Set map boundary frame and axes attributes. Default is to draw and annotate left, bottom and vertical axes and just draw left and top axes. More at frame
J or proj or projection : – proj=
Select map projection. More at proj
R or region or limits : – limits=(xmin, xmax, ymin, ymax) | limits=(BB=(xmin, xmax, ymin, ymax),) | limits=(LLUR=(xmin, xmax, ymin, ymax),units=“unit”) | …more
Specify the region of interest. More at limits. For perspective view view, optionally add zmin,zmax. This option may be used to indicate the range used for the 3-D axes. You may ask for a larger w/e/s/n region to have more room between the image and the axes.
G or markerfacecolor or MarkerFaceColor or markercolor or mc or fill
Select color or pattern for filling of symbols [Default is no fill]. Note that plot will search for fill and pen settings in all the segment headers (when passing a GMTdaset or file of a multi-segment dataset) and let any values thus found over-ride the command line settings (but those must be provided in the terse GMT syntax). See Setting color for extend color selection (including color map generation).
bar
Vertical bar extending from base to y. By default, base is 0 and the bar widths are 0.8 of the width in x-units. You can change this by using (in alternative):
cm, inch or point.cm, inch or point.bargap
Controls the gap between the bars. The default is to let a space of 20% of the bar width but this can be changed by providing eithe a gap in the [0-1] interval or in percentage. i.e. bargap=40 or bargap=0.4 will create a space of 40% between the bars.
hbar
Horizontal bar extending from base to x. Same as bar but now with respect to y axis, except that one cannot use width or base to change just those defaults (the use of it is restricted to the vertical bars case).
fill=[“color1”, “color2”, …] | fill=(“color1”, “color2”, …) | fill=(1,2,…)
List of colors used to wrapp the bars inside each group. When using numbers that means patterns codes.
fillalpha=[…]
When fill was used, control the transparency level. Numbers can be floats <= 1.0 or integeres in 0-100 range.
stack
Plot a vertically (or horizontally if hbar=true) stacked group plot. The particular setting stack=:waterfall creates a waterfall chart, which is a form of data visualization that helps in understanding the cumulative effect of sequentially introduced positive or negative values. The input data for this option is a vector or one row matrix with the heights of each bar. A height o zero (0) has the special meaning of plotting the total accumulated up to that value. For these plots we can connect the bars with the connector=true or connector=pen option. Bar colors (three for the waterfall type) are controlled with the fill option but default values are provided. See example below.
figname or savefig or name : – figname=name.png
Save the figure with the figname=name.ext where ext chooses the figure image format.
A simple bar plot with 10 bars and automatic limits.
using GMT
bar(rand(10), show=true)
A bar group with selected colors and transparency.
bar([0. 1 2 3; 1 2 3 4], fillalpha=[0.3 0.5 0.7], fill=["red" "green" "blue"], show=true)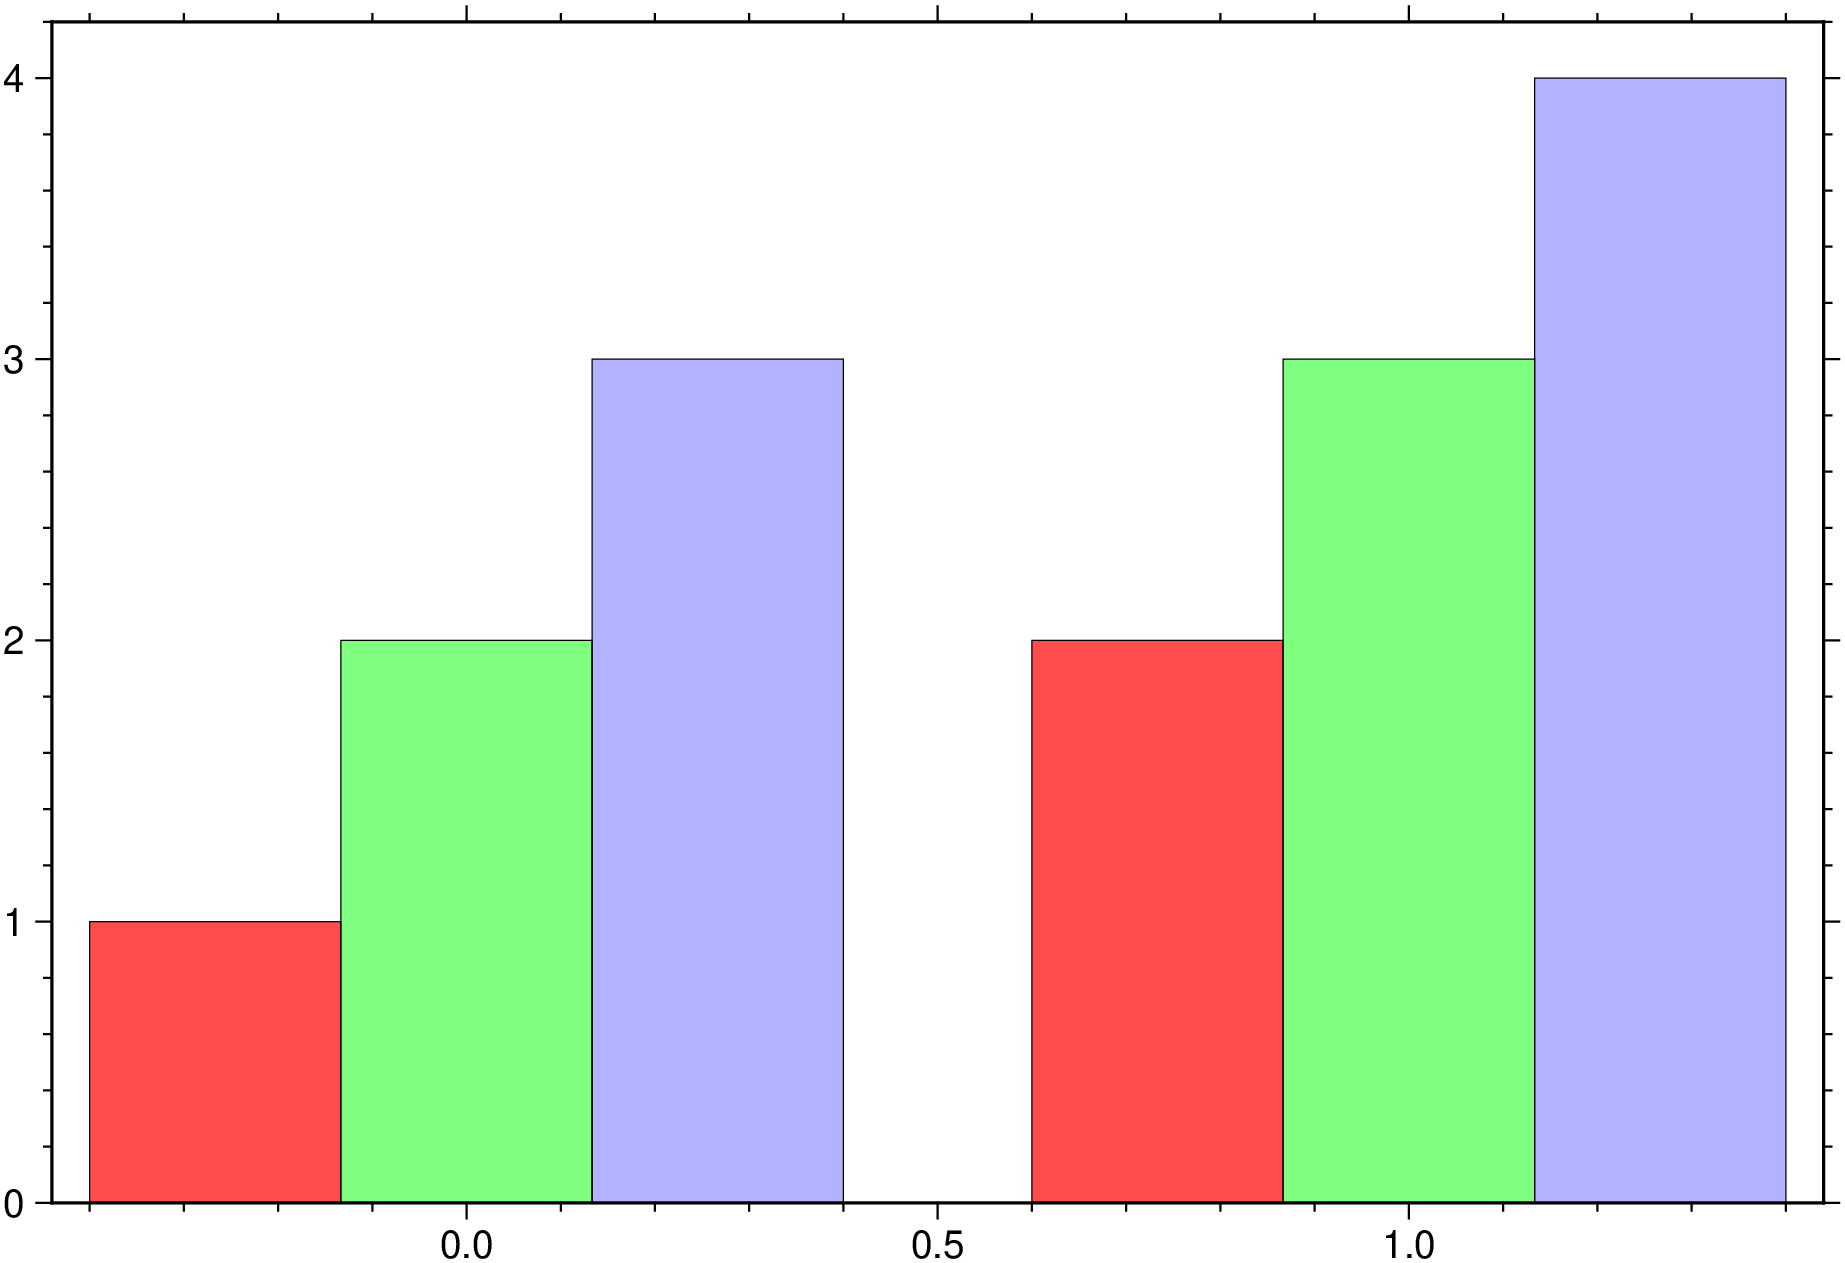
A bar group with bars filled with patterns.
bar([0 1 2 3; 1 2 3 4], fill=(1,2,3), show=1)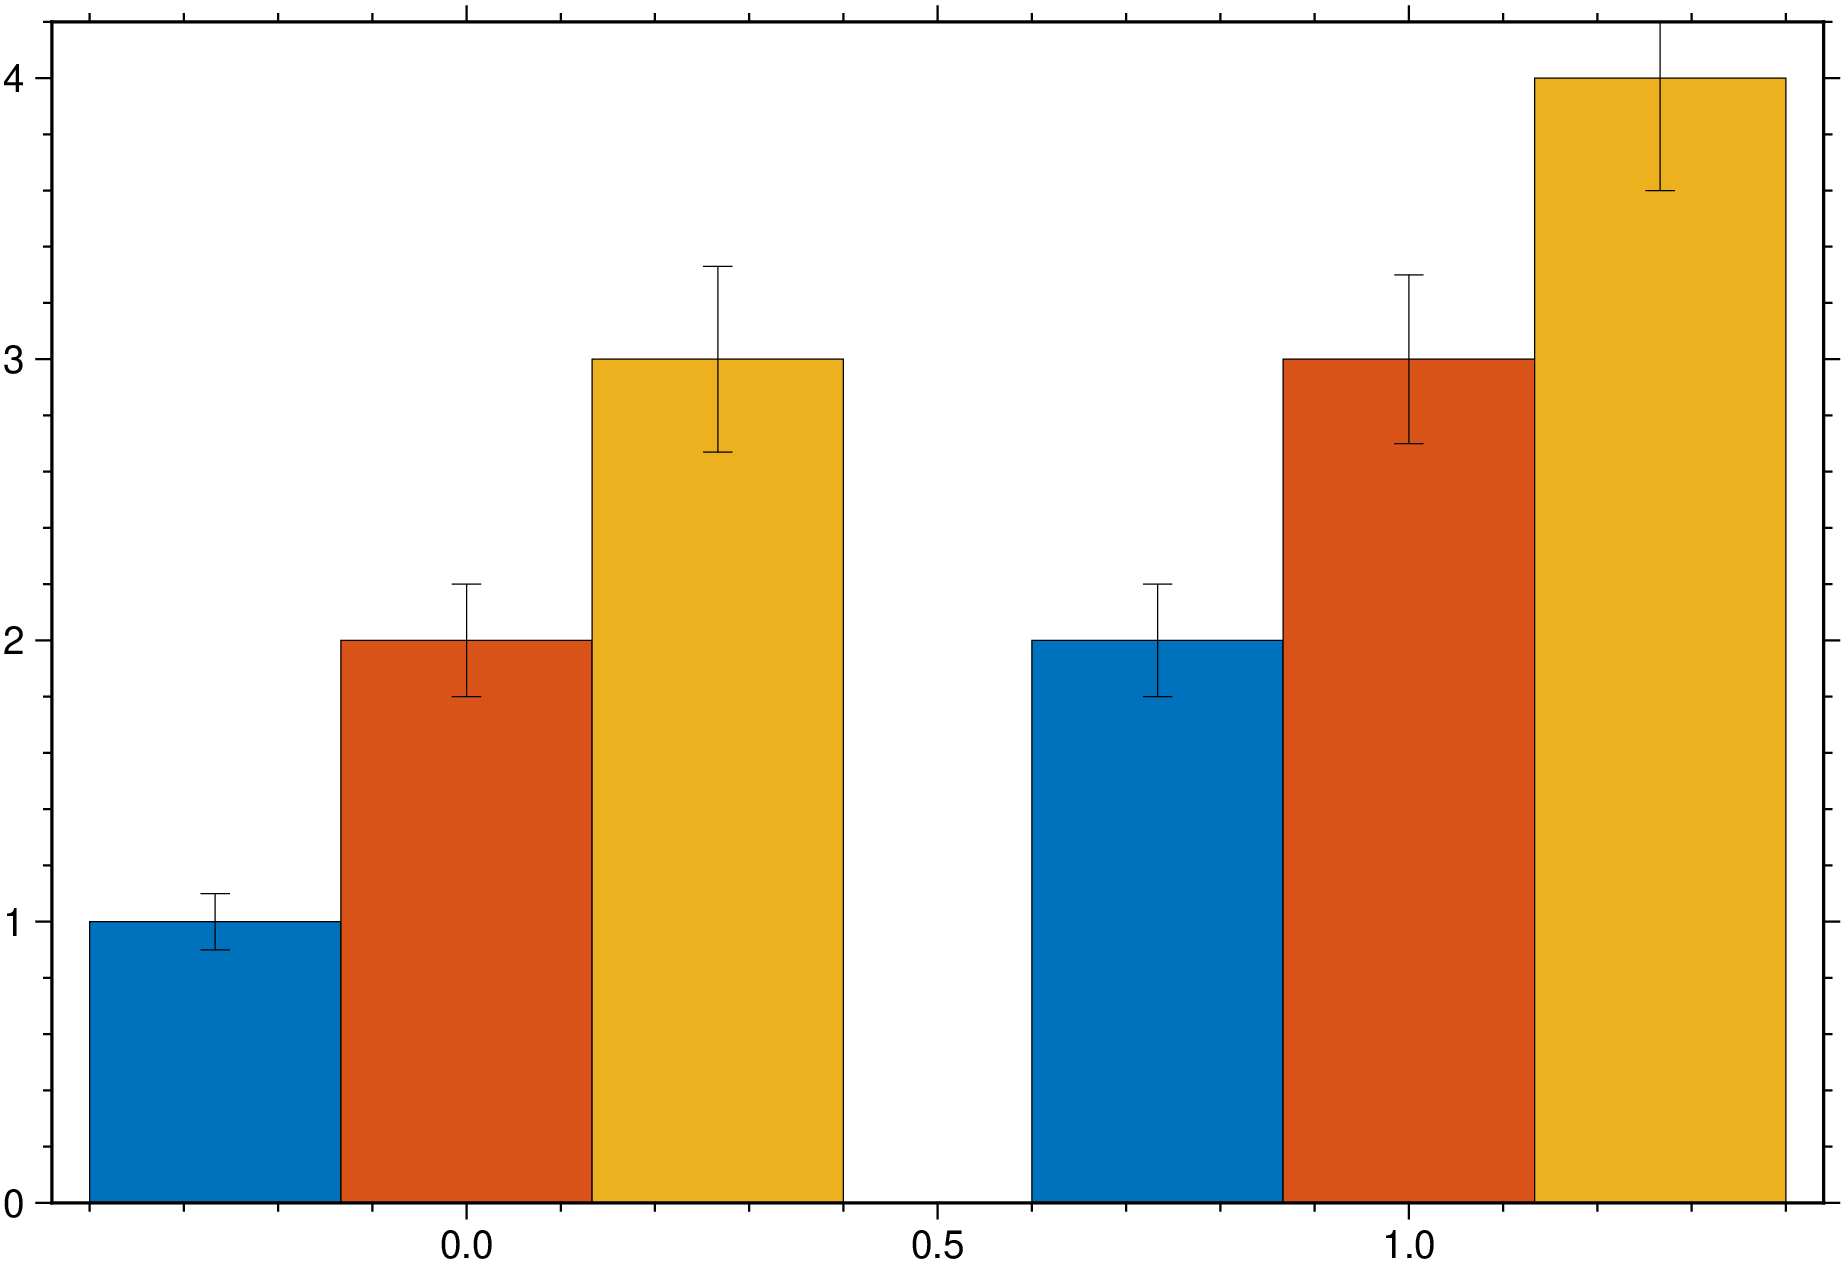
A bar group with error bars
bar([0. 1 2 3; 1 2 3 4], error_bars=(y=[0.1 0.2 0.33; 0.2 0.3 0.4],), show=true)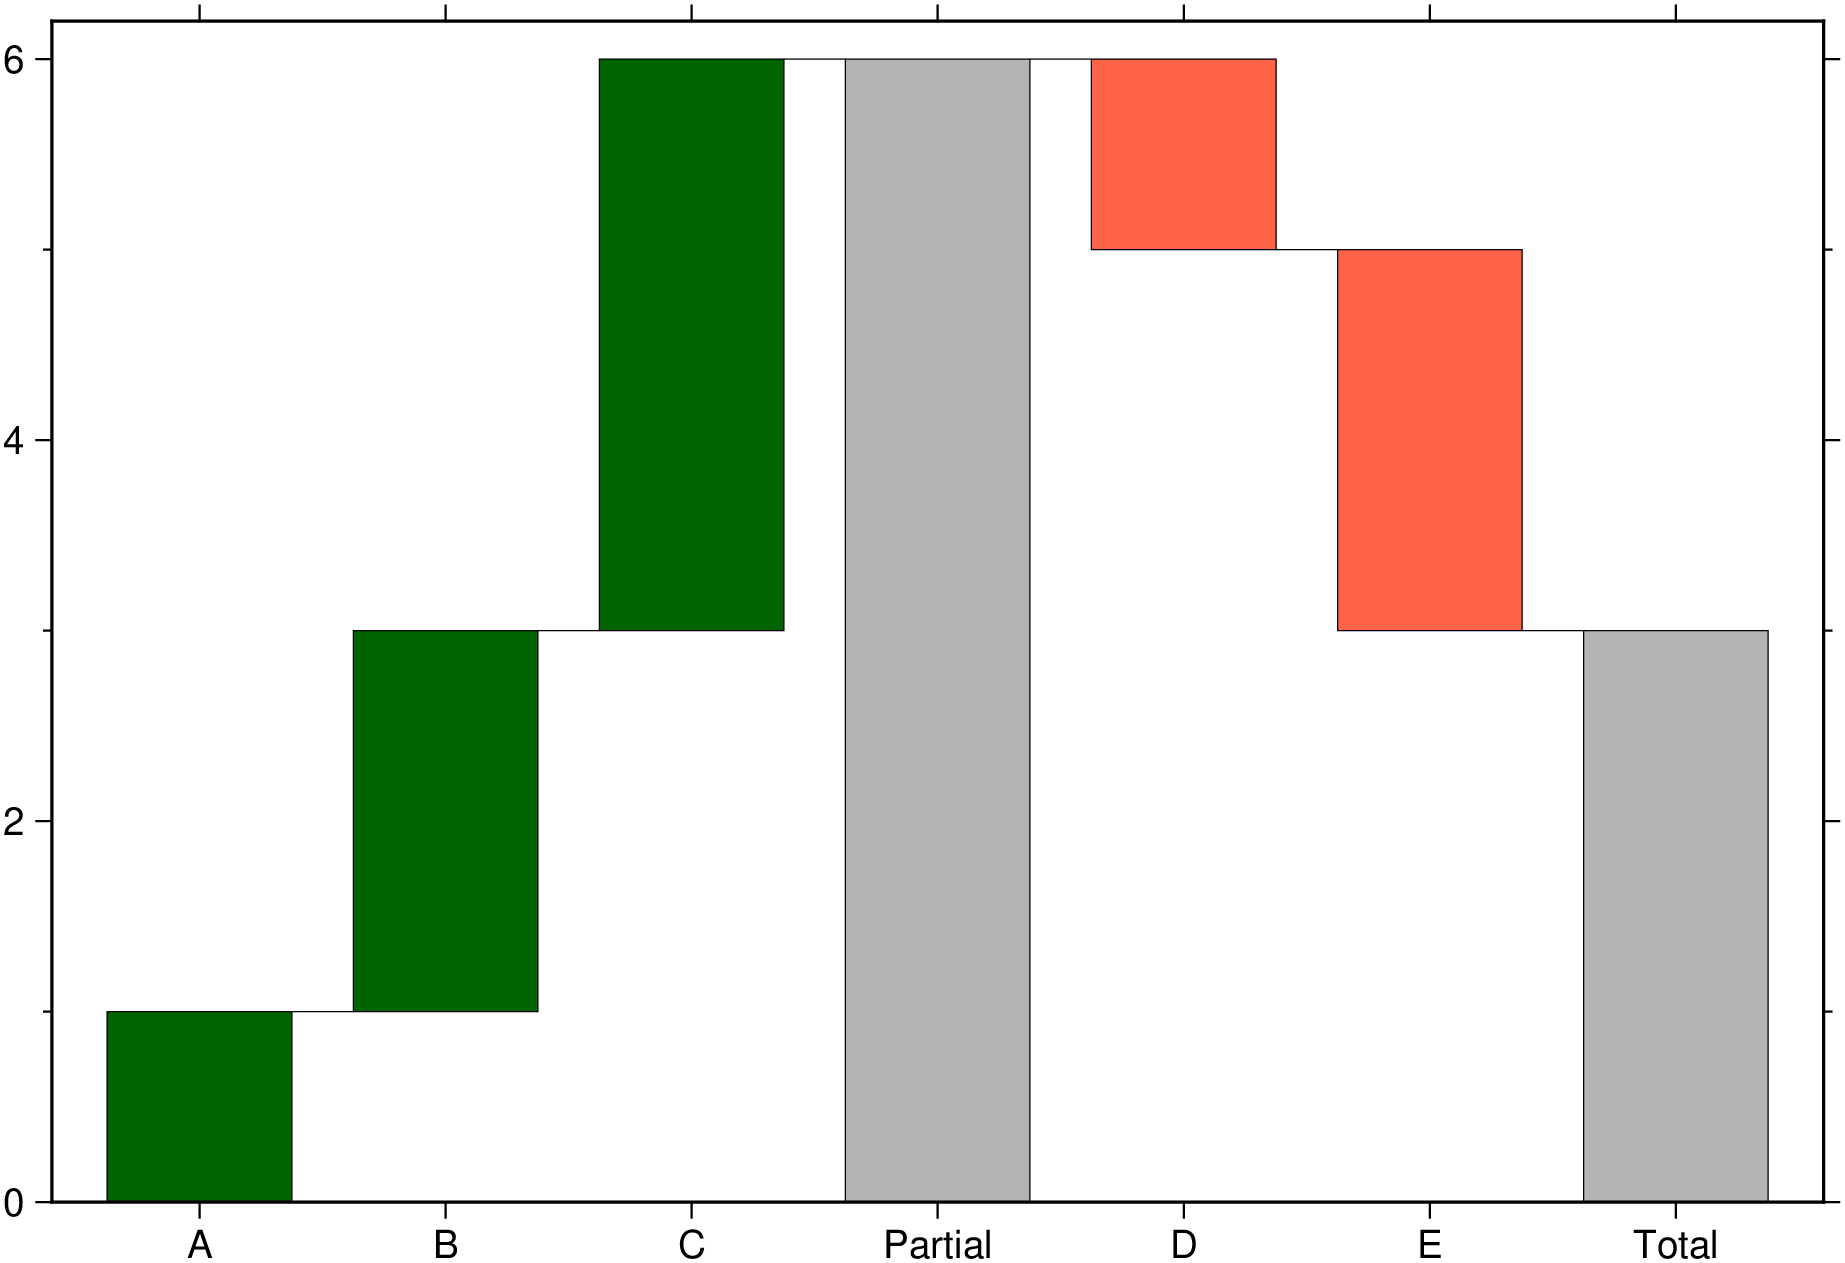
A waterfall chart.
bar([1 2 3 0 -1 -2 0], stacked=:water, connector=true, bargap=25,
    xticks=(:A, :B, :C, :Partial, :D, :E, :Total), show=true)
[Bar plots] examples.
The GMT man page
This function has multiple methods:
bar(cmd0::String; ...) - plot.jl:474bar(; ...) - plot.jl:474bar(f::Function; ...) - plot.jl:499bar(arg; kw...) - plot.jl:507bar(cmd0::String, arg; first, kw...) - plot.jl:474bar(f::Function, range_x; first, kw...) - plot.jl:499bar(arg1, arg2; first, kw...) - plot.jl:505