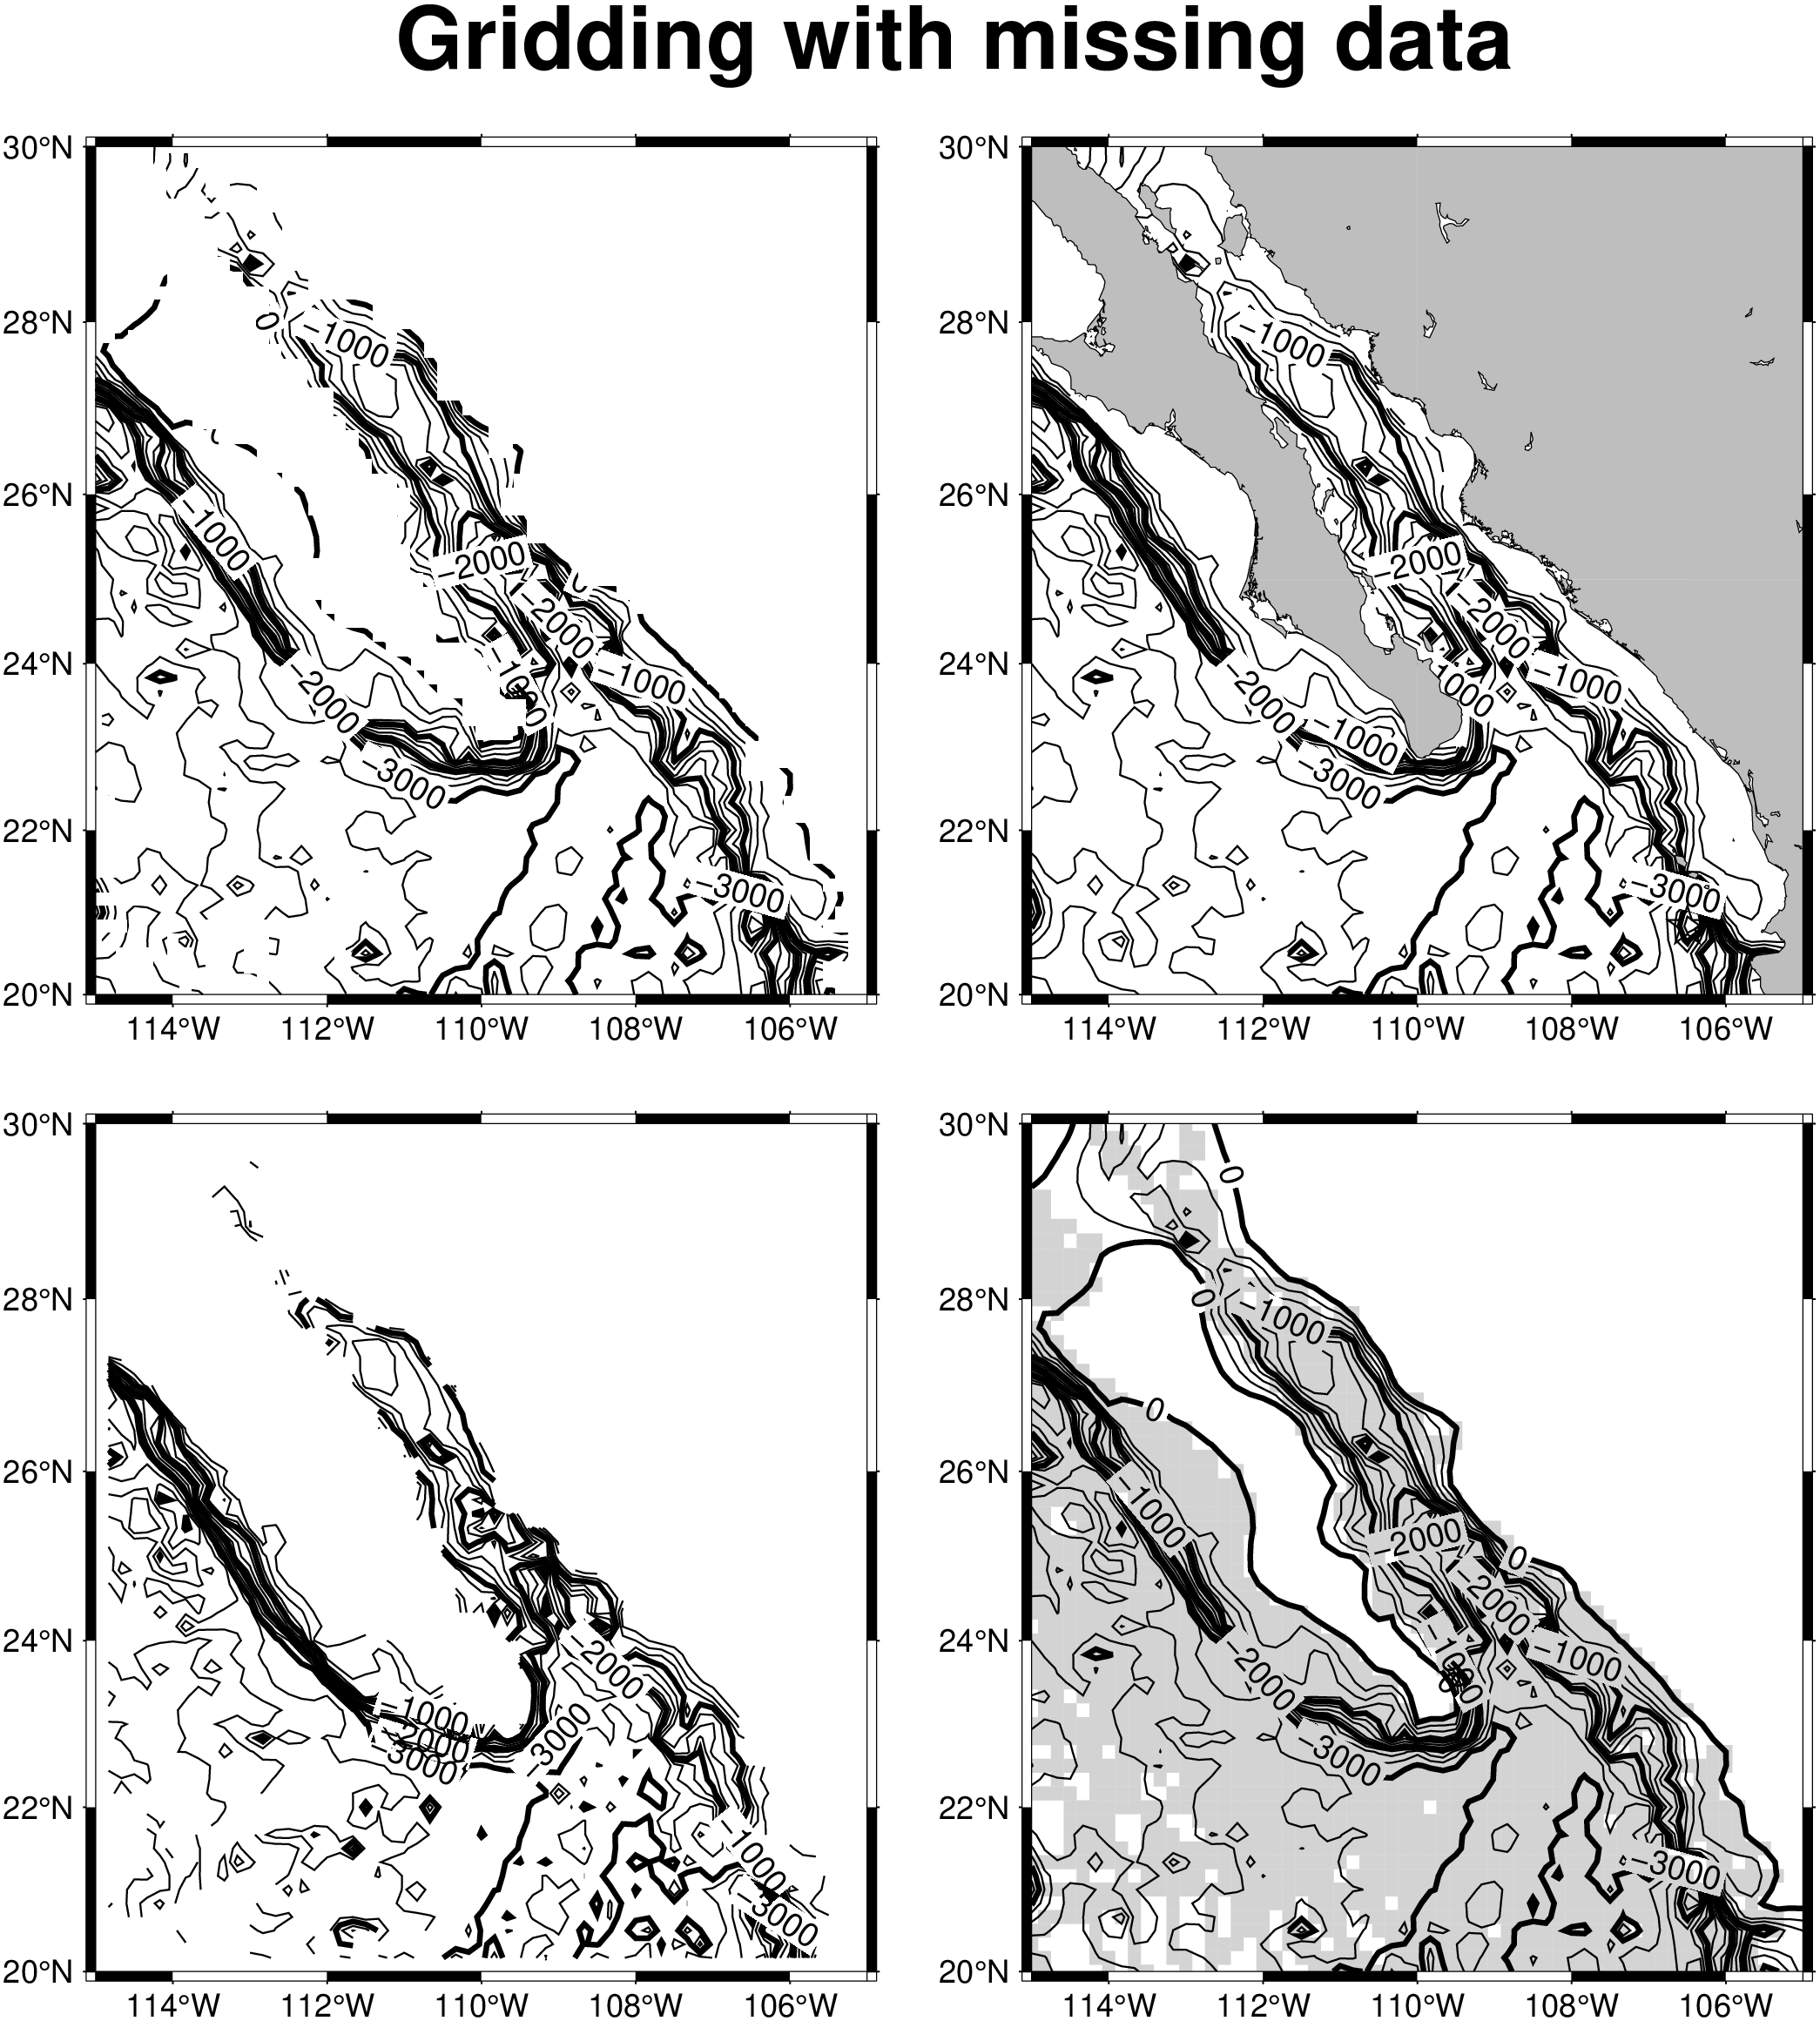
(15) Gridding, contouring, and masking of unconstrained areas

This example demonstrates some off the different ways one can use to grid data in GMT, and how to deal with unconstrained areas. We first convert a large remote ASCII file to binary with [gmtconvert] since the binary file will read and process much faster. Our lower left plot illustrates the results of gridding using a nearest neighbor technique ([nearneighbor]) which is a local method: No output is given where there are no data. Next (lower right), we use a minimum curvature technique ([surface]) which is a global method. Hence, the contours cover the entire map although the data are only available for portions of the area (indicated by the gray areas plotted using [mask]). The top left scenario illustrates how we can create a clip path (using [mask]) based on the data coverage to eliminate contours outside the constrained area. Finally (top right) we simply employ coast to overlay gray land masses to cover up the unwanted contours, and end by plotting a red star at the deepest point on the map with [plot]. This point was extracted from the grid files using [grdinfo].

using GMT
GMT.resetGMT() # hide

ship_d = gmtread("@ship_15.txt")
region = gmtinfo(ship_d, inc=1)

R = region.text[1][3:end]
Gship  = nearneighbor(ship_d, region=R, inc="10m", S="40k")
grdcontour(Gship, frame=(axes=:WSne, annot=2), cont=250, annot=1000,
           labels=(dist=5,), proj=:merc, figsize=7.5)

ship_10m = blockmedian(ship_d, region=R, inc="10m")
Gship = surface(ship_10m, region=R, inc="10m")
mask!(ship_d, region=R, inc="10m", fill=:lightgray, tiles=true, xshift=9.1)
grdcontour!(Gship, cont=250, annot=1000, labels=(dist=5,), range=(-8000,0), frame=:same)

mask!(ship_10m, region=R, inc="10m", xshift=-9.1, yshift=9.5, frame=:same)
grdcontour!(Gship, cont=250, annot=1000, labels=(dist=5,), range=(-8000,0))
mask!(end_clip_path=true)   

Gship_clipped = grdclip(Gship, above="-1/NaN")
grdcontour!(Gship_clipped, cont=250, annot=1000, labels=(dist=5,), range=(-8000,0), xshift=9.1)
coast!(land=:gray, shore=:thinnest, frame=:same)
info = grdinfo(Gship, C="n", minmax_pos=true)
plot!(info, marker=:star, ms=0.4, i="10,11", lw=:thick)
text!(text_record([-0.3 3.6], "Gridding with missing data"), region=(0,3,0,4),
      font=(24,"Helvetica-Bold"), justify=:CB, no_clip=true, figscale=2.5,
      proj=:linear, show=true)