Gallery
GMT.jl Gallery
Classic GMT examples ported to Julia. Each example demonstrates specific GMT.jl capabilities.
Example 01 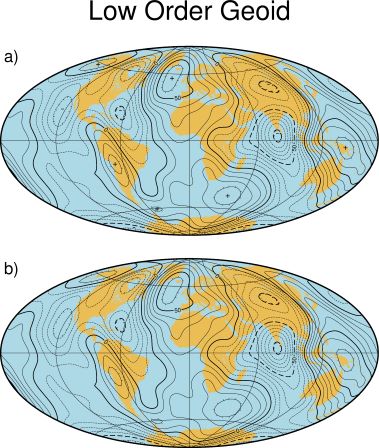 Contour maps
Example 02 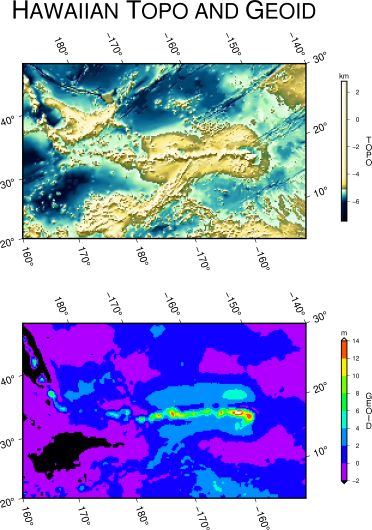 Image presentations
Example 03 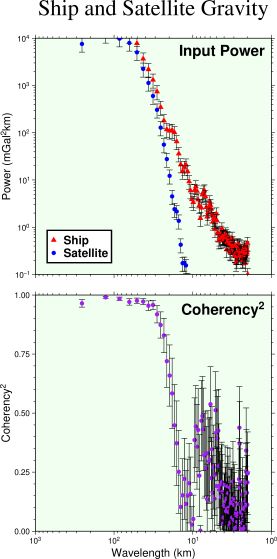 Spectral estimation and xy-plots
Example 04 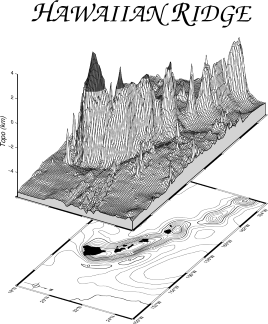 A 3-D perspective mesh plot
Example 05 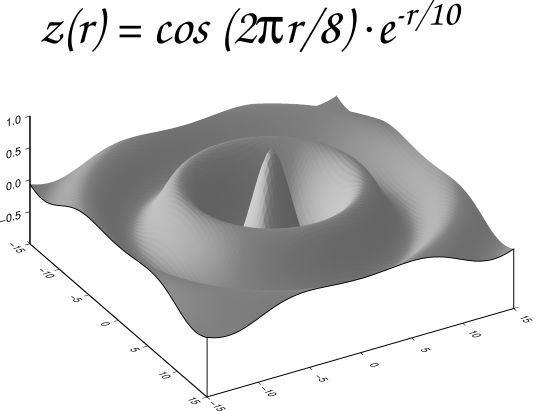 A 3-D illuminated surface (in bw)
Example 06 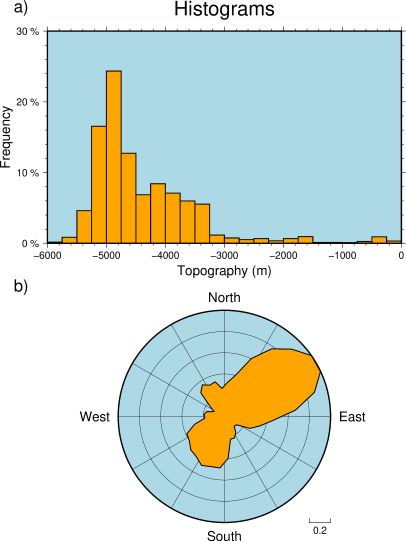 Plotting of histograms
Example 07 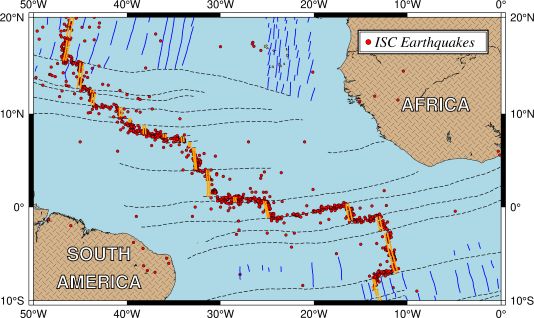 A simple location map
Example 08 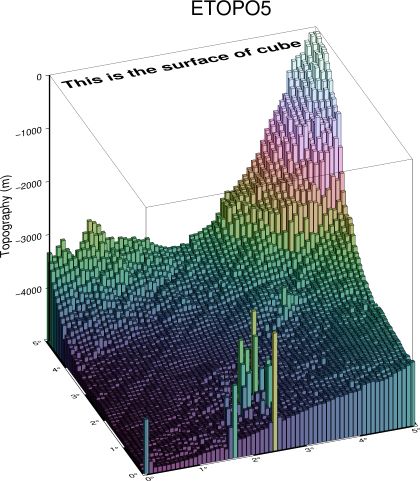 A 3-D histogram
Example 09 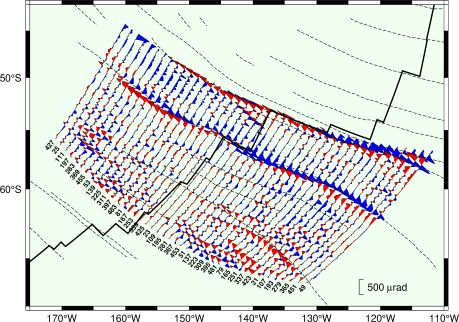 Time-series along tracks
Example 10 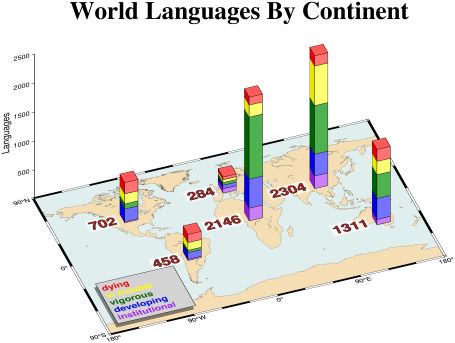 A geographical bar graph plot
Example 12 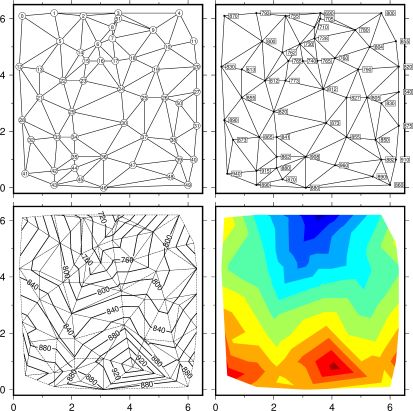 Optimal triangulation of data
Example 13 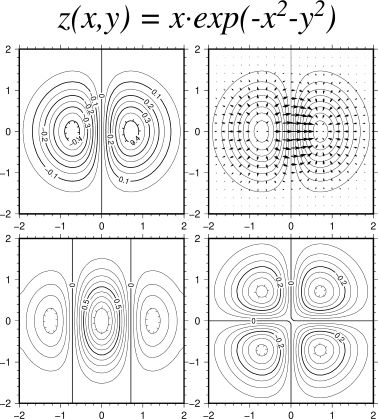 Plotting of vector fields
Example 14 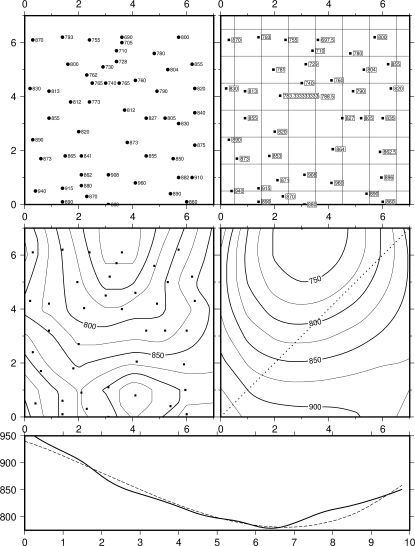 Gridding of data and trend surfaces
Example 15 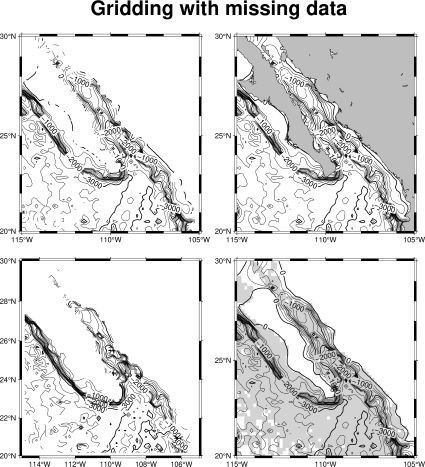 Gridding, contouring, and masking of unconstrained areas
Example 16 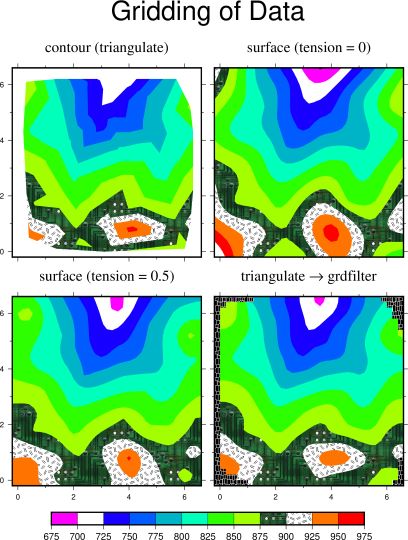 Gridding of data, continued
Example 17 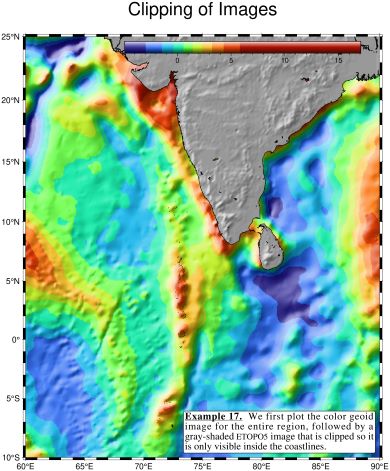 Images clipped by coastlines
Example 18 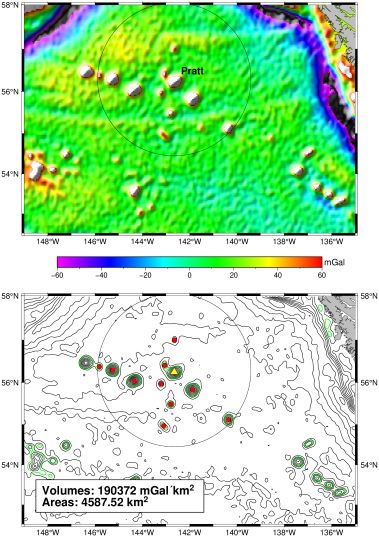 Volumes and Spatial Selections
Example 19 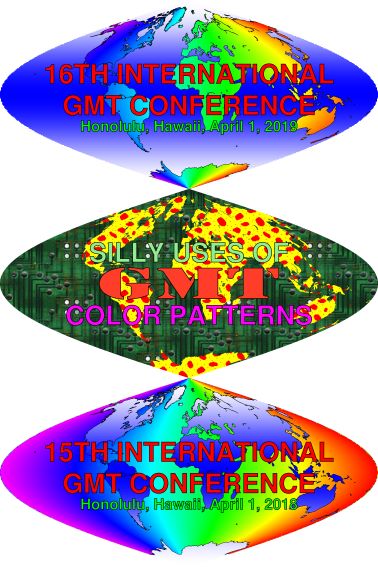 Color patterns on maps
Example 20 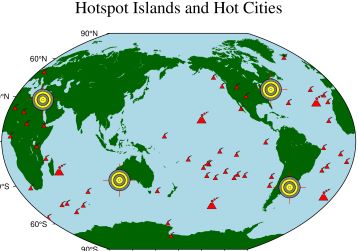 Custom plot symbols
Example 21 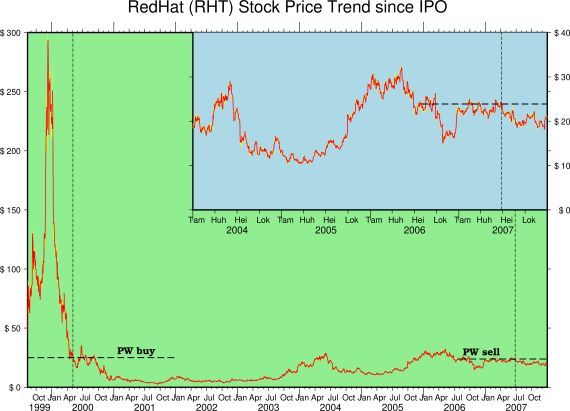 Time-series of RedHat stock price
Example 22 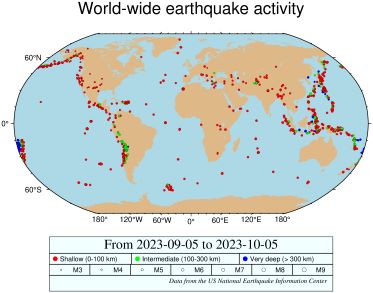 World-wide seismicity of last month
Example 23 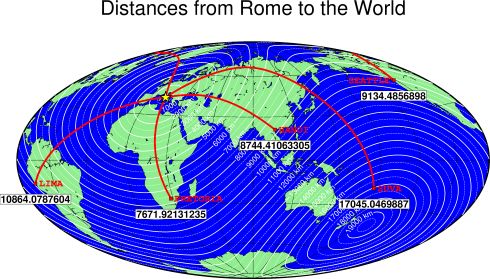 All great-circle paths lead to Rome
Example 24 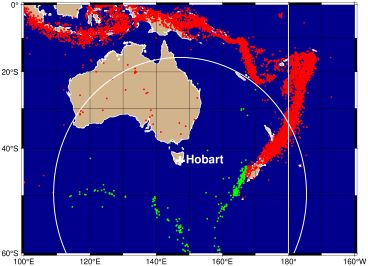 Data selection based on geospatial criteria
Example 25 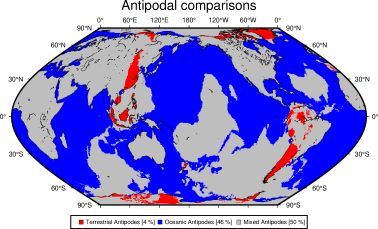 Global distribution of antipodes
Example 26 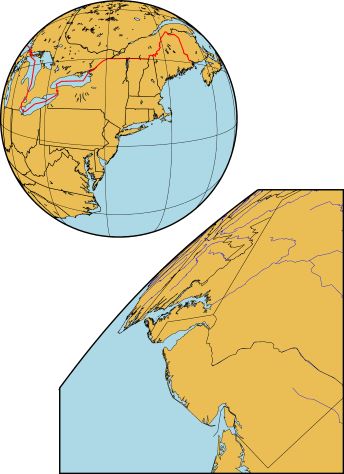 General vertical perspective projection
Example 27 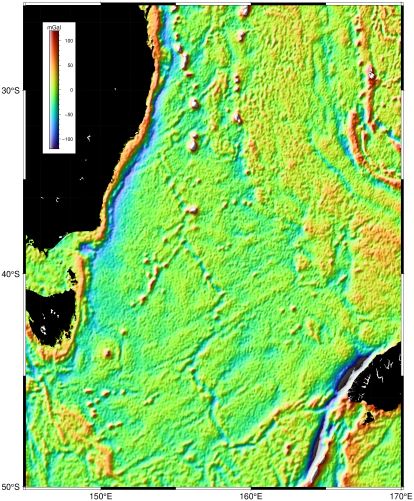 Plotting Sandwell/Smith Mercator img grids
Example 28 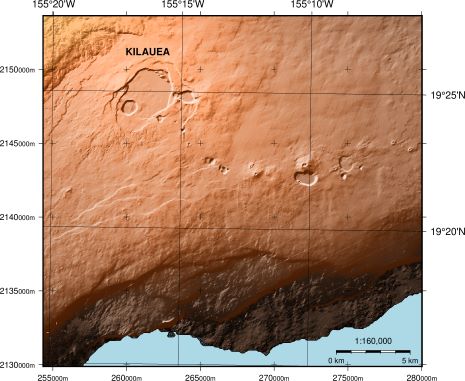 Mixing UTM and geographic data sets
Example 29 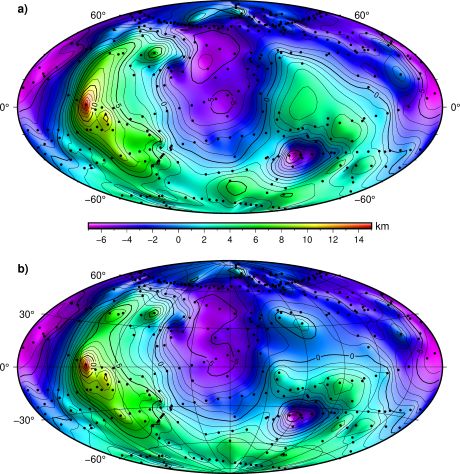 Gridding spherical surface data using splines
Example 30 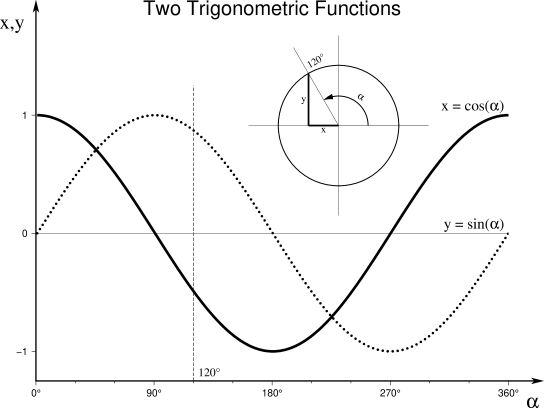 Trigonometric functions plotted in graph mode
Example 33 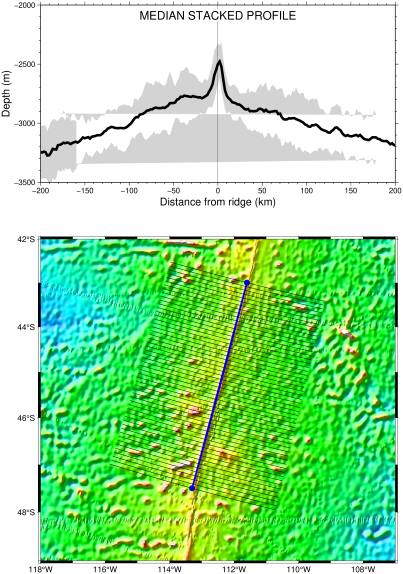 Stacking automatically generated cross-profiles
Example 34 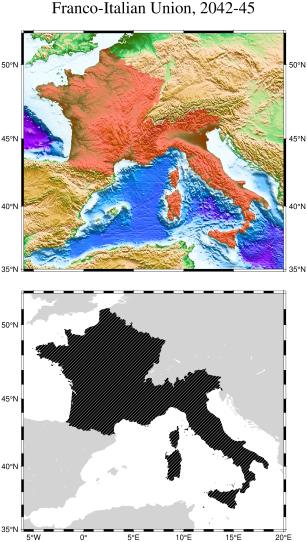 Using country polygons for plotting and shading
Example 35 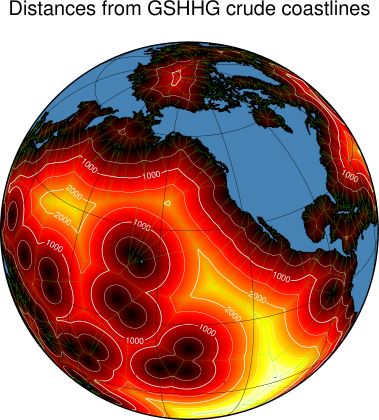 Spherical triangulation and distance calculations
Example 36 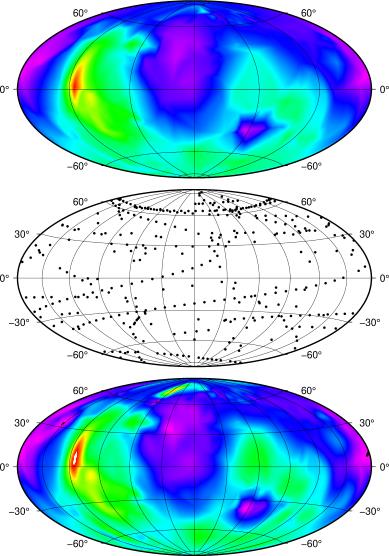 Spherical gridding using Renka’s algorithms
Example 40 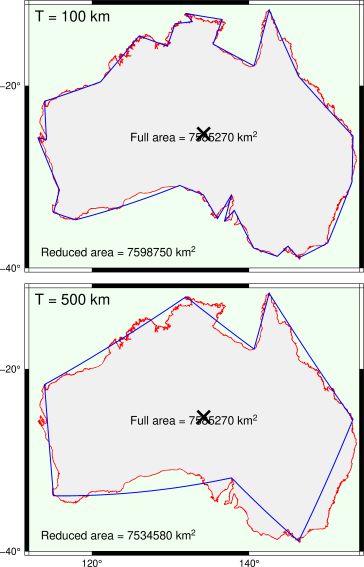 Line simplification
Example 41 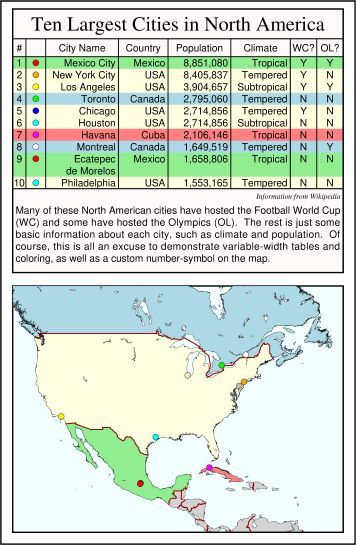 Legend with tables
Example 42 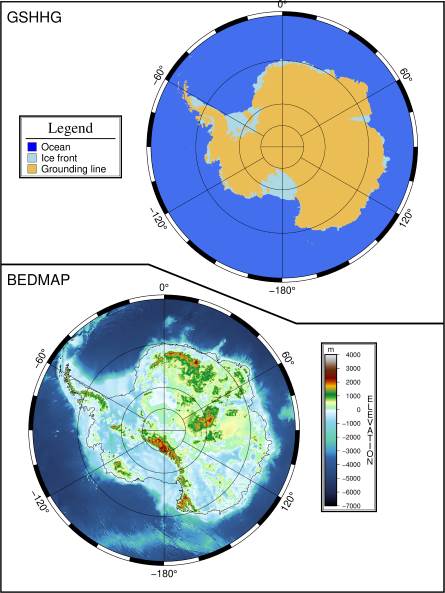 Antarctica and stereographic data
Example 44 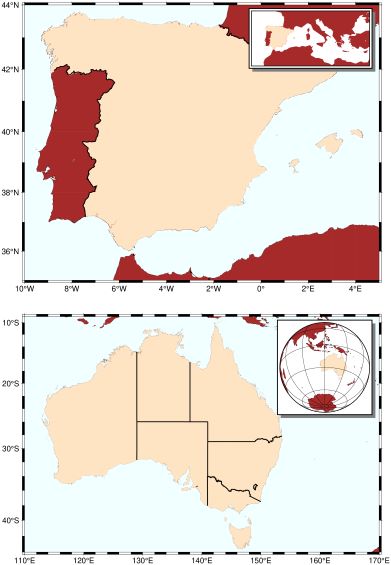 Map insets
Example 45 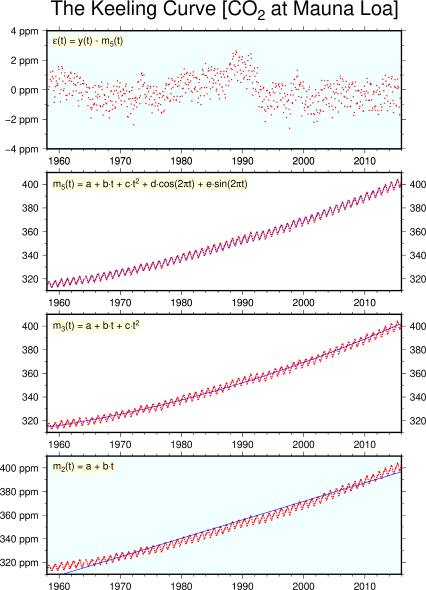 Trend modeling
Example 46 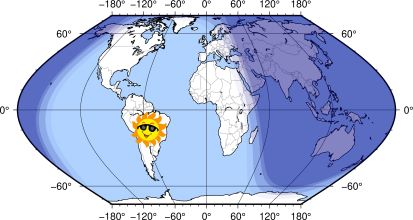 Day-light terminators and other sunlight parameters
Example 48 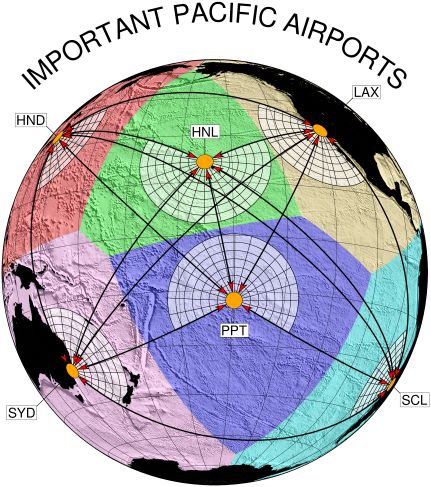 Line networks, map embellishments, and curved titles