• Home
  • Documentation
    • Overview

    • GMT Modules
    • GMT.jl Types
    • GMT.jl Extensions
    • GDAL Functions
    • Solids Functions
    • Image Processing
    • Common Features
    • Alphabetical List
  • Examples
  • Gallery (GMT Gallery)
    • Overview

    • (1) Contour maps
    • (2) Image presentations
    • (3) Spectral estimation and xy-plots
    • (4)
    • (5) A 3-D illuminated surface
    • (6) Plotting of histograms
    • (7) A simple location map
    • (8) A 3-D histogram
    • (9) Time-series along tracks
    • (10) A geographical bar graph plot
    • (11)
    • (12) Optimal triangulation of data
    • (13) Plotting of vector fields
    • (14) Gridding of data and trend surfaces
    • (15) Gridding, contouring, and masking of unconstrained areas
    • (16) Gridding of data, continued
    • (17) Images clipped by coastlines
    • (18) Volumes and Spatial Selections
    • (19) Color patterns on maps
    • (20) Custom plot symbols
    • (21) Time-series of RedHat stock price
    • (22)
    • (23)
    • (24)
    • (25)
    • (26)
    • (27)
    • (28)
    • (29)
    • (30)
  • Tutorials
    • Overview

    • ISC seismicity
    • Landsat 8/9
    • Coastlines
    • US Choropleths
    • @dlakelan choropleths
    • Longest Sail
    • Geospatial vector
    • Texture Shading
    • Mosaics
    • Insets
    • Remote Grids
    • Blender
    • Signal
  • Geophysics
    • Overview

    • Seismicity
    • Earth Tides
    • Weather Data
  • Help
    • Report a Bug
    • Ask a Question

On this page

  • Geophysics Examples

Geophysics

Geophysics Examples

Specialized geophysics applications and examples using GMT.jl.

Seismology

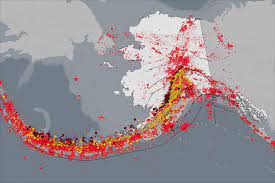
Focal mechanisms, seismicity plots, and earthquake data visualization

Earth Tides

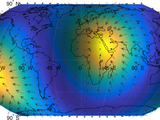
Computing and visualizing Earth tide effects

Weather Maps

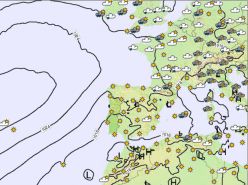
Meteorological data visualization and weather mapping