Plotting beach balls (seismic focal mechanisms) in Julia using GMT.
Plotting beach balls
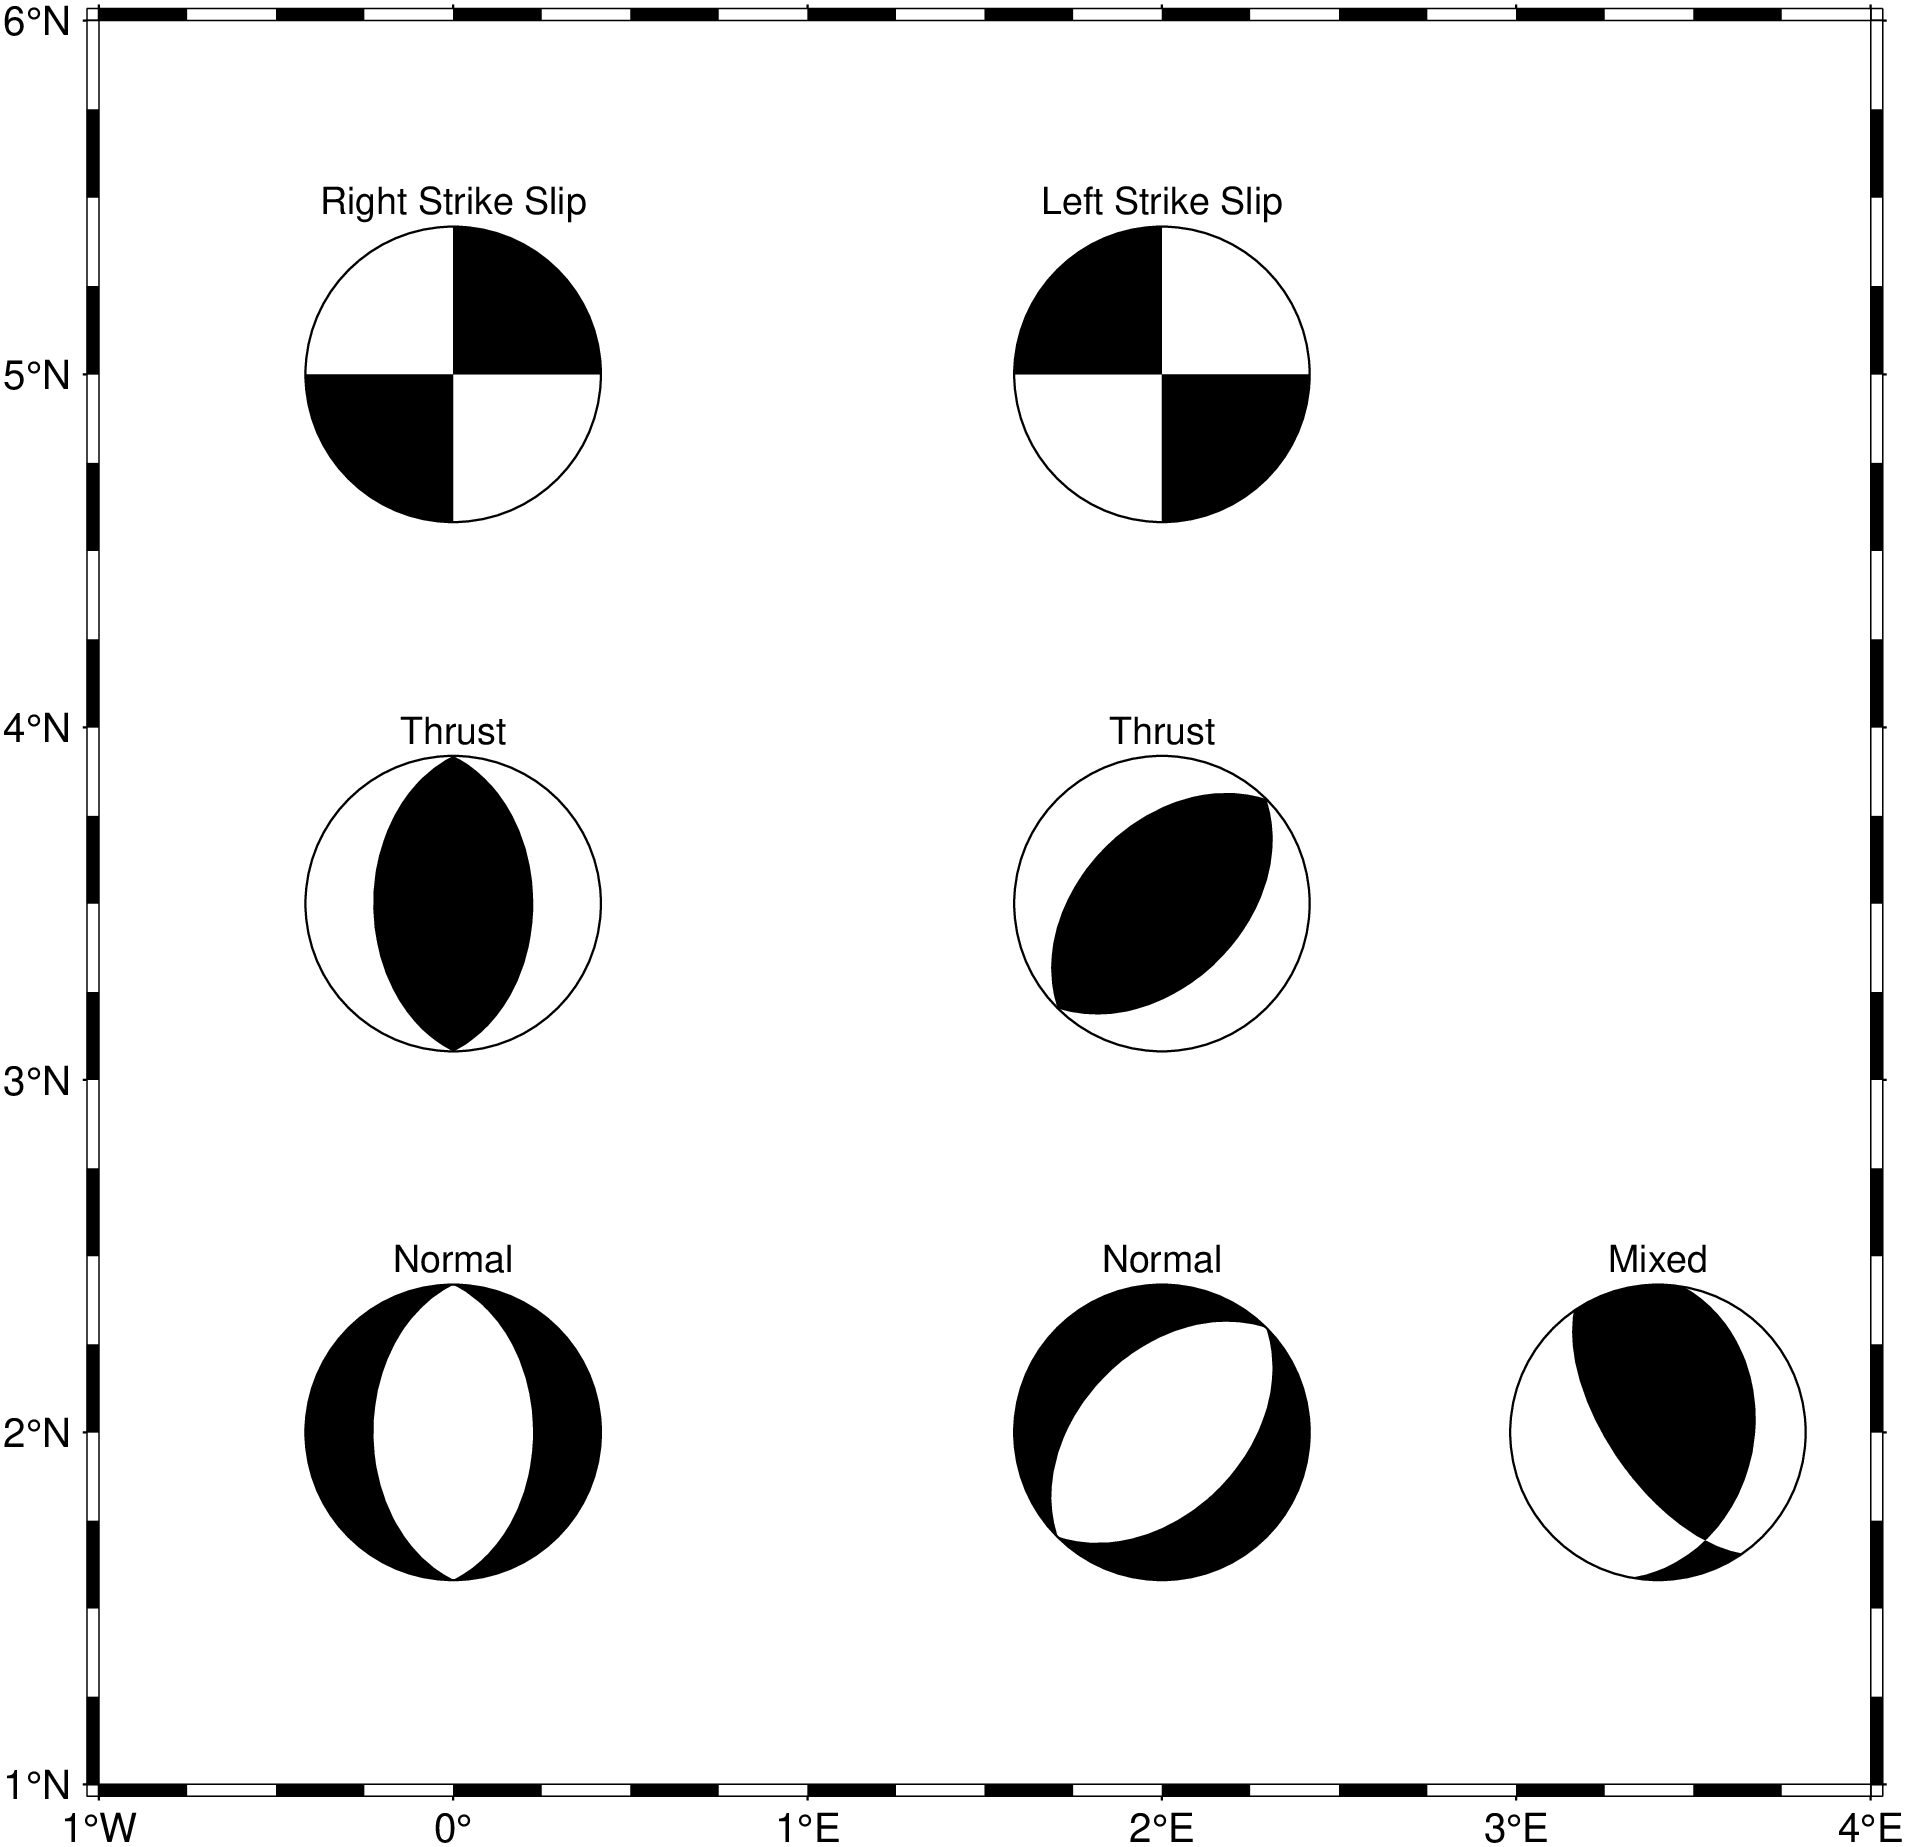
In this synthetic example we will use the Aki-Richards convention and pass the data via a
using GMT resetGMT () # hide # Right lateral Strike Slip = mat2ds ([0.0 5.0 0.0 0 90 0 5 0 0 ],["Right Strike Slip" ]);meca (D, region= (- 1 ,4 ,1 ,6 ), proj=: Mercator, aki= 2.5 , fill=: black)# Left lateral Strike Slip = mat2ds ([2.0 5.0 0.0 0 90 180 5 0 0 ],["Left Strike Slip" ]);meca! (D, aki= 2.5 , fill=: black)# Thrust (two fault orientations) = mat2ds ([0.0 3.5 0.0 0 45 90 5 0 0 ; 2.0 3.5 0.0 45 45 90 5 0 0 ],["Thrust" , "Thrust" ]);meca! (D, aki= 2.5 , fill=: black)# Normal (two fault orientations) = mat2ds ([0.0 2.0 0.0 0 45 - 90 5 0 0 ; 2.0 2.0 0.0 45 45 - 90 5 0 0 ],["Normal" , "Normal" ]);meca! (D, aki= 2.5 , fill=: black)# Mixed = mat2ds ([3.4 2.0 0.0 10 35 129 5 0 0 ],["Mixed" ]);meca! (D, aki= 2.5 , fill=: black)showfig ()
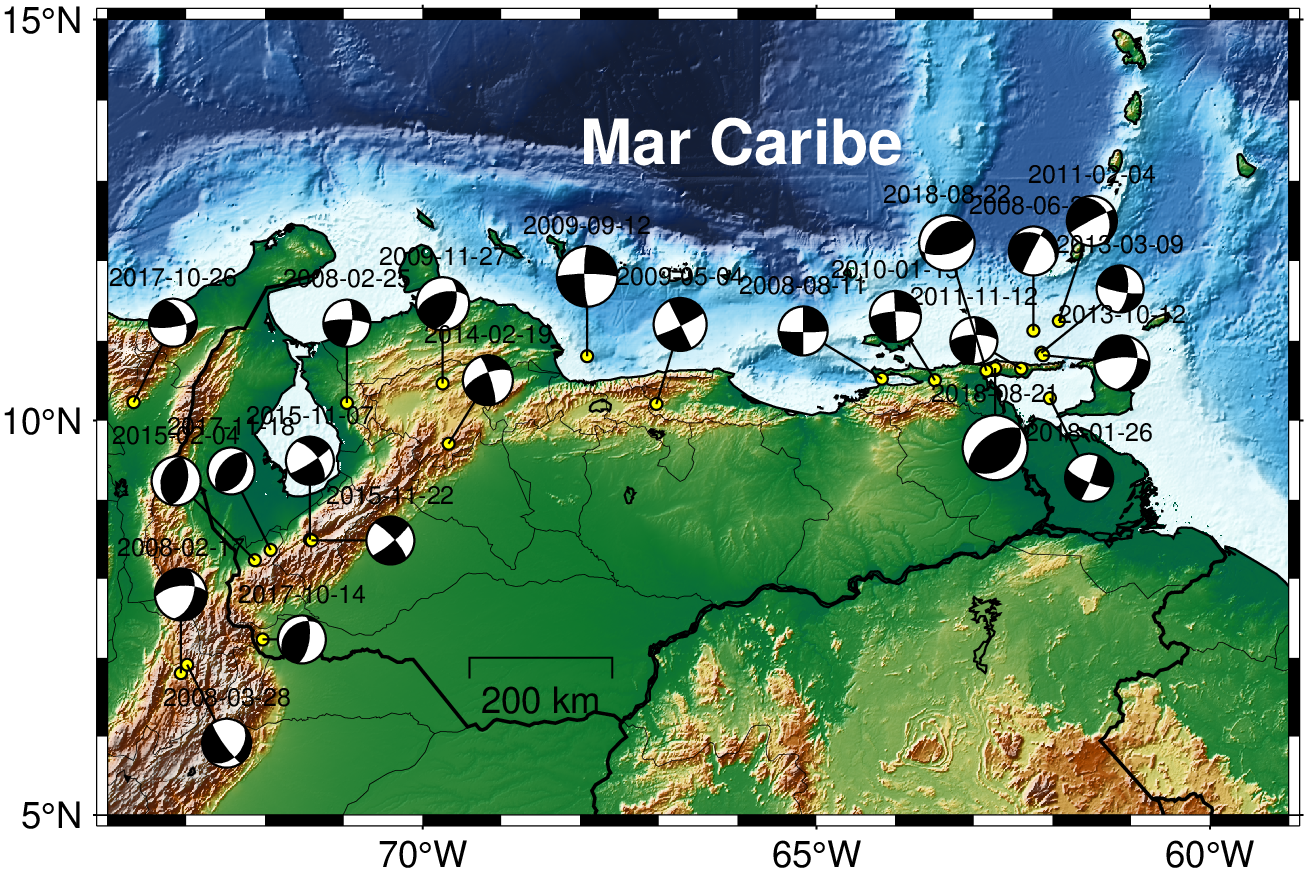
Some Venezuela beach balls
This example was presented by Leonardo Alvarado in the Showcase section of GMT forum under the title Map of focal mechanism with Pygmt . The example was slightly reworked and it now ues the GMT’s automatic grid selection service that by using the grid name @earth_relief
The “mff_bb.txt” file contains a couple of focal mechanisms for the Venezuela region specified in the CMT convention format.
using GMT, PrettyTables   # hide
resetGMT()  # hide
#getpath4docs(file::String) = joinpath("..", "..", "..", "..", "..", file) # hide
io = IOBuffer() # hide
#D = gmtread(getpath4docs("mff_bb.txt"))
D = gmtread(GMT.TESTSDIR * "mff_bb.txt")
PrettyTables.pretty_table(io, D.data; header=D.colnames, backend=Val(:html))    # hide
println("~~~" * String(take!(io)) * "~~~") # hide
using GMT resetGMT () # hide # Background map grdimage ("@earth_relief" , region= (- 74 ,- 59 ,5 ,15 ), proj=: guess, figsize= 10 , shade= true )coast! (shorelines= true , borders= ((type = 1 , pen= 0.8 ),(type = 2 , pen= 0.1 )), map_scale= "-68.5/7.0/7.0/200" )# Epicenters plot! (GMT.TESTSDIR * "mff_bb.txt" , marker=: circ, ms= 0.1 , fill=: yellow, markerline=: black)text! (txt= "Mar Caribe" , x=- 68 , y= 13.5 , font= (15 , "Helvetica-Bold" , : white), justify=: LM)# Focal mechanisms meca! (GMT.TESTSDIR * "mff_bb.txt" , CMT= (scale= 0.4 , font= 6 ), offset= true , fill=: black, show= true )