Step-by-step tutorials for common GMT.jl workflows and advanced techniques.
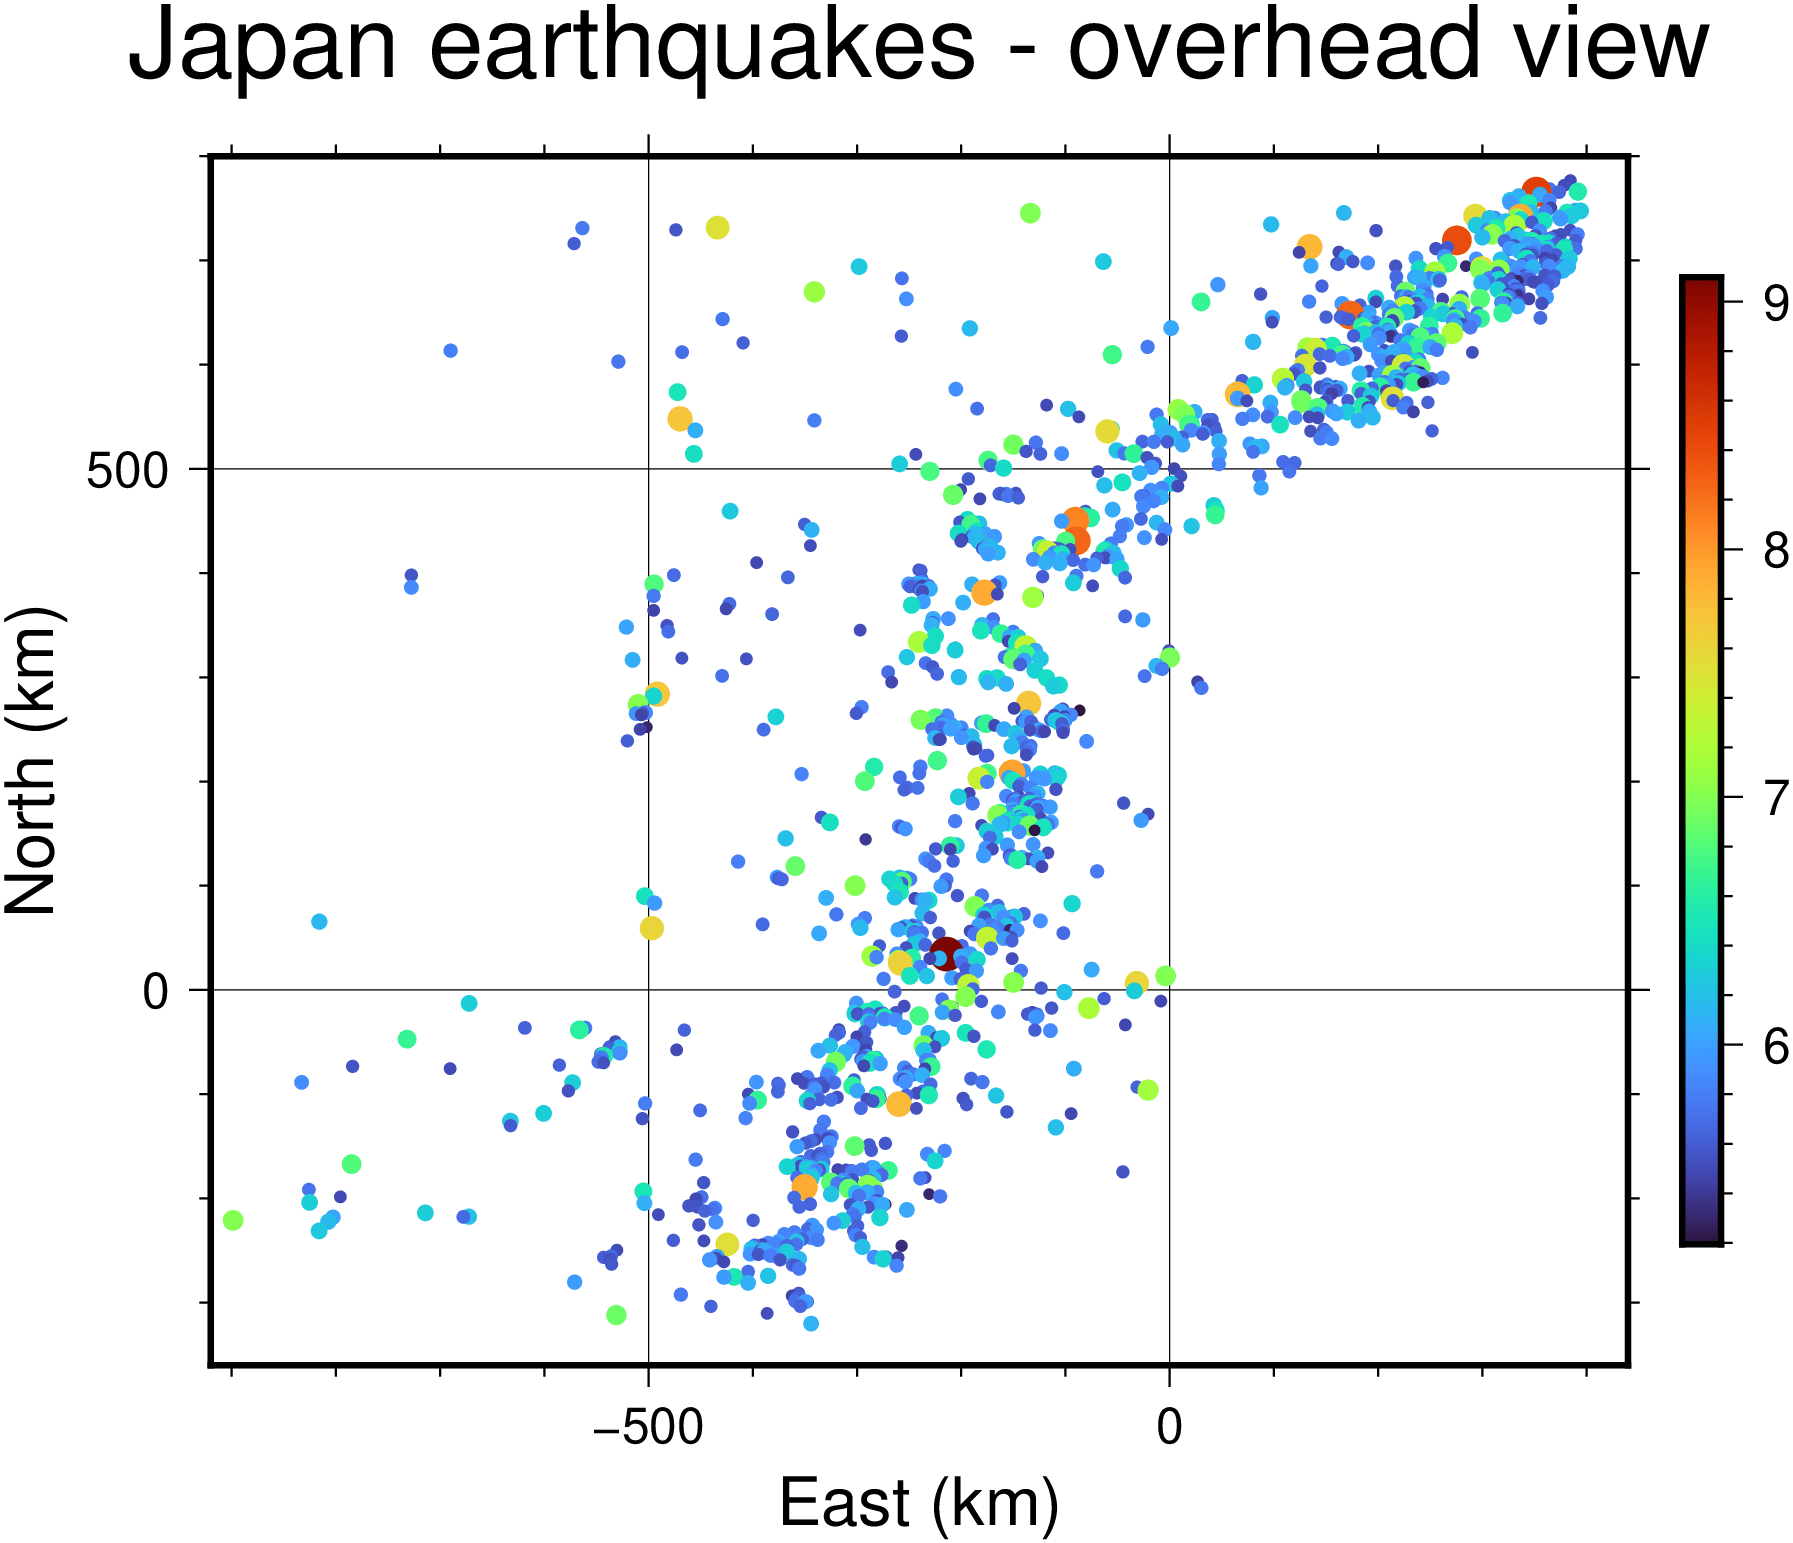
ISC seismicity
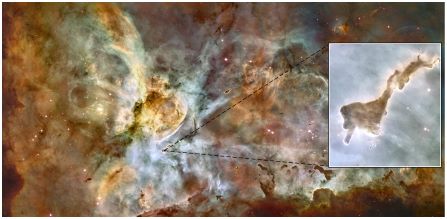
Landsat 8
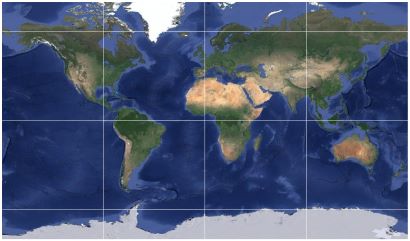
Coastlines
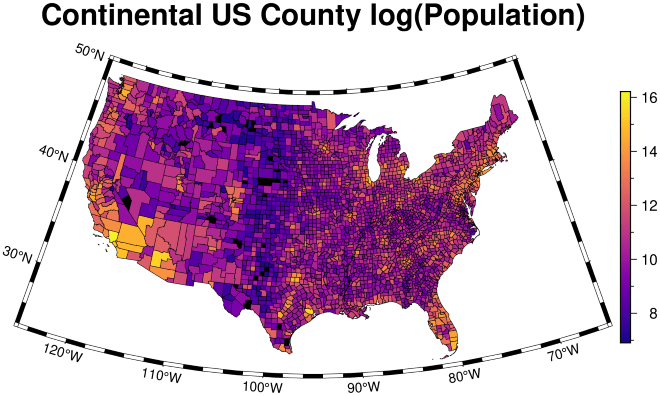
US Choropleths
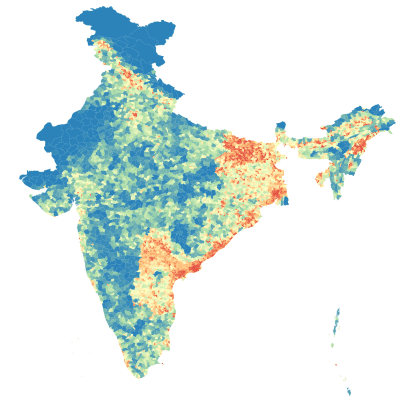
@dlakelan choropleths
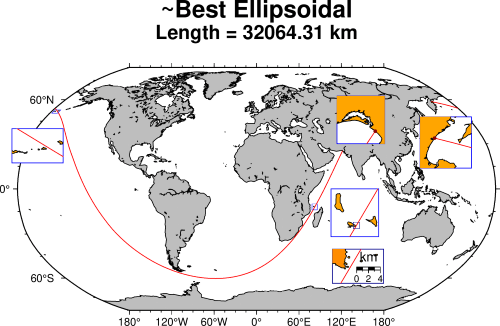
Longest Sail
Geospatial vector
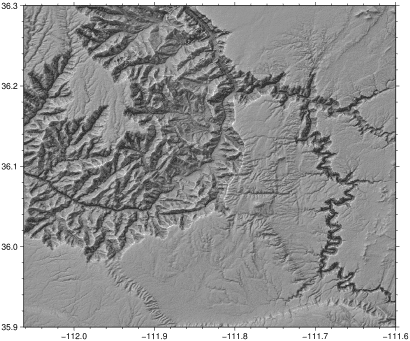
Texture Shading
Mosaics
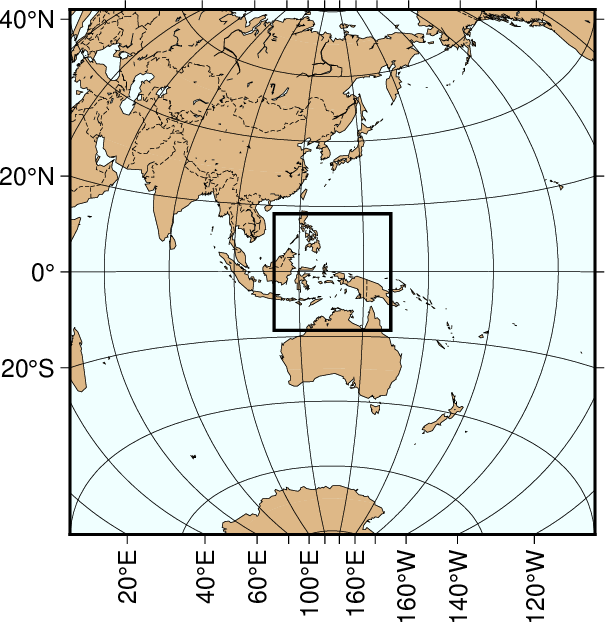
Insets
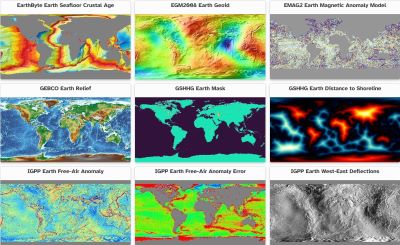
Remote Grids
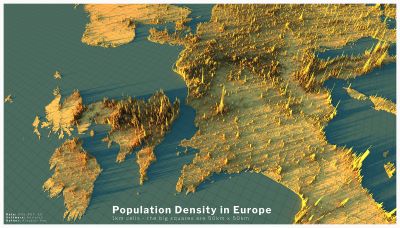
Blender
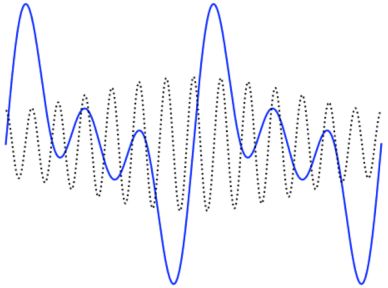
Signal