One is often required to make special maps that shows the distribution of certain features but one would prefer to use a custom symbol instead of the built-in circles, squares, triangles, etc. in the GMT plotting programs [plot] and [plot3]. Here we demonstrate one approach that allows for a fair bit of flexibility in designing ones own symbols.
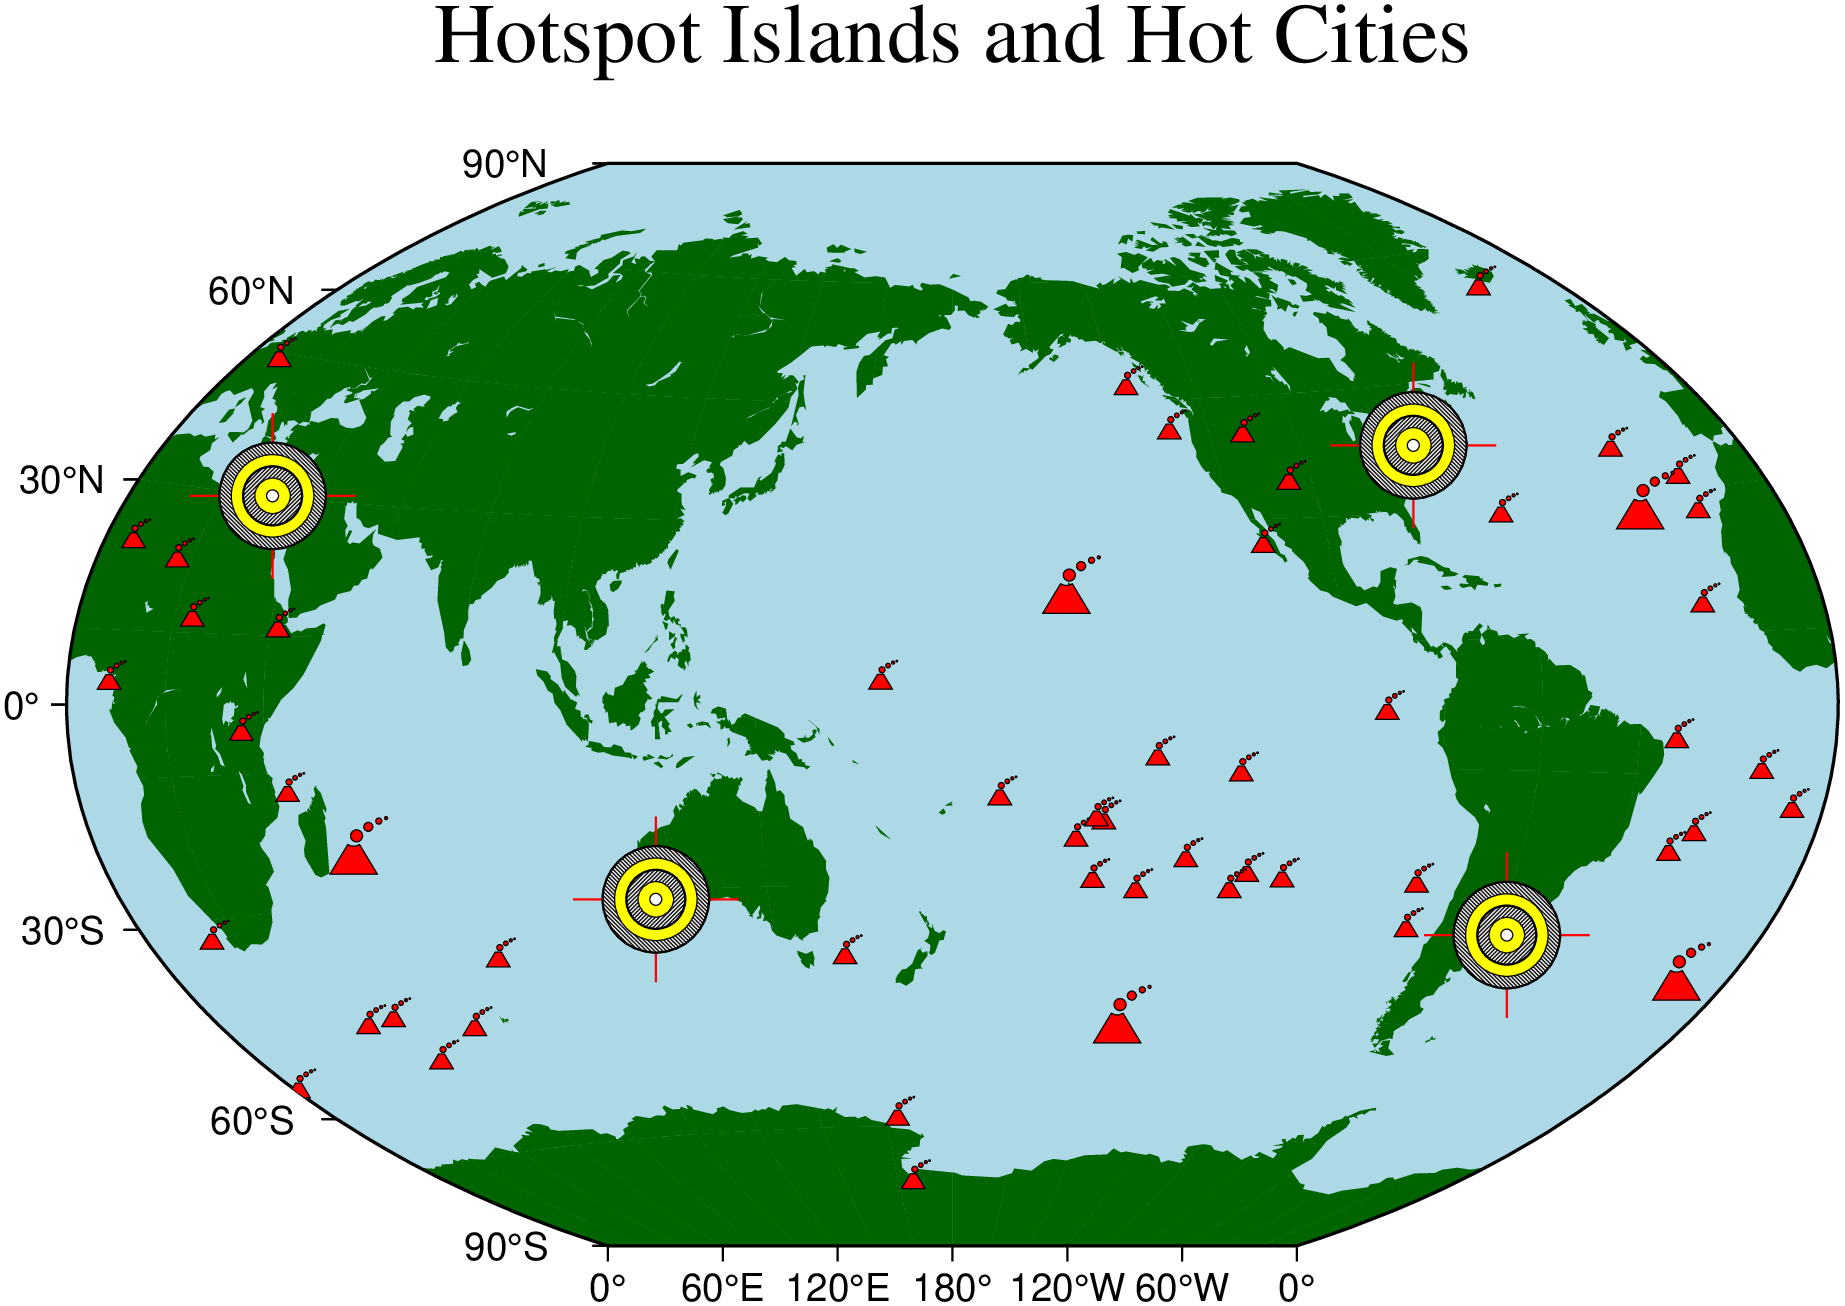
Based on the hotspot locations in the remote file hotspots.txt (with a 3rd column giving the desired symbol sizes in inches) we lay down a world map and overlay red volcano symbols using our custom-built volcano symbol and [plot]. We do something similar with the bulls eye symbols. Without the fill option, however, they get the colors defined in bullseye.def.
usingGMTcoast(region=:global360, xaxis=(annot=60,), yaxis=(annot=30,), title="Hotspot Islands and Hot Cities", land=:darkgreen, water=:lightblue, area=5000, proj=:Win, figsize=15)plot!("@hotspots.txt", symbol="kvolcano", markerline=:thinnest, fill=:red)# Overlay a few bullseyes at NY, Cairo, and Perthcities = [-7440.451.0; 31.1530.031.0; 115.49-31.581.0; -56.16-34.91.0]plot!(cities, symbol="k@bullseye", show=true)