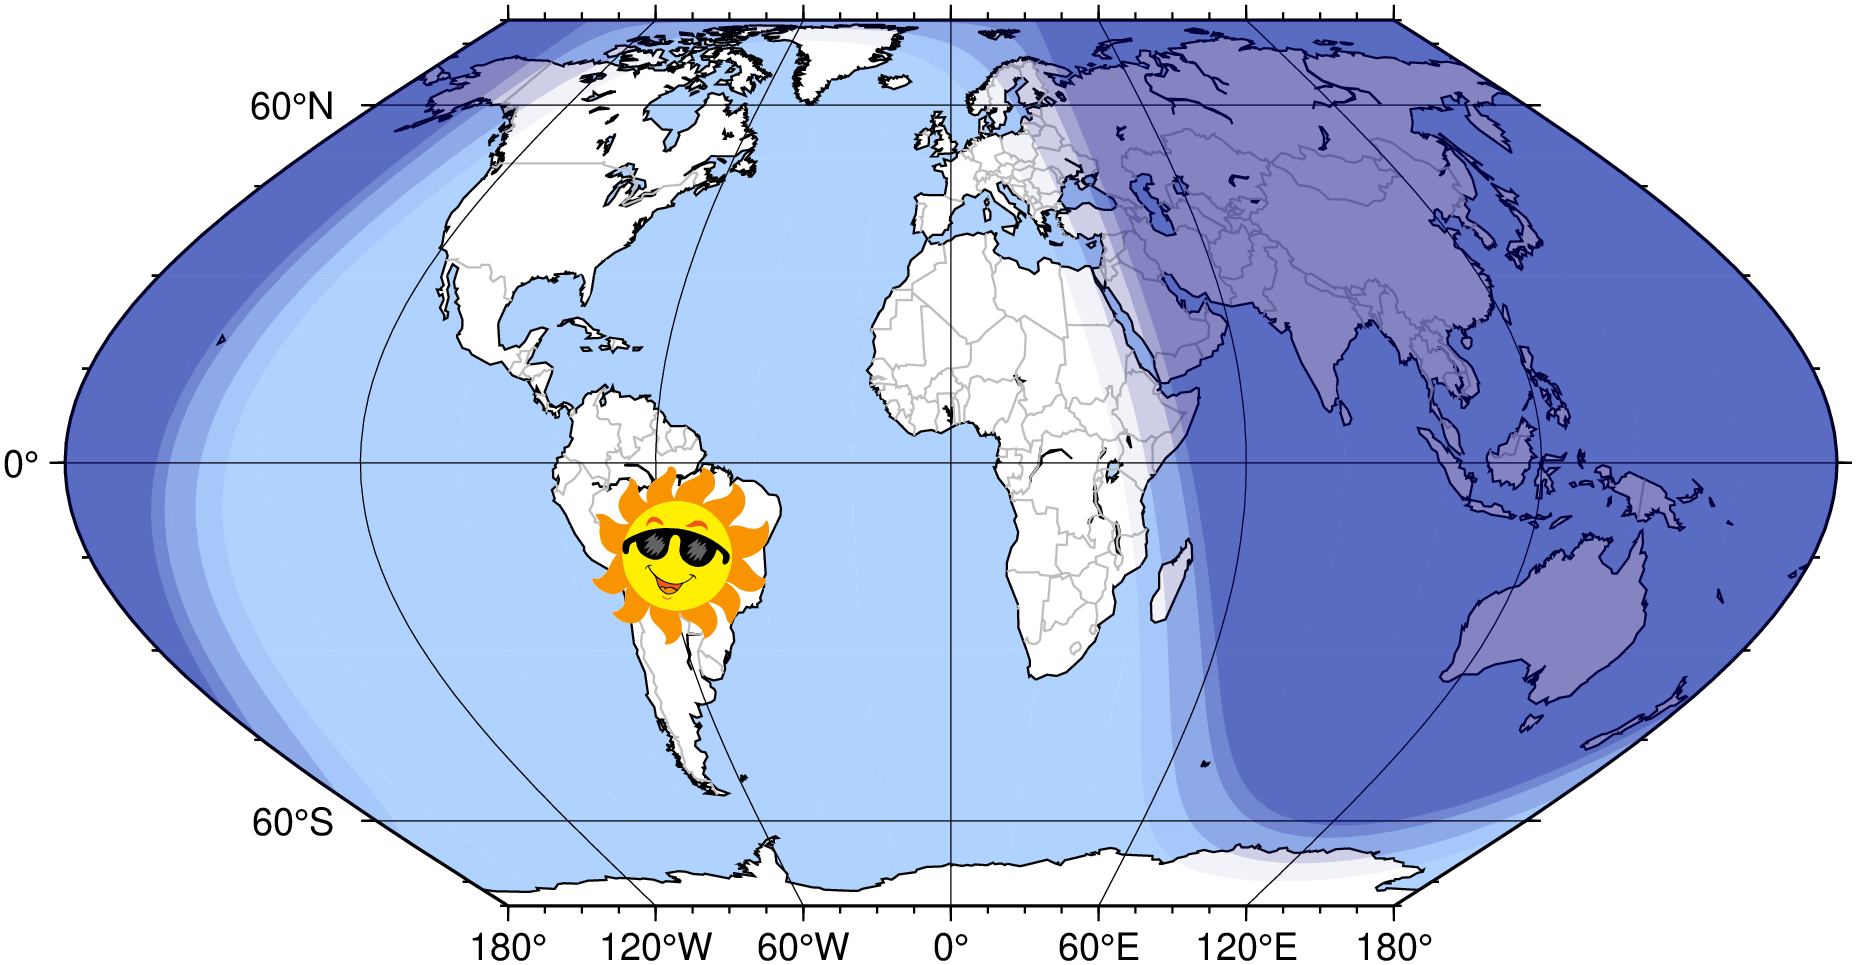
(46) Day-light terminators and other sunlight parameters

In this example show how the module [solar] is used to plot several terminator lines that depend on the location of the sun with respect to Earth. We also show how an EPS illustration can serve as a custom symbol to be plotted with [plot].

using GMT
resetGMT() # hide

coast(limits=:global, frame=(annot=:a,ticks=:a,grid=:a), proj=:EckertVI,
      area=5000, shore=0.5, borders=(type=1, pen=(0.5,:gray)), water=[175 210 255])
solar!(terminators=(term=:d, date="2016-02-09T16:00:00"), fill="navy@95")
solar!(terminators=(term=:c, date="2016-02-09T16:00:00"), fill="navy@85")
solar!(terminators=(term=:n, date="2016-02-09T16:00:00"), fill="navy@80")
solar!(terminators=(term=:a, date="2016-02-09T16:00:00"), fill="navy@80")

t = solar(sun=(date="2016-02-09T16:00:00",), format=true);
plot!(t, symbol="k@sunglasses/1.5", fill=:yellow, show=true)