using GMT
resetGMT() # hide
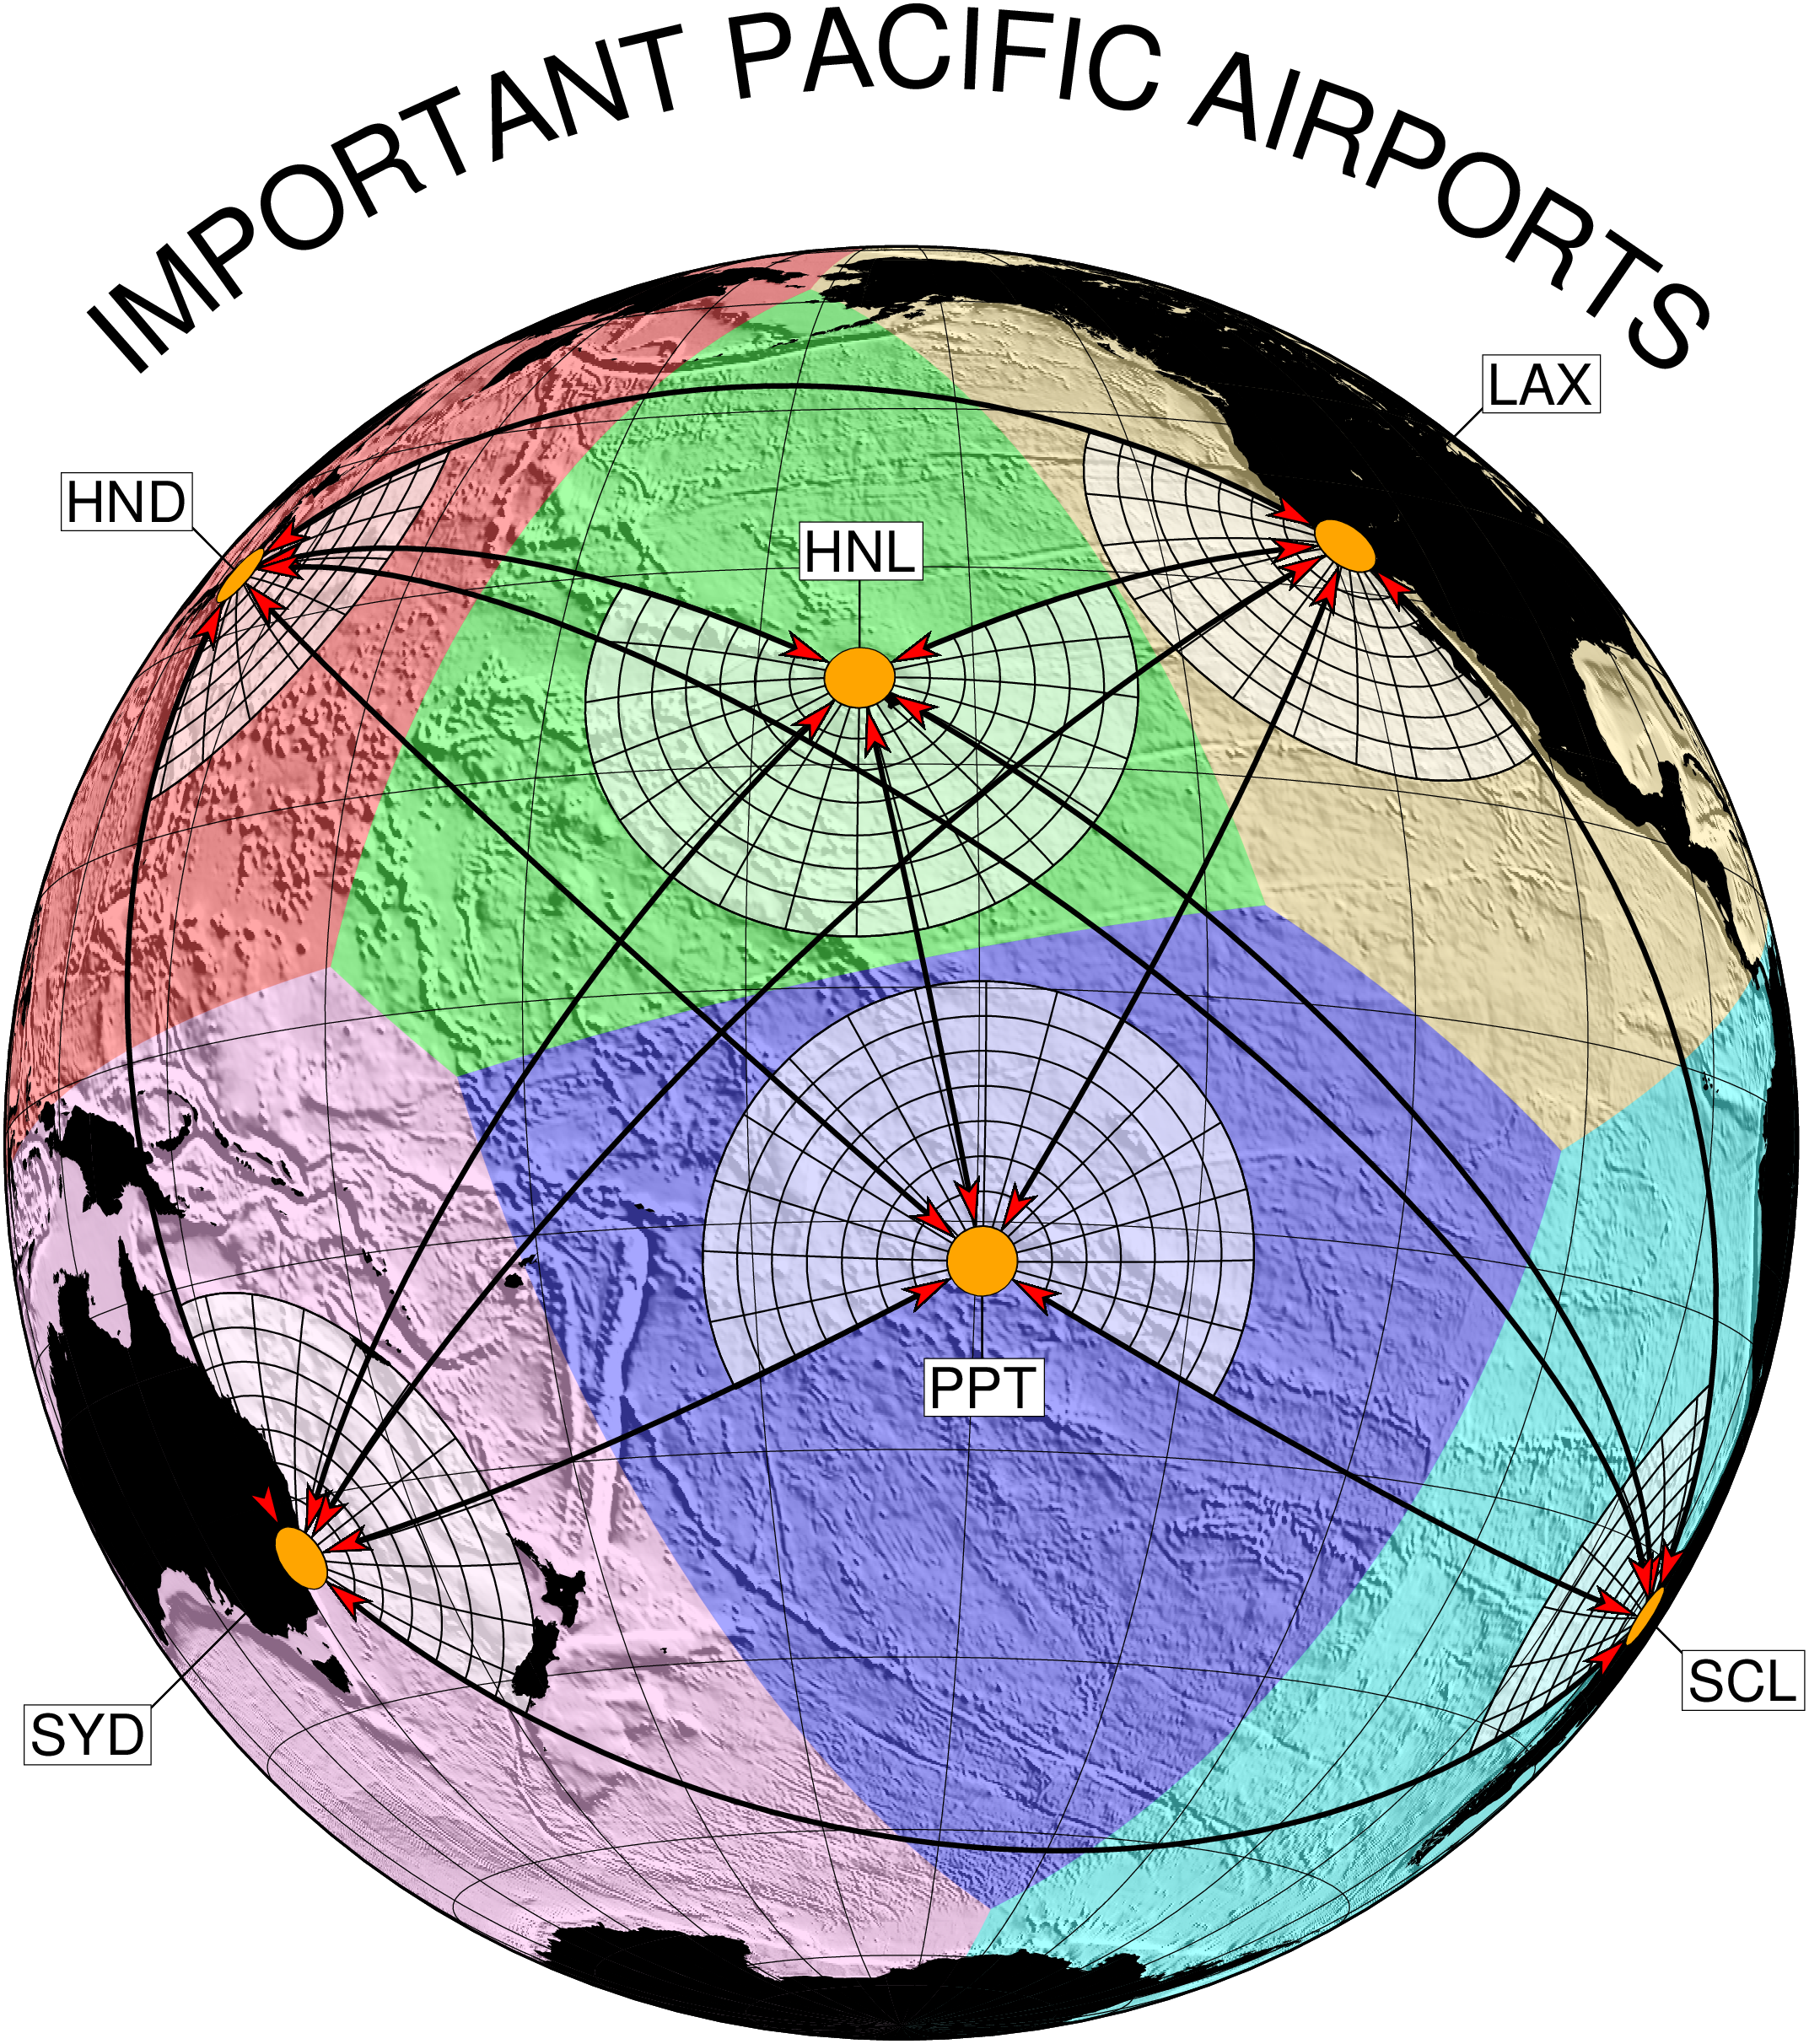
loc = [-157.858 21.307 61 300
-149.558 -17.552 -120 120
139.692 35.689 56 170
-70.669 -33.449 215 322
151.207 -33.867 -10 145
-118.244 34.052 142 306]
par = [["HNL" "BC" "1.5"];
["PPT" "TC" "1.5"];
["HND" "RB" "0.75"];
["SCL" "TL" "0.6"];
["SYD" "TR" "2.2"];
["LAX" "BL" "2.0"]]
makecpt(cmap=:lightgray, range="-12000,12000")
grdimage("@earth_relief_10m", region=:global360, shade=(azim=45, norm="t2"),
proj=(name=:ortho, center=(205,-10)), figsize=18)
near_area = sphtriangulate(loc, voronoi=:v)
t_cpt = makecpt(cmap=:categorical, range=(0,6,1))
plot!(near_area, close=true, cmap=t_cpt, alpha=65)
# Make a 15 degrees by 250 km spiderweb grid around each airport
plot!(loc, marker=(Web=true, size=("2000k","250k"), arc="250k", radial=15), pen=0.5, fill="white@40")
coast!(land=:black, area=500, frame=(annot=:auto, ticks=:auto, grid=:auto))
# Then place custom labels.
for k = 1:size(loc,1)
text!(loc[k:k,1:2], txt=par[k,1], offset=(corners=true, shift=par[k,3], line=(0.5,:white)),
font=16, justify=par[k,2], noclip=true)
text!(loc[k:k,1:2], text=par[k,1], offset=(corners=true, shift=par[k,3], line=0.25), font=16,
justify=par[k,2], noclip=true, fill=:white, pen=0.25)
end
# Plot trimmed lines and overlay airport locations
lines!(loc, connection=:network, pen=(lw=1.5, arrow=(len=0.5,fill=:red,shape=0.5,pen=0.5), offset="250k"))
plot!(loc, symbol="E-500", fill=:orange, ml=0.25)
# Make an arc of radius 12 cm from 45 to 135 degrees around map center and use it to place text
path = [cosd.(45:135) sind.(45:135)] .* 12
# Move up 8 cm so origin is at the map center
lines!(path, region=(-9.0,9.0,0,15), proj=:linear, figscale=1.0, decorated=(quoted=true, n_labels=1,
const_label="IMPORTANT PACIFIC AIRPORTS", font=32, curved=true),
pen=(:faint,:white), noclip=true, yshift=8, show=true)