(34) Using country polygons for plotting and shading
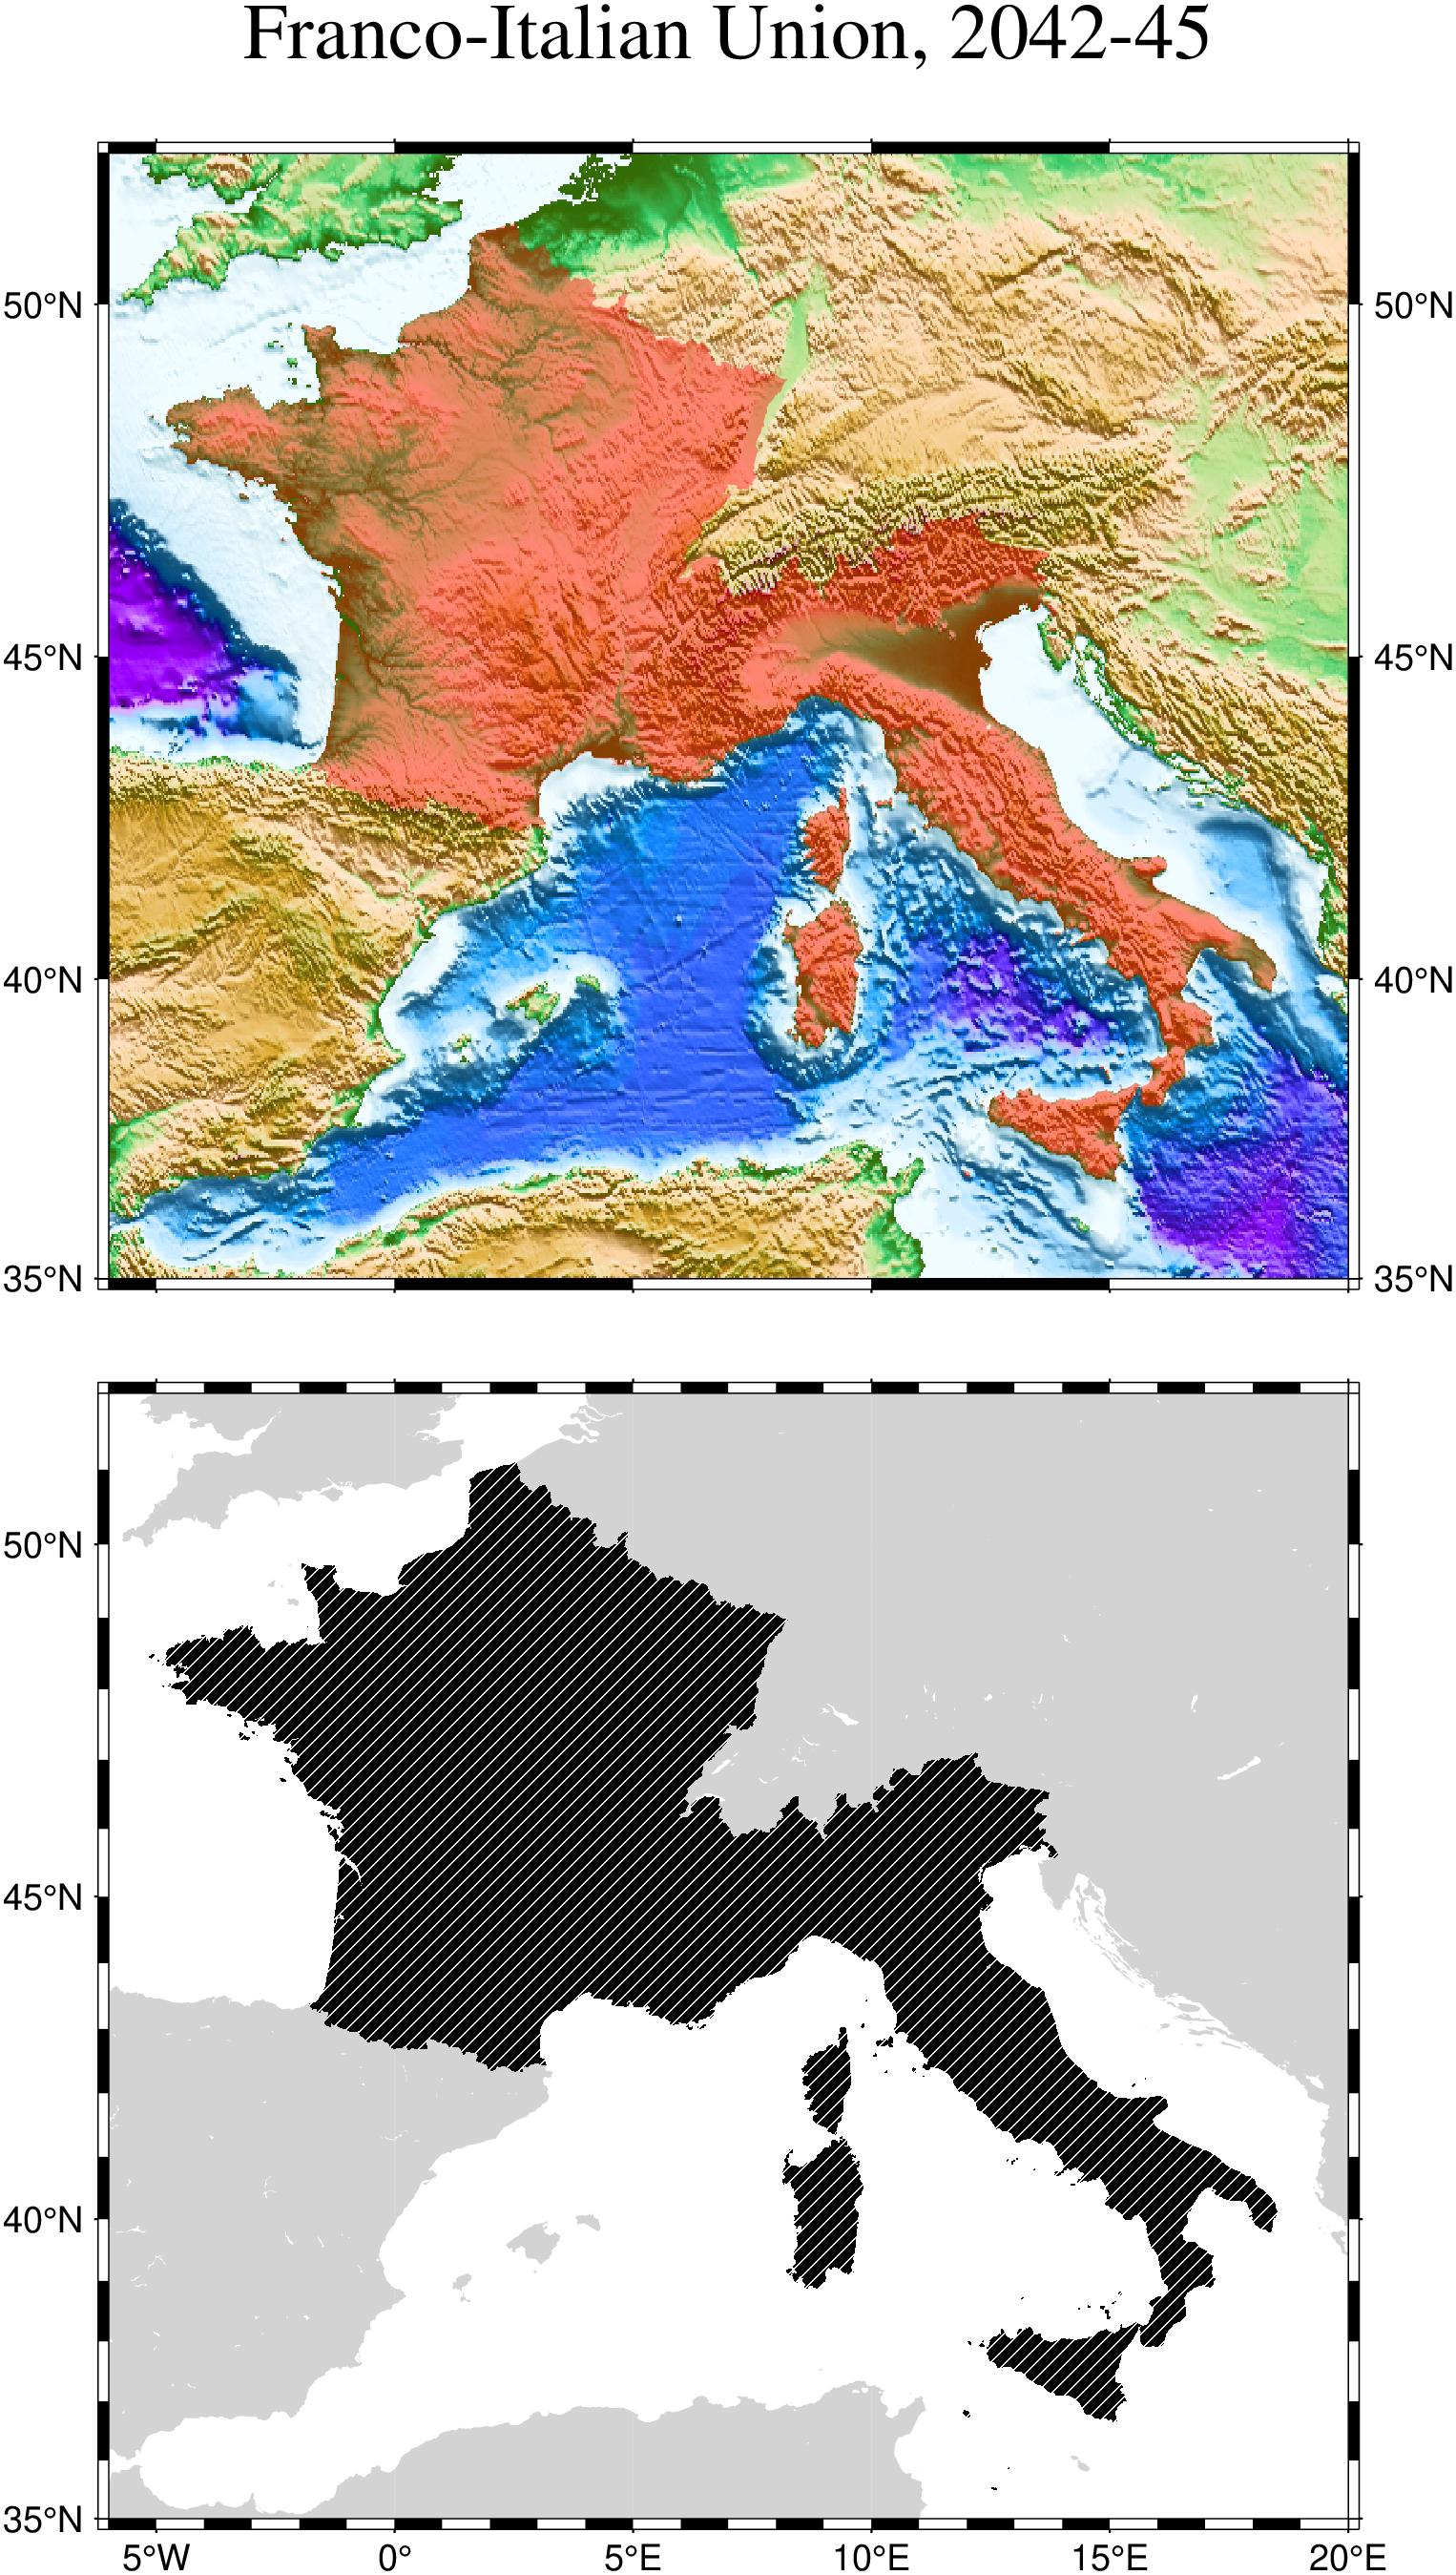
The script produces the plot in Figure. Here we demonstrate how [coast] can be used to extract and plot country polygons from the optional DCW dataset. We show two panels; one in which we do a basic basemap and another where we lay down a color topography image and then place a transparent layer identifying the future Franco-Italian Union, whose untimely breakup in 2045 the historians will continue to debate for some time.
usingGMTresetGMT() # hidepscoast(region=(-6,20,35,52), DCW=(country="FR,IT", fill=(inv_pattern=8, dpi=300)), land=:lightgray, proj=:Mercator, figsize=11, xshift=5)# Extract a subset of ETOPO2m for this part of Europemakecpt(cmap=:globe, range=(-5000,5000,50), continuous=true)grdimage!("@FR+IT.nc", shade=(azim=15, norm="e0.75"), frame=(axes=:WsnE, annot=:auto, title="Franco-Italian Union, 2042-45"), yshift=11)coast!(DCW=(country="FR,IT", fill="red@60"), show=true)