Contour maps

We want to create two contour maps of the low order geoid using the Hammer equal area projection. Our gridded data file is called osu91a1f_16.nc and contains a global 1 by 1 gridded geoid (we will see how to make gridded files later). We would like to show one map centered on Greenwich and one centered on the dateline. Positive contours should be drawn with a solid pen and negative contours with a dashed pen. Annotations should occur for every 50 m contour level, and both contour maps should show the continents in light brown in the background. This is how it is done:

using GMT

subplot(grid=(2,1), region=:global, autolabel=true, margins=0.5,
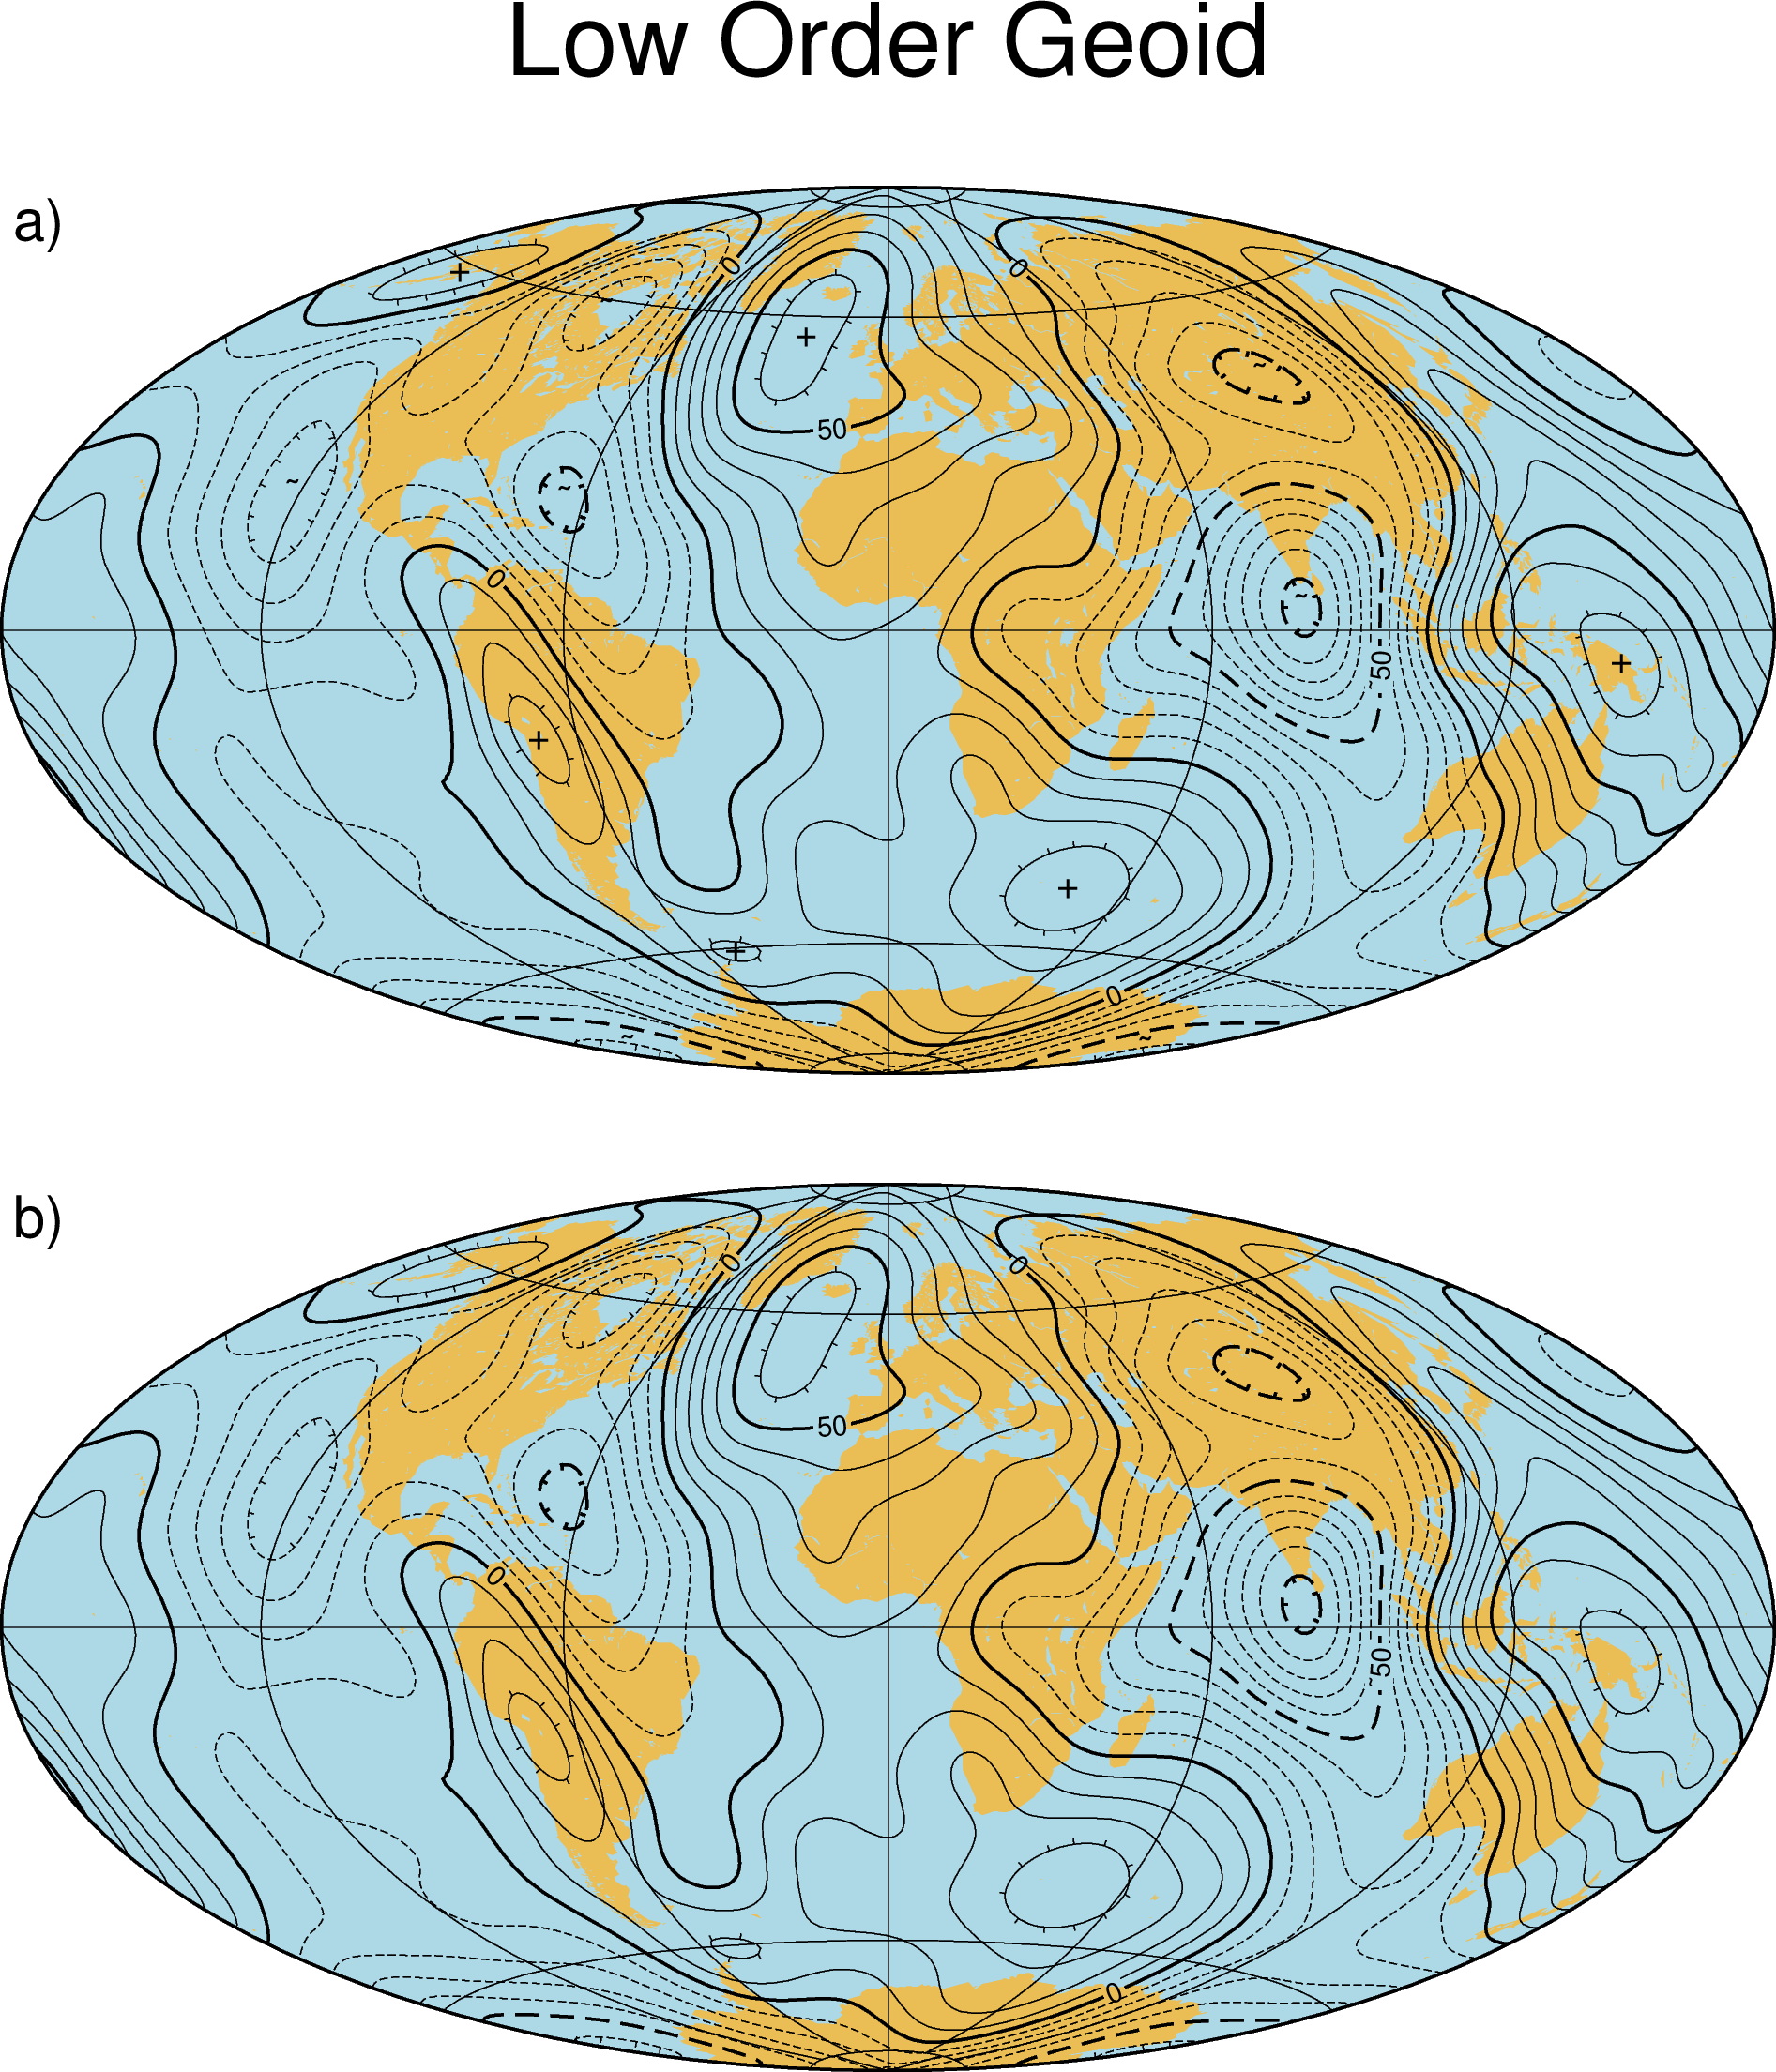
        title="Low Order Geoid", panel_size=(16,0), frame="lrtb", proj=:Hammer, figsize=16)
	gmtset(MAP_GRID_CROSS_SIZE_PRIMARY=0, FONT_ANNOT_PRIMARY=10, PS_CHAR_ENCODING="Standard+")
	coast(frame="afg", land=:lightbrown, water=:lightblue)
	grdcontour("@osu91a1f_16.nc", cont=10, annot=(int=50,labels=(font=7,)), labels=(dist=10,),
                range=(-1000,-1), pen=((contour=1,pen="thinnest,-"), (annot=1, pen="thin,-")),
                ticks=(gap=(0.25,0.05),labels=""))
	grdcontour("@osu91a1f_16.nc", cont=10, annot=(int=50,labels=(font=7,)), labels=(dist=10,),
                range=(-1,100), ticks=(gap=(0.25,0.05),labels=""))

	coast(frame="afg", land=:lightbrown, water=:lightblue, panel=(2,1))
	grdcontour("@osu91a1f_16.nc", cont=10, annot=(int=50,labels=(font=7,)), labels=(dist=10,),
                range=(-1000,-1), pen=((contour=1,pen="thinnest,-"), (annot=1, pen="thin,-")),
                ticks=(gap=(0.25,0.05),))
	grdcontour("@osu91a1f_16.nc", cont=10, annot=(int=50,labels=(font=7,)), labels=(dist=10,),
                range=(-1,1000), ticks=(gap=(0.25,0.05),))
subplot("show")

// Image matching '/assets/gallery/ex01/code/example_12211371695113556997.png' not found. //

The first command sets up a 2 by 1 subplot layout. The subplot determines the size of what map can fit so we use? when specifying map widths in the commands below. This initial setup is followed by two sequences of coast grdcontour, grdcontour. They differ in that the first is centered on the dateline, while the second on Greenwich. We use the range option in grdcontour to select negative contours only and plot those with a dashed pen, then positive contours only and draw with a solid pen [Default]. The ticks option causes tick marks pointing in the downhill direction to be drawn on the innermost, closed contours. For the upper panel we also added - and + to the local lows and highs. The labeling of the two plots with a) and b) is automatically done by subplot.