using GMT
coast(region=:global, shore=:faint, land=:wheat, ocean=:azure2, area=5000,
view=(200,40), proj=(name=:PlateCarree, center=(0,37.5)))
D = gmtread("@languages_10.txt")
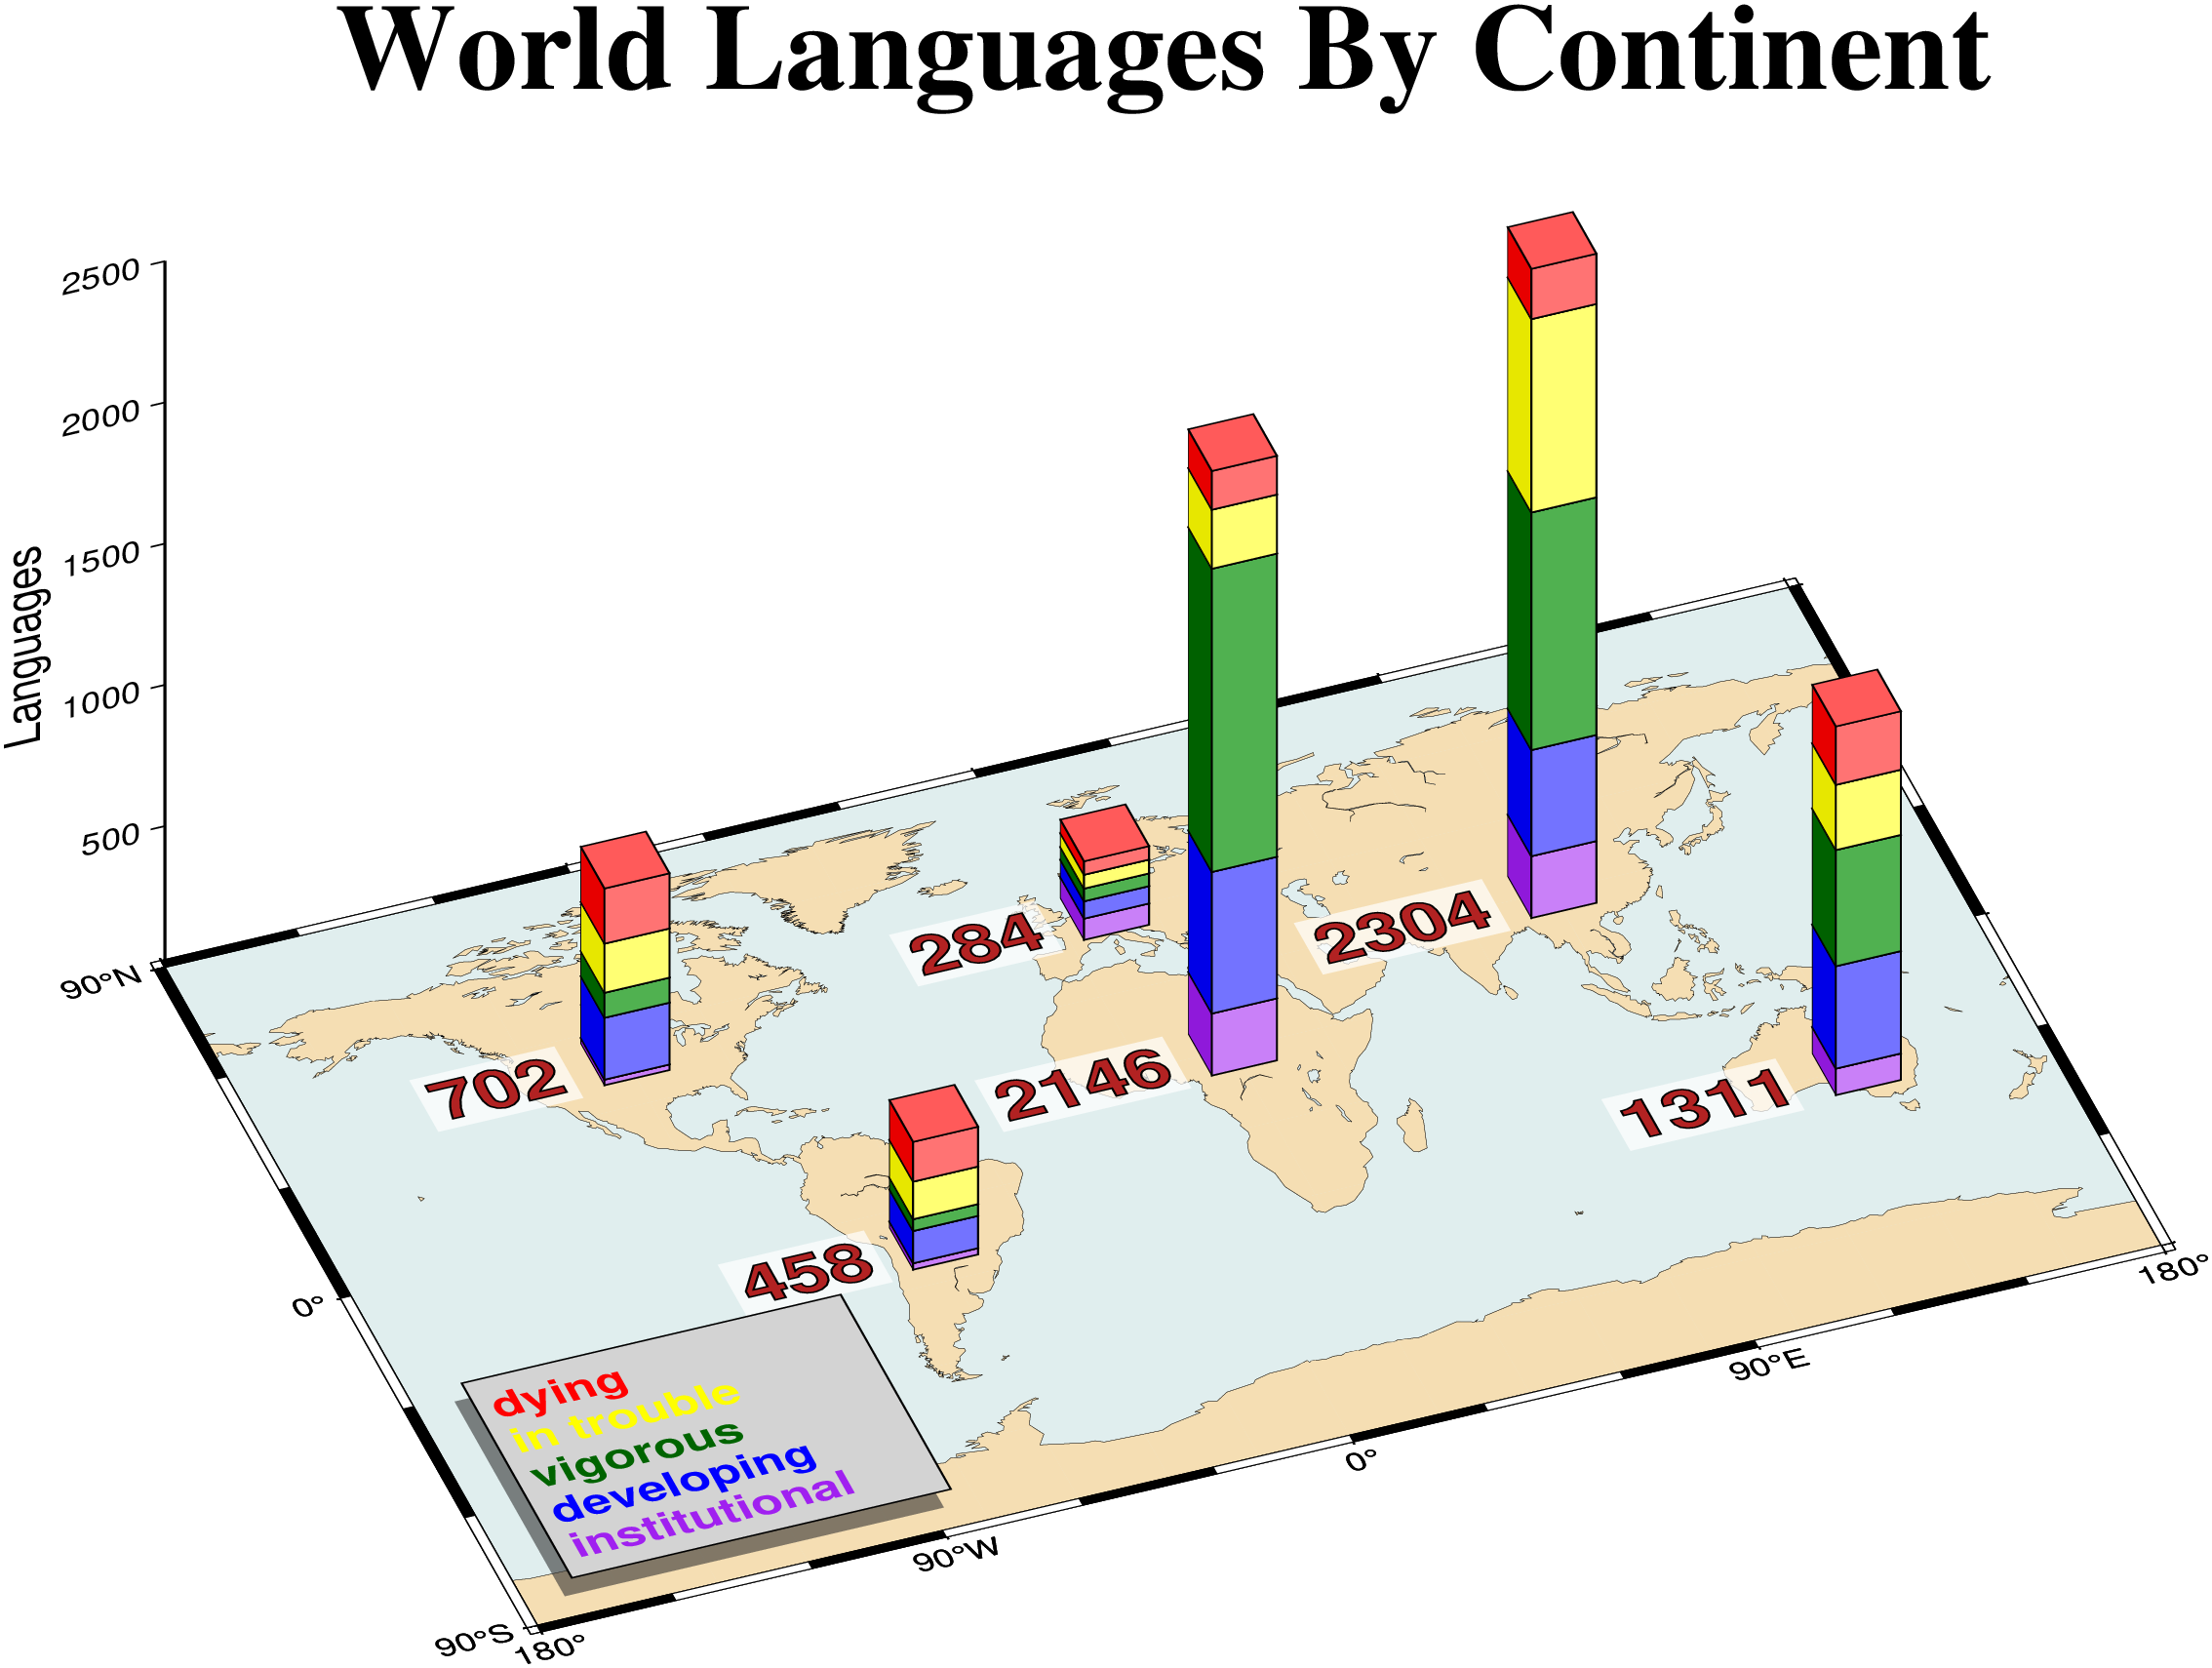
text!(vec(string.(Int.(sum(D[:, 3:end], dims=2)))), x=D[:,1], y=D[:,2], # Sum by continents
font=(20,"Helvetica-Bold","firebrick=thinner"), justify=:RM, fill="white@30", offset=(-0.6,0))
cpt = makecpt(color=(:purple, :blue, :darkgreen, :yellow, :red), range="0,1,2,3,4,5")
bar3!(D, region=(-180,180,-90,90,0,2500), color=cpt, bar=(width=0.6, Nbands=5),
frame=(axes=:WSneZ, annot=:auto, ticks=:auto, title="World Languages By Continent"),
zaxis=(annot=500, label=:Languages), fill=:purple, lw=:thinner, zsize=8,
par=(FONT_TITLE="30p,Times-Bold", MAP_TITLE_OFFSET=-1.8, FORMAT_GEO_MAP=:dddF), view=(200,40))
legend!("@legend_10.txt", JZ=true, pos=(anchor=:LB, width=3.5, justify=:LB, offset=0.5),
par=(:FONT,"Helvetica-Bold"),
box=(fill=:lightgrey, pen=:thinner, shaded="-4p/-6p/grey20@40"), show=true)