using GMT
ablines([1, 2, 3], [1, 1.5, 2], linecolor=[:red, :orange, :pink], linestyle=:dash, linewidth=2, show=true)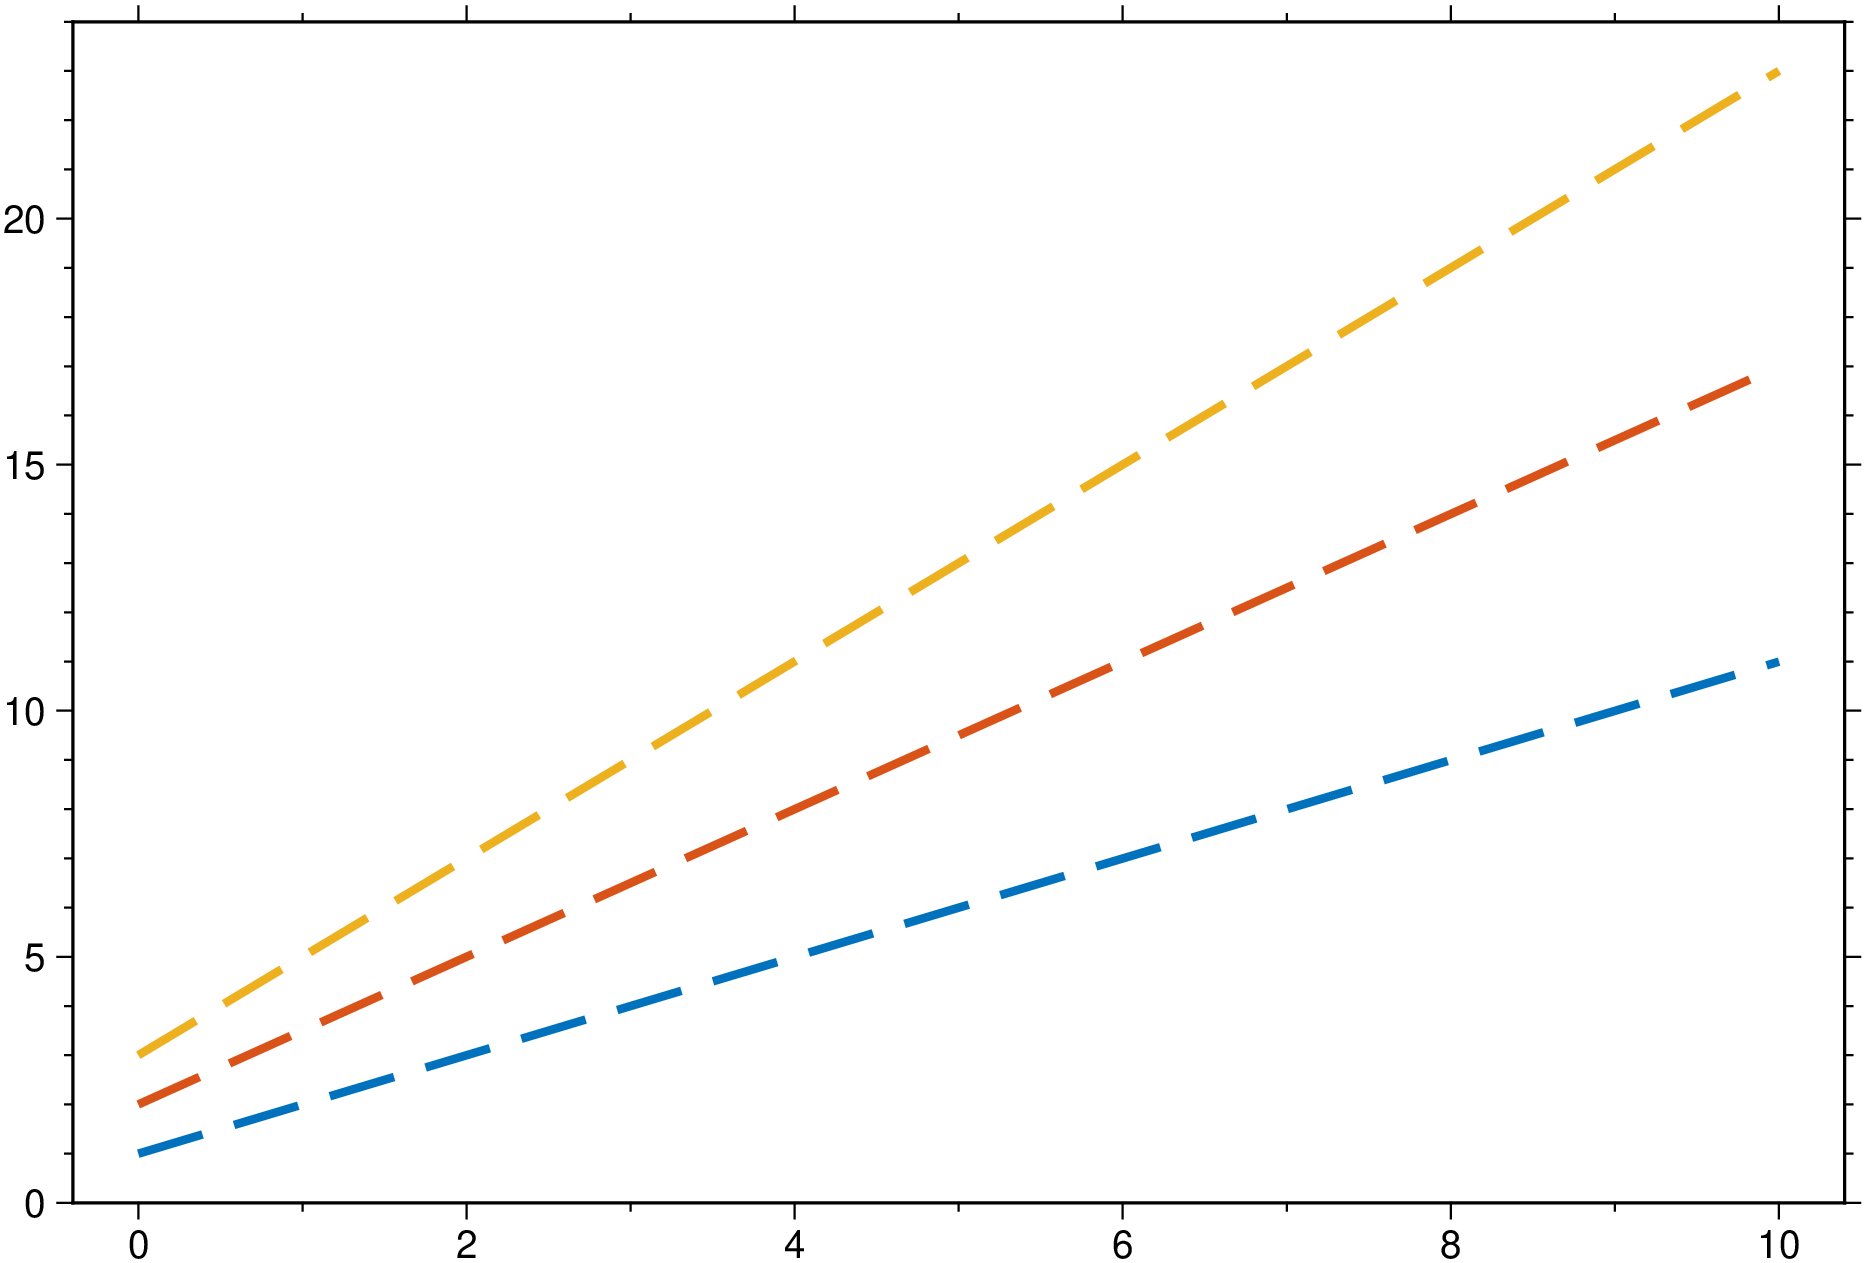
ablines(a, b; kw...)
or
ablines([a1, a2, ..., an], [b1, b2, ..., bn]; kw...)
or
ablines(D::GMTdataset; kw...)
Creates a straight line(s) defined by Y = a + b * X. Input can be a pair of a,b parameters or a vector of them, case in which multiple straight lines are plotted. Plot limits are passed through the usual region option in kw or, if missing, we plot lines in the x = [0 10] interval. The third form, when input is a GMTdataset.html) type implies that this was computed with the linearfitxy function, which embeds the linear fit parameters in the data type attributes. All plot options are available via the kw arguments.
B or axes or frame
Set map boundary frame and axes attributes. Default is to draw and annotate left, bottom and vertical axes and just draw left and top axes. More at frame
J or proj or projection : – proj=
Select map projection. More at proj
R or region or limits : – limits=(xmin, xmax, ymin, ymax) | limits=(BB=(xmin, xmax, ymin, ymax),) | limits=(LLUR=(xmin, xmax, ymin, ymax),units=“unit”) | …more
Specify the region of interest. More at limits. For perspective view view, optionally add zmin,zmax. This option may be used to indicate the range used for the 3-D axes. You may ask for a larger w/e/s/n region to have more room between the image and the axes.
W or pen=pen
Set pen attributes for the arrow stem [Defaults: width = default, color = black, style = solid]. See Pen attributes and Vector attributes for arrow line terminations.
U or time_stamp : – time_stamp=true | time_stamp=(just=“code”, pos=(dx,dy), label=“label”, com=true)
Draw GMT time stamp logo on plot. More at timestamp
V or verbose : – verbose=true | verbose=level
Select verbosity level. More at verbose
X or xshift or x_offset : xshift=true | xshift=x-shift | xshift=(shift=x-shift, mov=“a|c|f|r”)
Shift plot origin. More at xshift
Y or yshift or y_offset : yshift=true | yshift=y-shift | yshift=(shift=y-shift, mov=“a|c|f|r”)
Shift plot origin. More at yshift
figname or savefig or name : – figname=name.png
Save the figure with the figname=name.ext where ext chooses the figure image format.
using GMT

ablines([1, 2, 3], [1, 1.5, 2], linecolor=[:red, :orange, :pink], linestyle=:dash, linewidth=2, show=true)
using GMT

D = linearfitxy([0.0, 0.9, 1.8, 2.6, 3.3, 4.4, 5.2, 6.1, 6.5, 7.4], [5.9, 5.4, 4.4, 4.6, 3.5, 3.7, 2.8, 2.8, 2.4, 1.5],
                 sx = 1 ./ sqrt.([1000., 1000, 500, 800, 200, 80,  60, 20, 1.8, 1]), sy=1 ./
                 sqrt.([1., 1.8, 4, 8, 20, 20, 70, 70, 100, 500]));
plot(D, linefit=true, band_ab=true, band_CI=true, ellipses=true, show=true)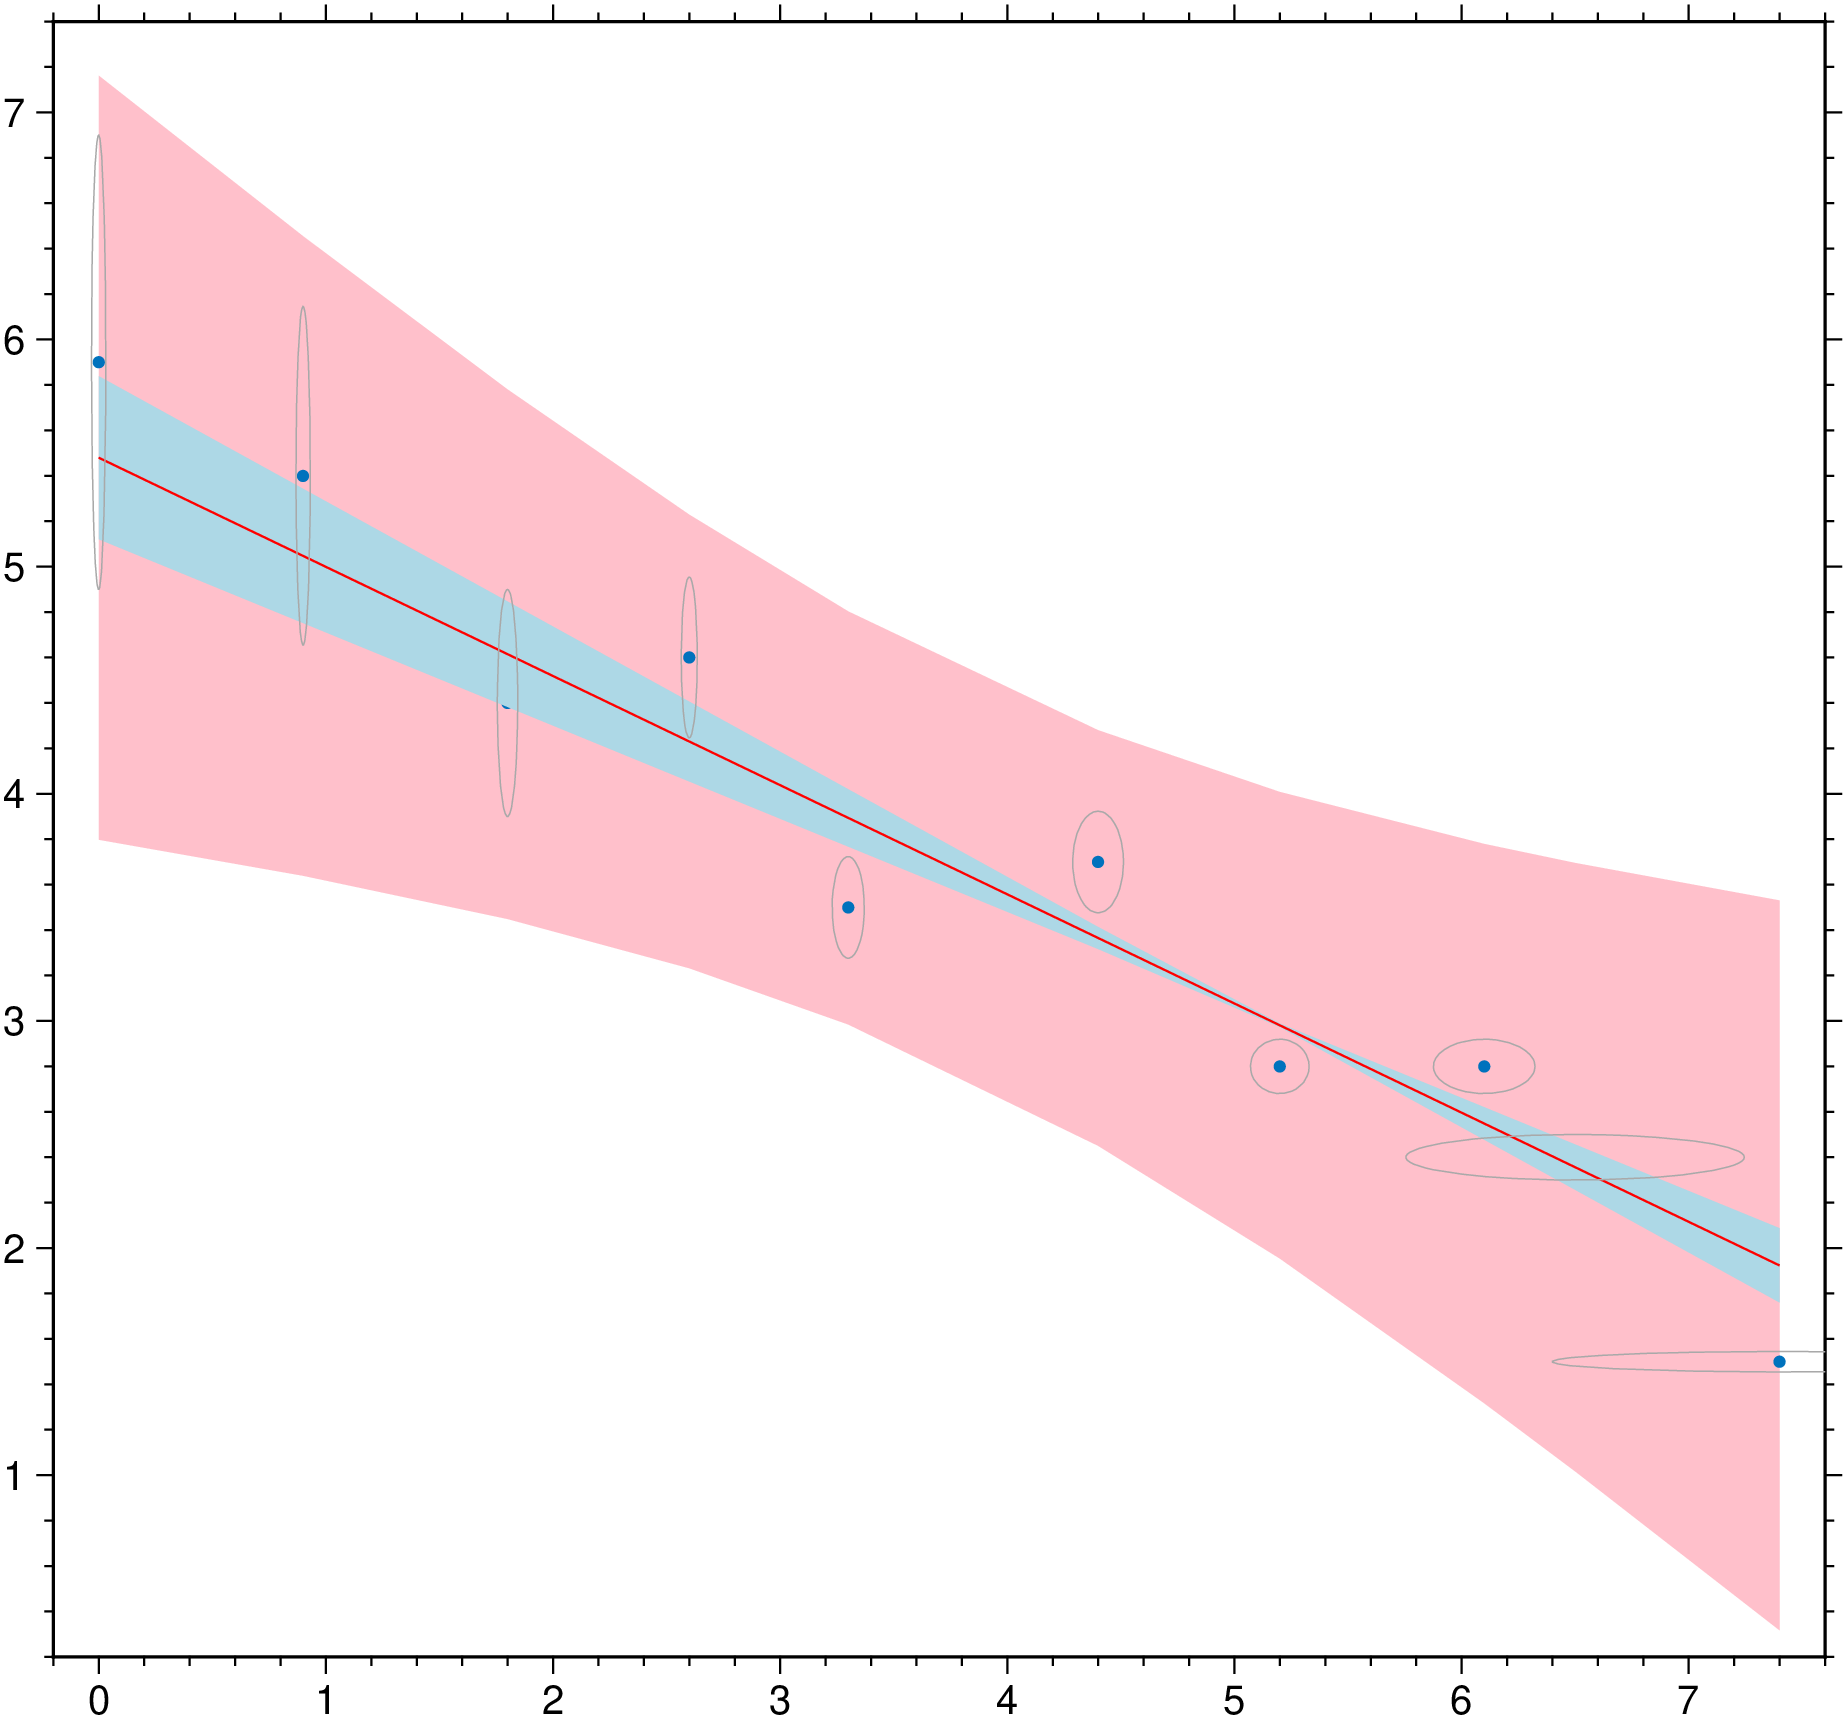
This function has multiple methods:
ablines(a::Vector{<:Real}, b::Vector{<:Real}; first, kw...) - linefit.jl:419ablines(a, b; first, kw...) - linefit.jl:418ablines(D::GMTdataset; first, kw...) - linefit.jl:410