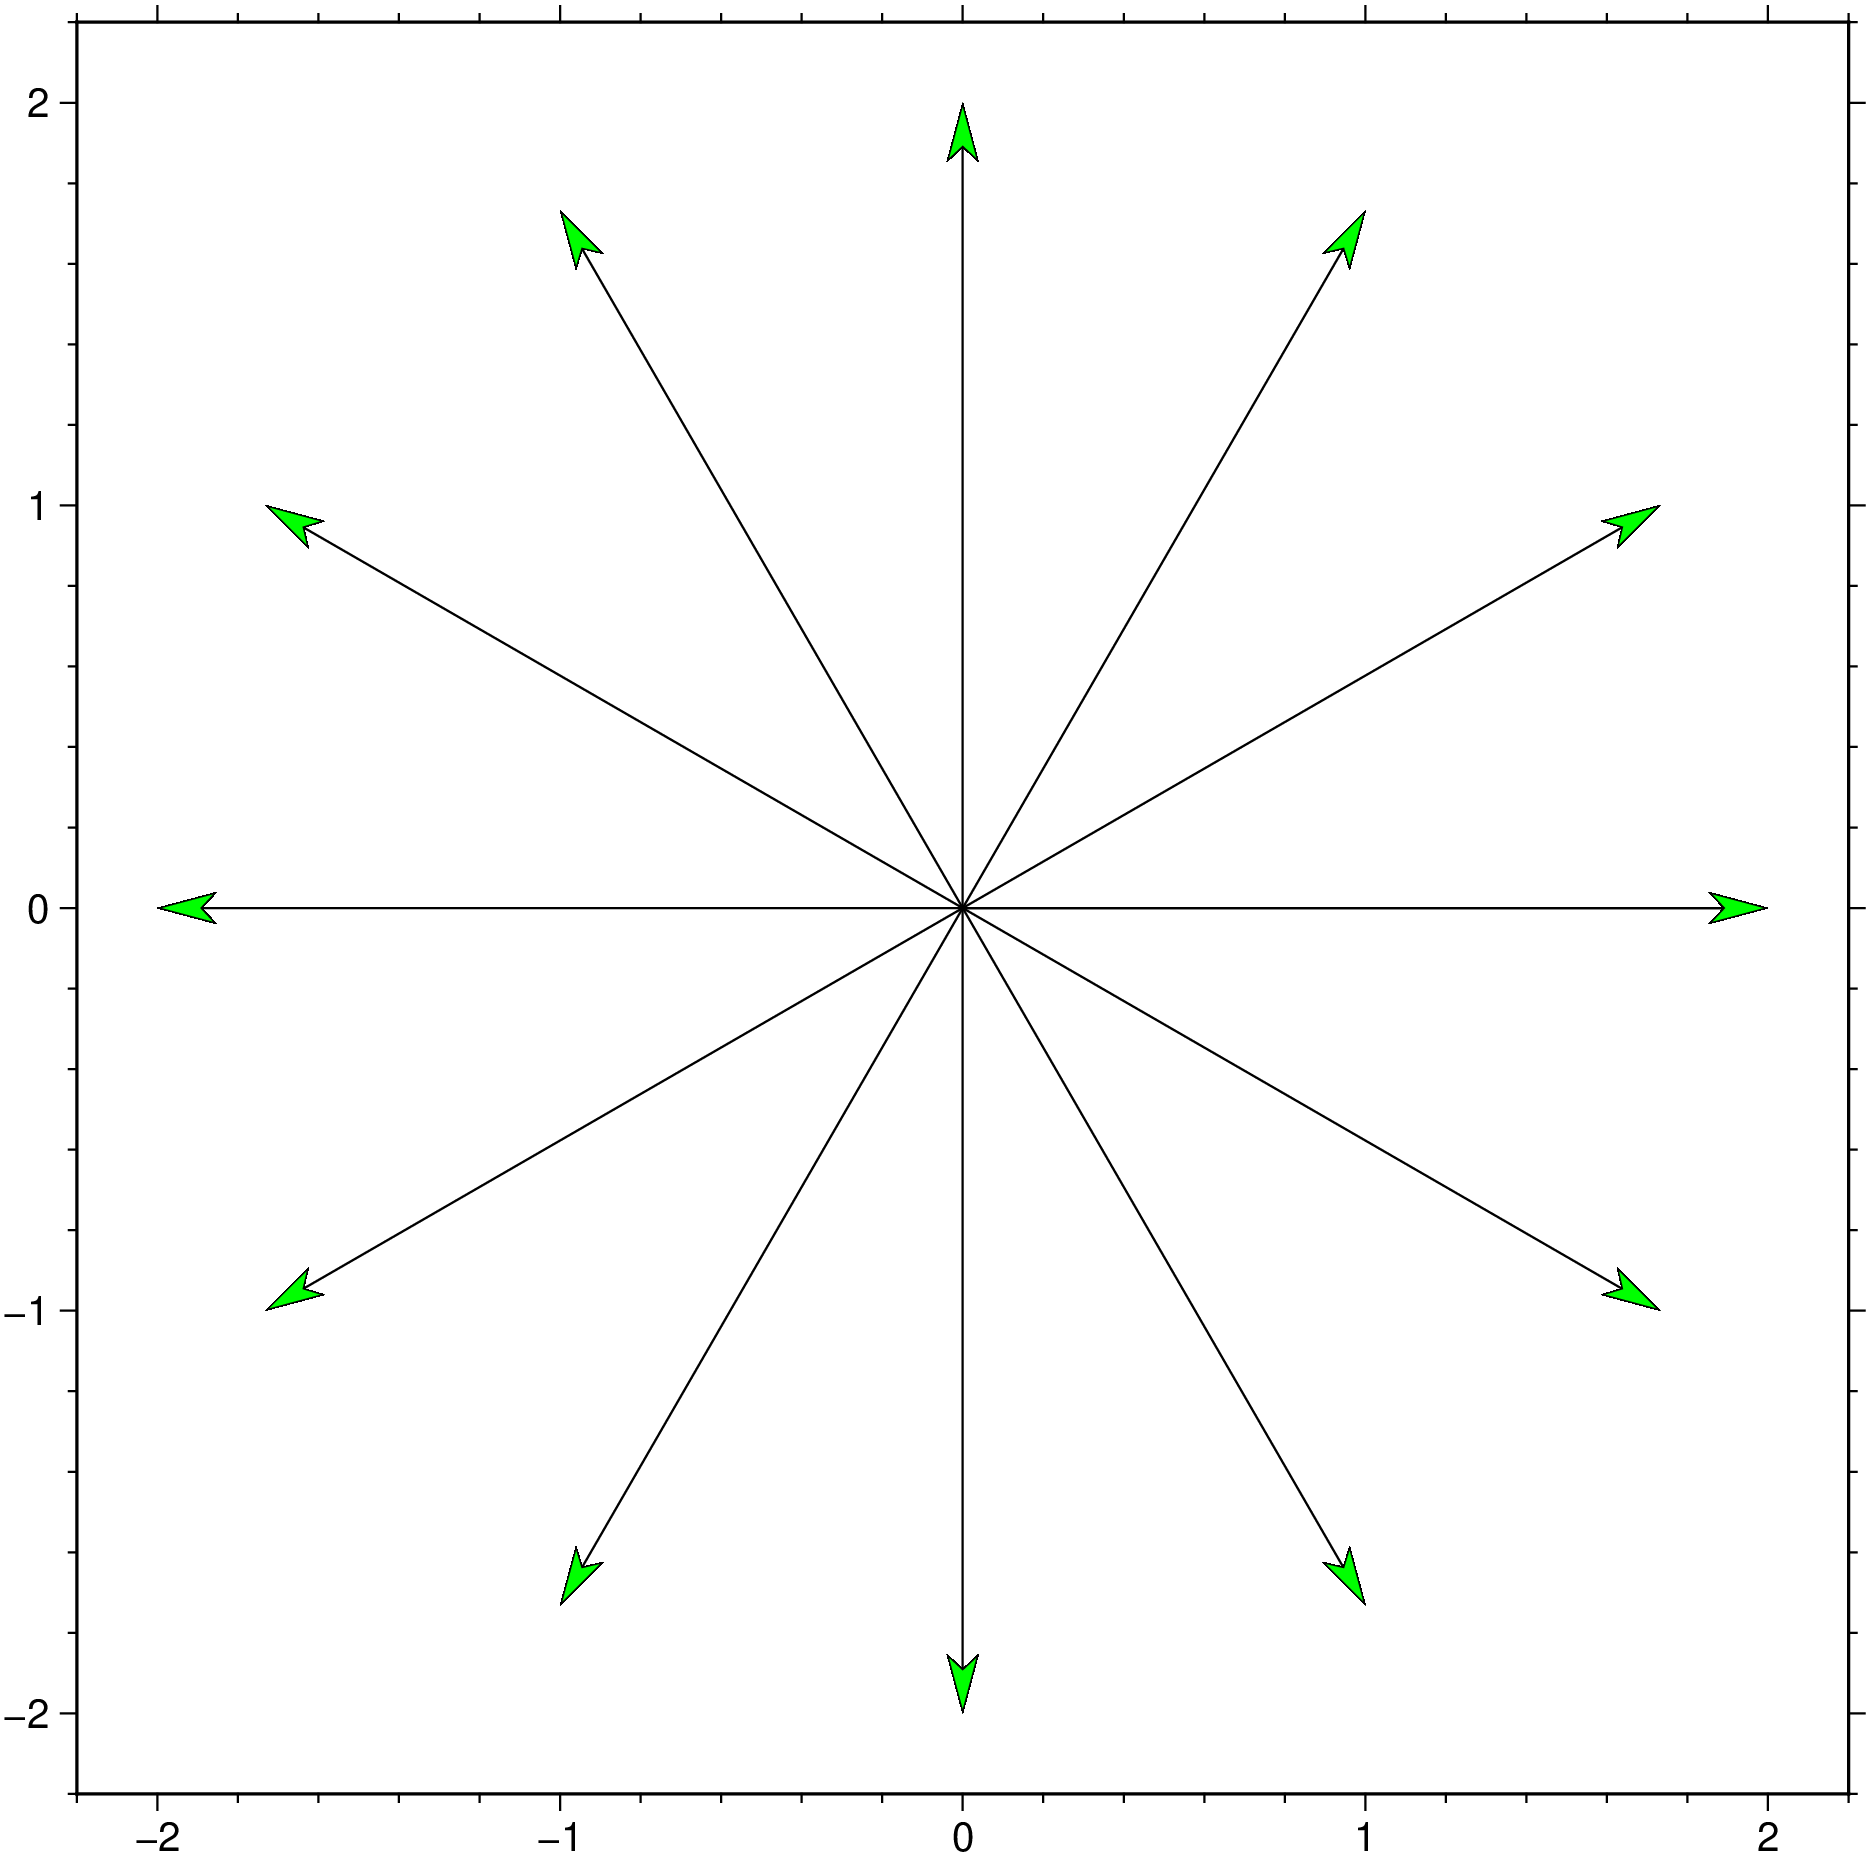
= [0.0 0 2.0 ; 0.0 30 2 ; 0.0 60 2 ; 0.0 90 2 ; 0.0 120 2 ; 0.0 150 2 ; 0.0 180 2 ; 0.0 210 2 ; 0.0 240 2 ; 0.0 270 2 ; 0.0 300 2 ; 0.0 330 2 ; 0.0 360 2 ]
using GMT = [0.0 0 2.0 ; 0.0 30 2 ; 0.0 60 2 ; 0.0 90 2 ; 0.0 120 2 ; 0.0 150 2 ; 0.0 180 2 ; 0.0 210 2 ; 0.0 240 2 ; 0.0 270 2 ; 0.0 300 2 ; 0.0 330 2 ; 0.0 360 2 ];feather (uv, rtheta= true , aspect= "1:1" , arrow= (len= 0.5 , shape= 0.5 ,),= 0.5 , fill=: green, show= true )
Simple arrows and in function of number of arrows.
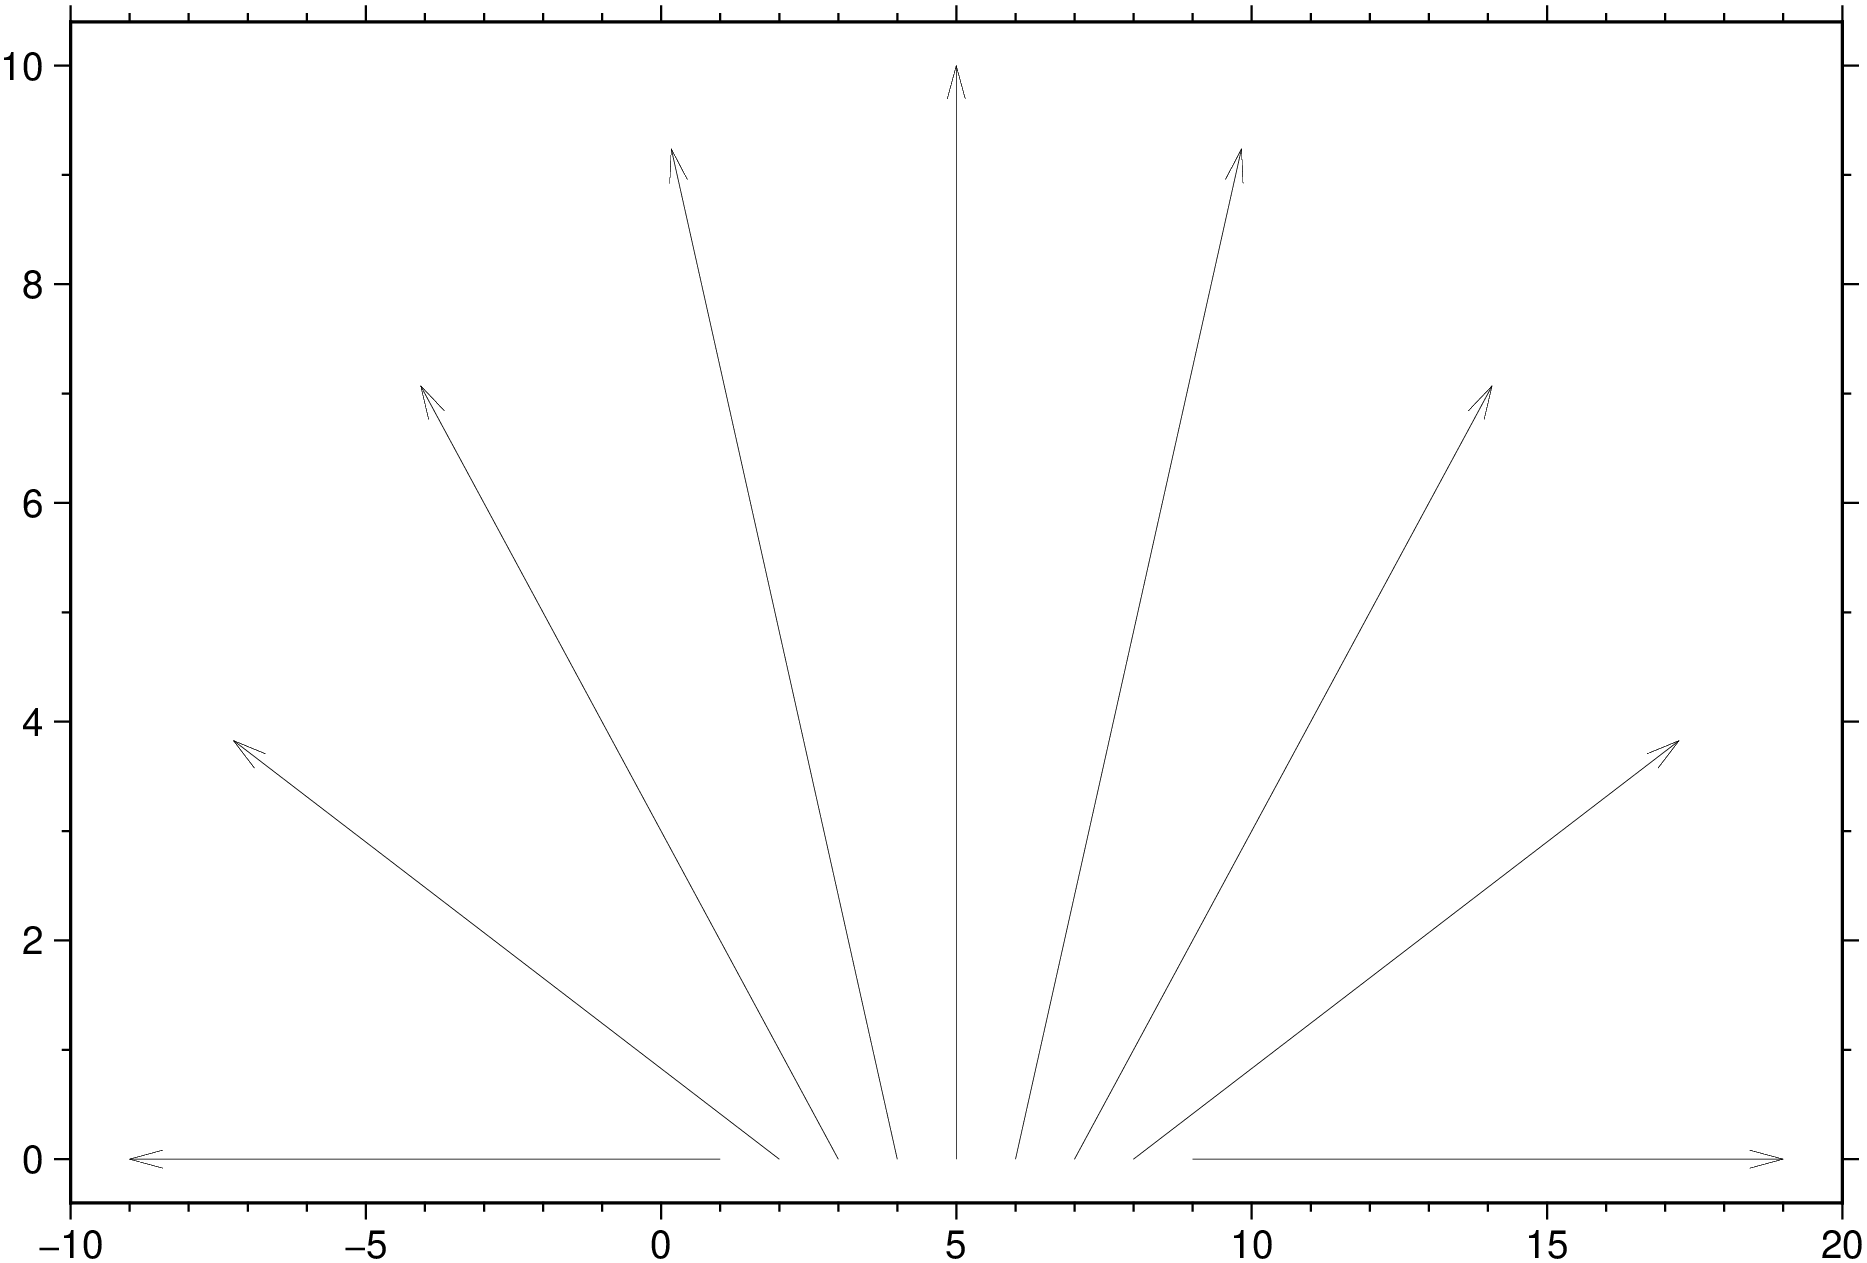
using GMT = - pi / 2 : pi / 8 : pi / 2 ; u = 10 *sin .(t); v = 10 *cos .(t);feather (u,v, show= true )
Show the data used in this example.
using GMT, PrettyTables # hide
getpath4docs(file::String) = joinpath("..", "..", "..", "..", "..", file) # hide
io = IOBuffer() # hide
D = gmtread(TESTSDIR * "assets/wind_faro_s.dat")
PrettyTables.pretty_table(io, D.data; header=D.colnames, backend=Val(:html)) # hide
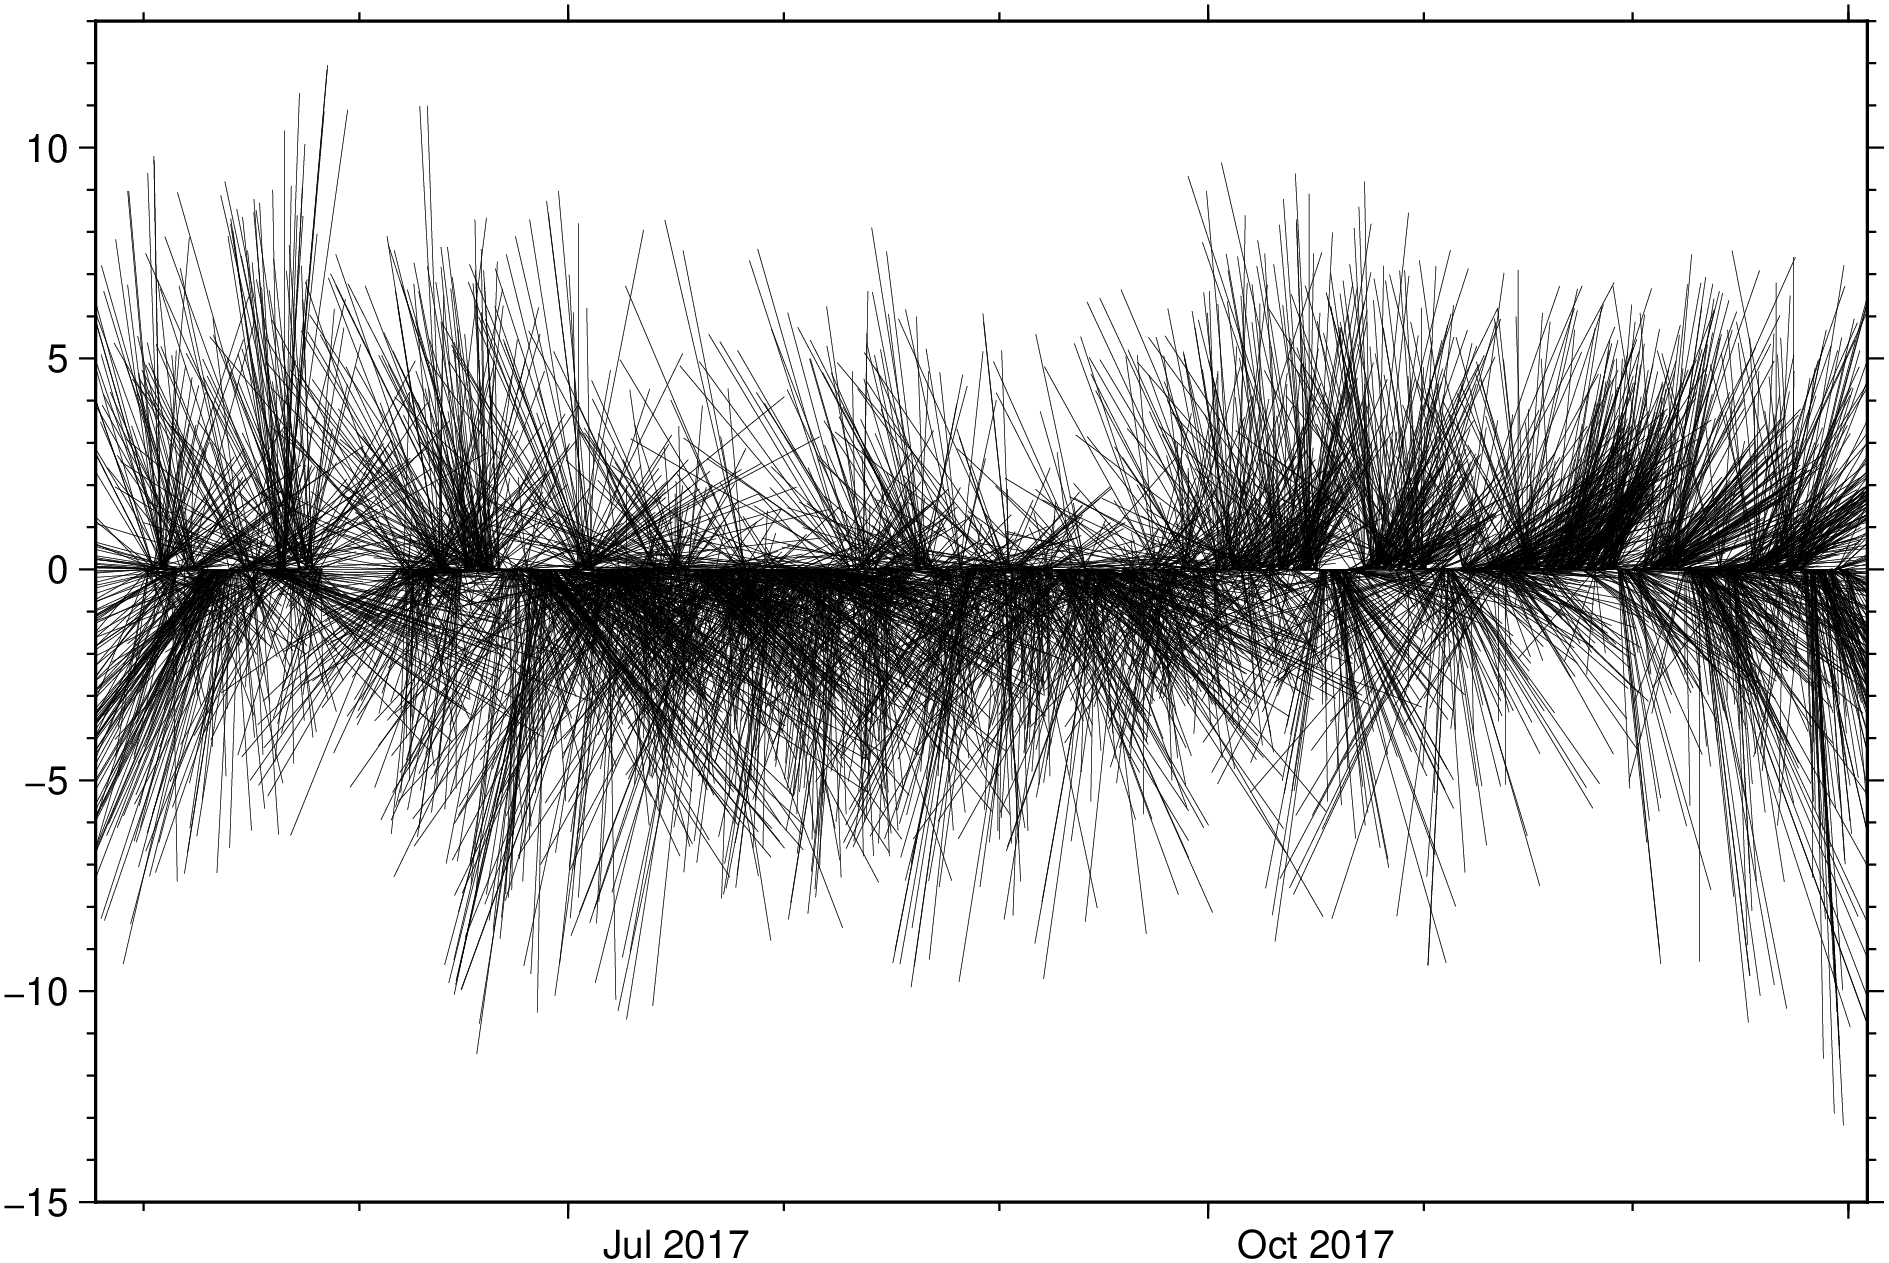
println("~~~" * String(take!(io)) * "~~~") # hideCreate a winbarb plot. Note that since the data has 4 columns we must select the 3 that we want to use in the plot. We select the columns from teir names in the D GMTdataset .
using GMT resetGMT () # hide feather (TESTSDIR * "assets/wind_faro.dat" , xvar=: Time , yvar= [: azimuth, : vmean],= true , nohead= 1 , lw= 0.1 , show= true )