Navigation
PCAs
Examples
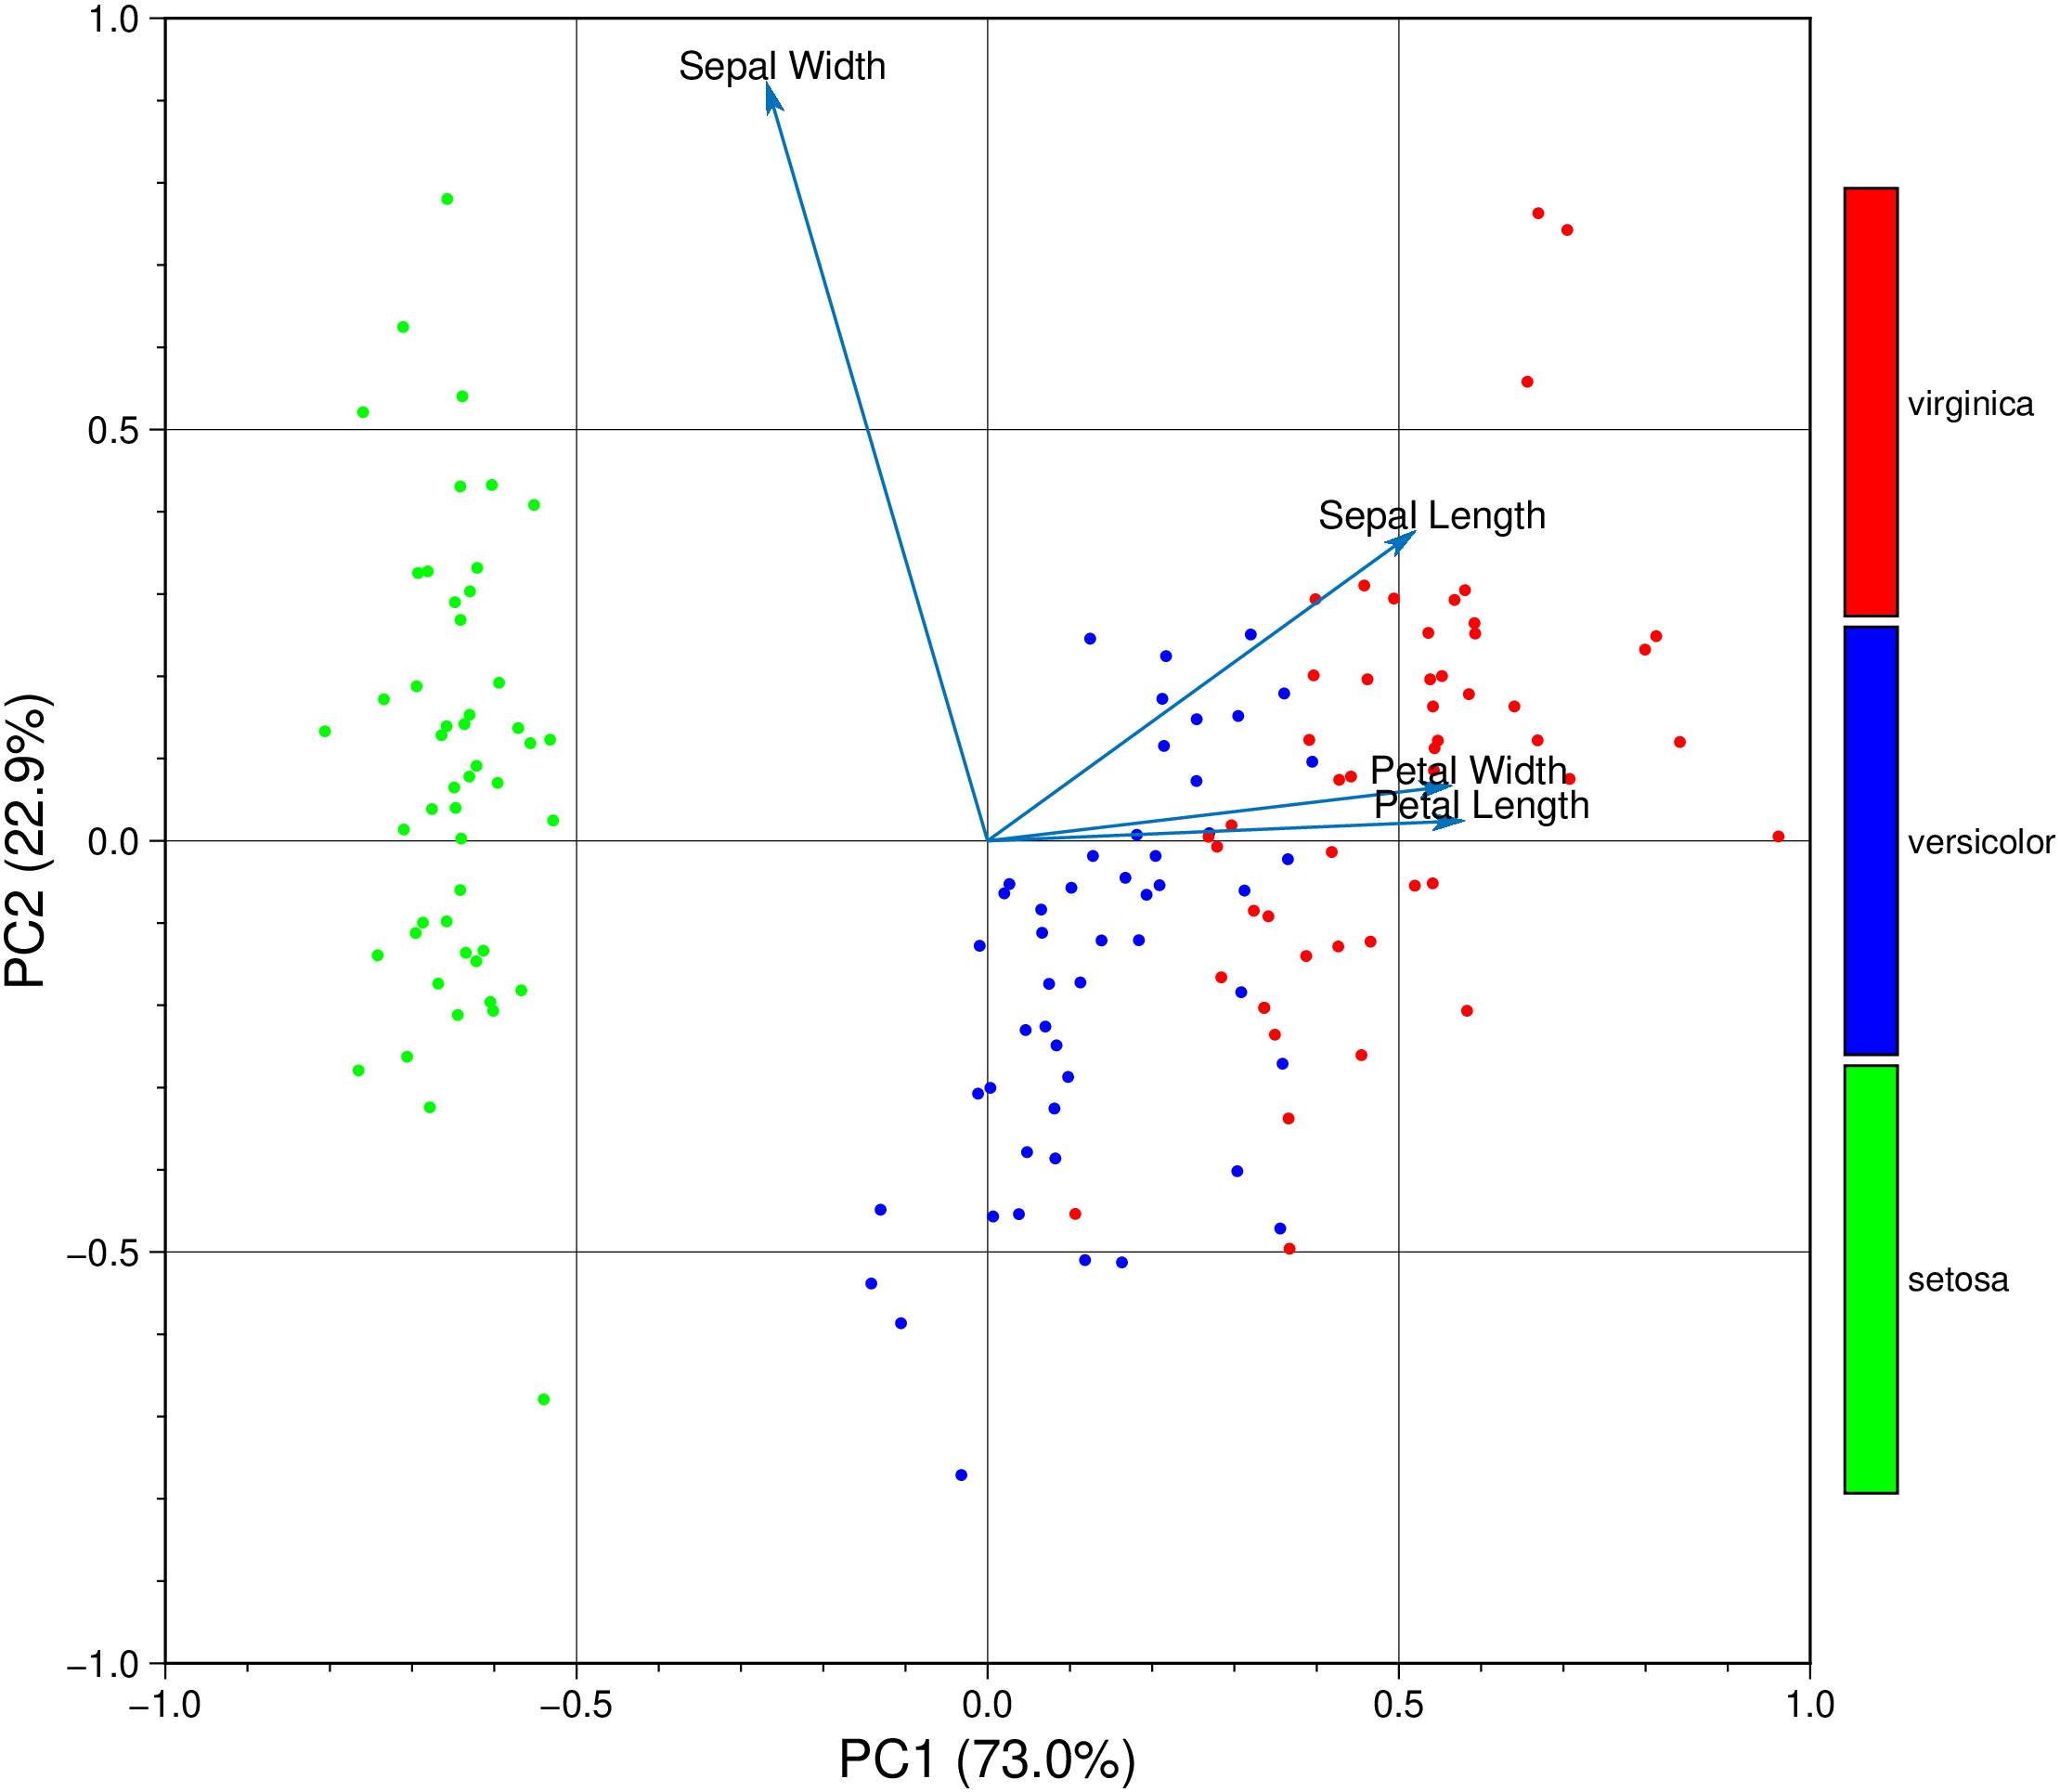
The classic analysis of the Iris dataset.
using GMT

biplot(TESTSDIR * "iris.dat", show=true)
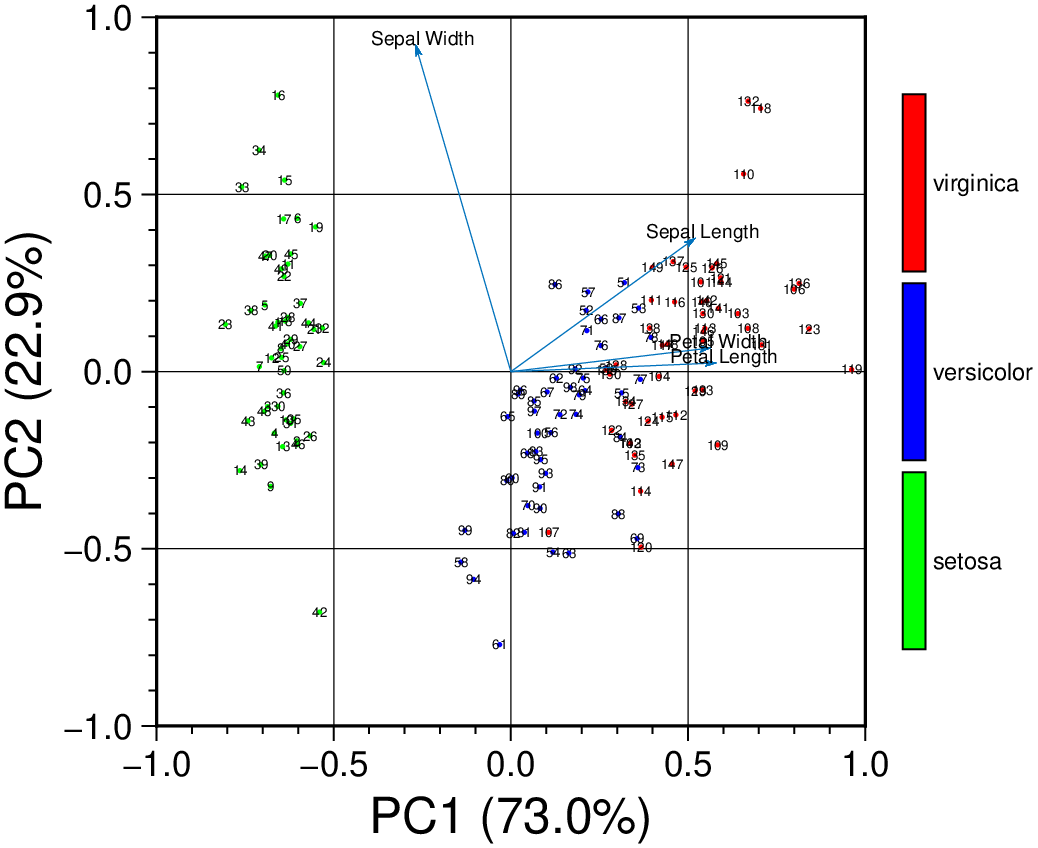
Plot a 6 cm fig with included observarion numbers.
using GMT

biplot(TESTSDIR * "iris.dat", figsize=6, obsnumbers=true, show=true)
© GMT.jl. Last modified: November 08, 2025. Website built with Franklin.jl and the Julia programming language.
These docs were autogenerated using GMT: v1.33.1