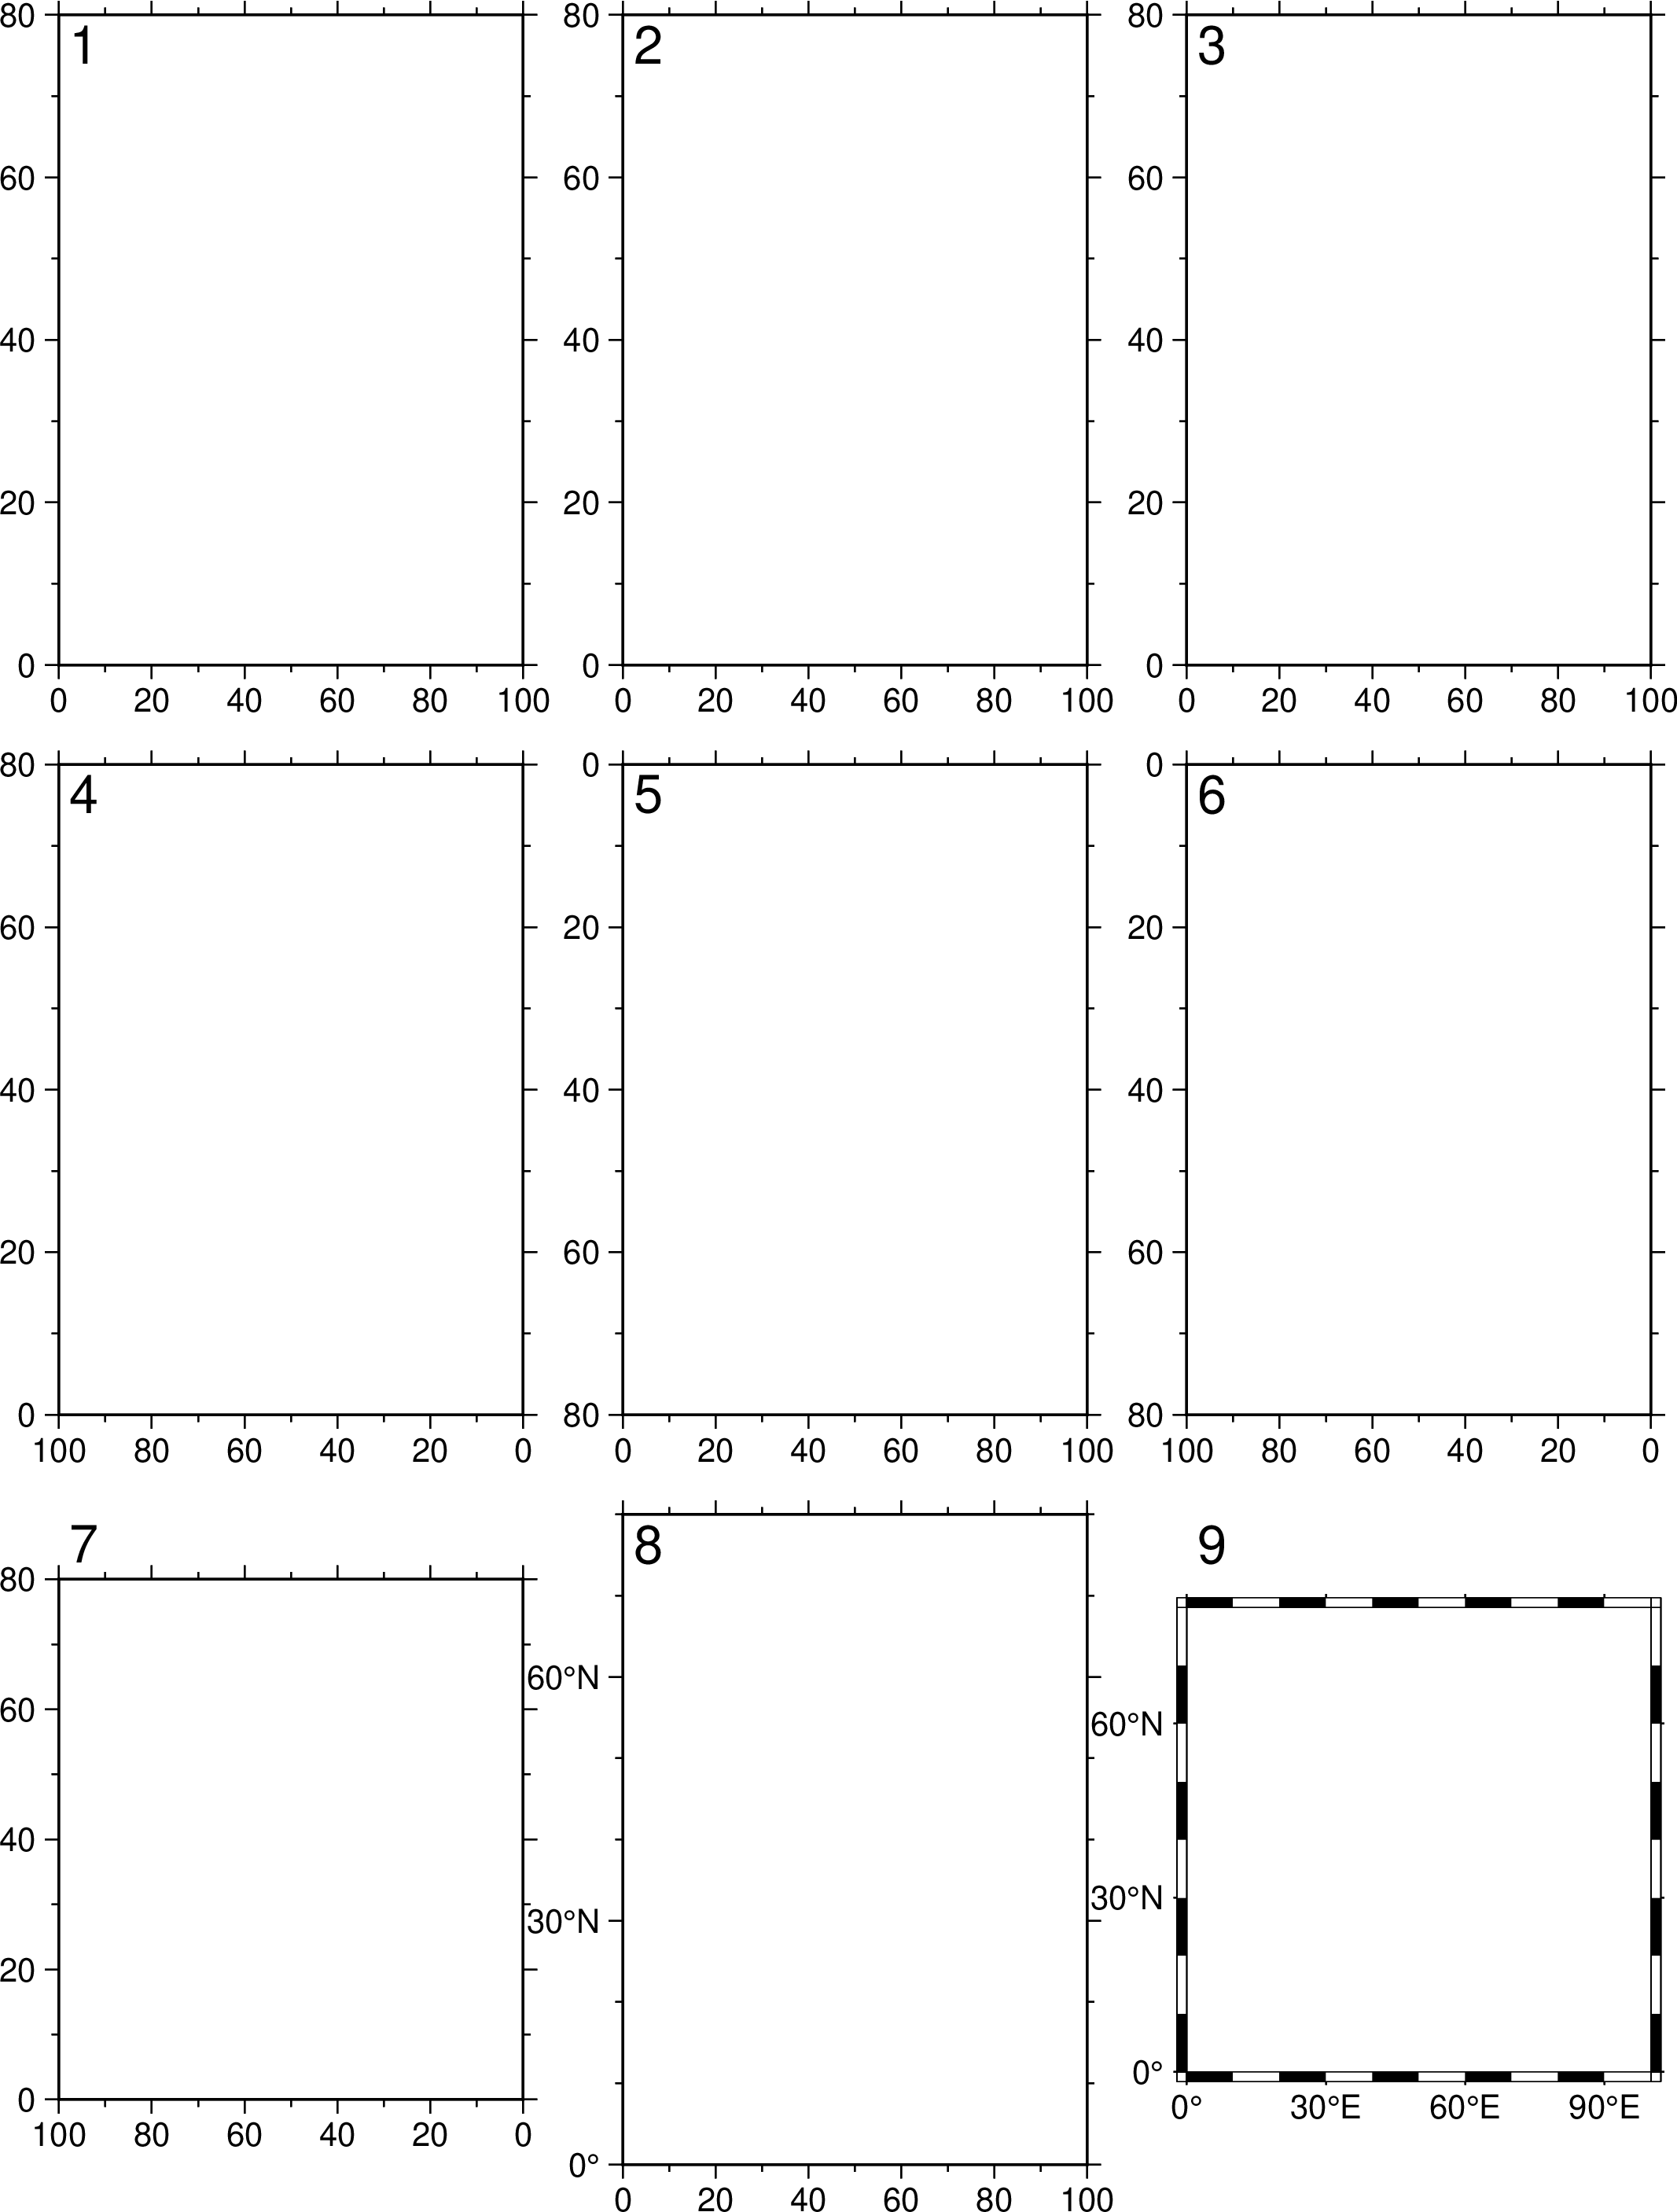
subplot module is used to split the current figure into a rectangular layout of subplots that each may contain a single self-contained figure. A subplot setup is started with the subplot directive that defines the layout of the subplots, while positioning to a particular subplot for plotting is done via the subplot(:set, …) directive. The subplot process is completed via the subplot(:end) or subplot(:show) directives.
grid : grid=“nrows x ncols”|grid=(nrows, ncols)
Specifies the number of rows and columns of subplots. Each row will have the same number of subplots. Note1: Use NO spaces with the first form. i.e.grid=“2x2” and NOTgrid=” 2 x 2” Note2: You are not required to place a plot in each subplot.
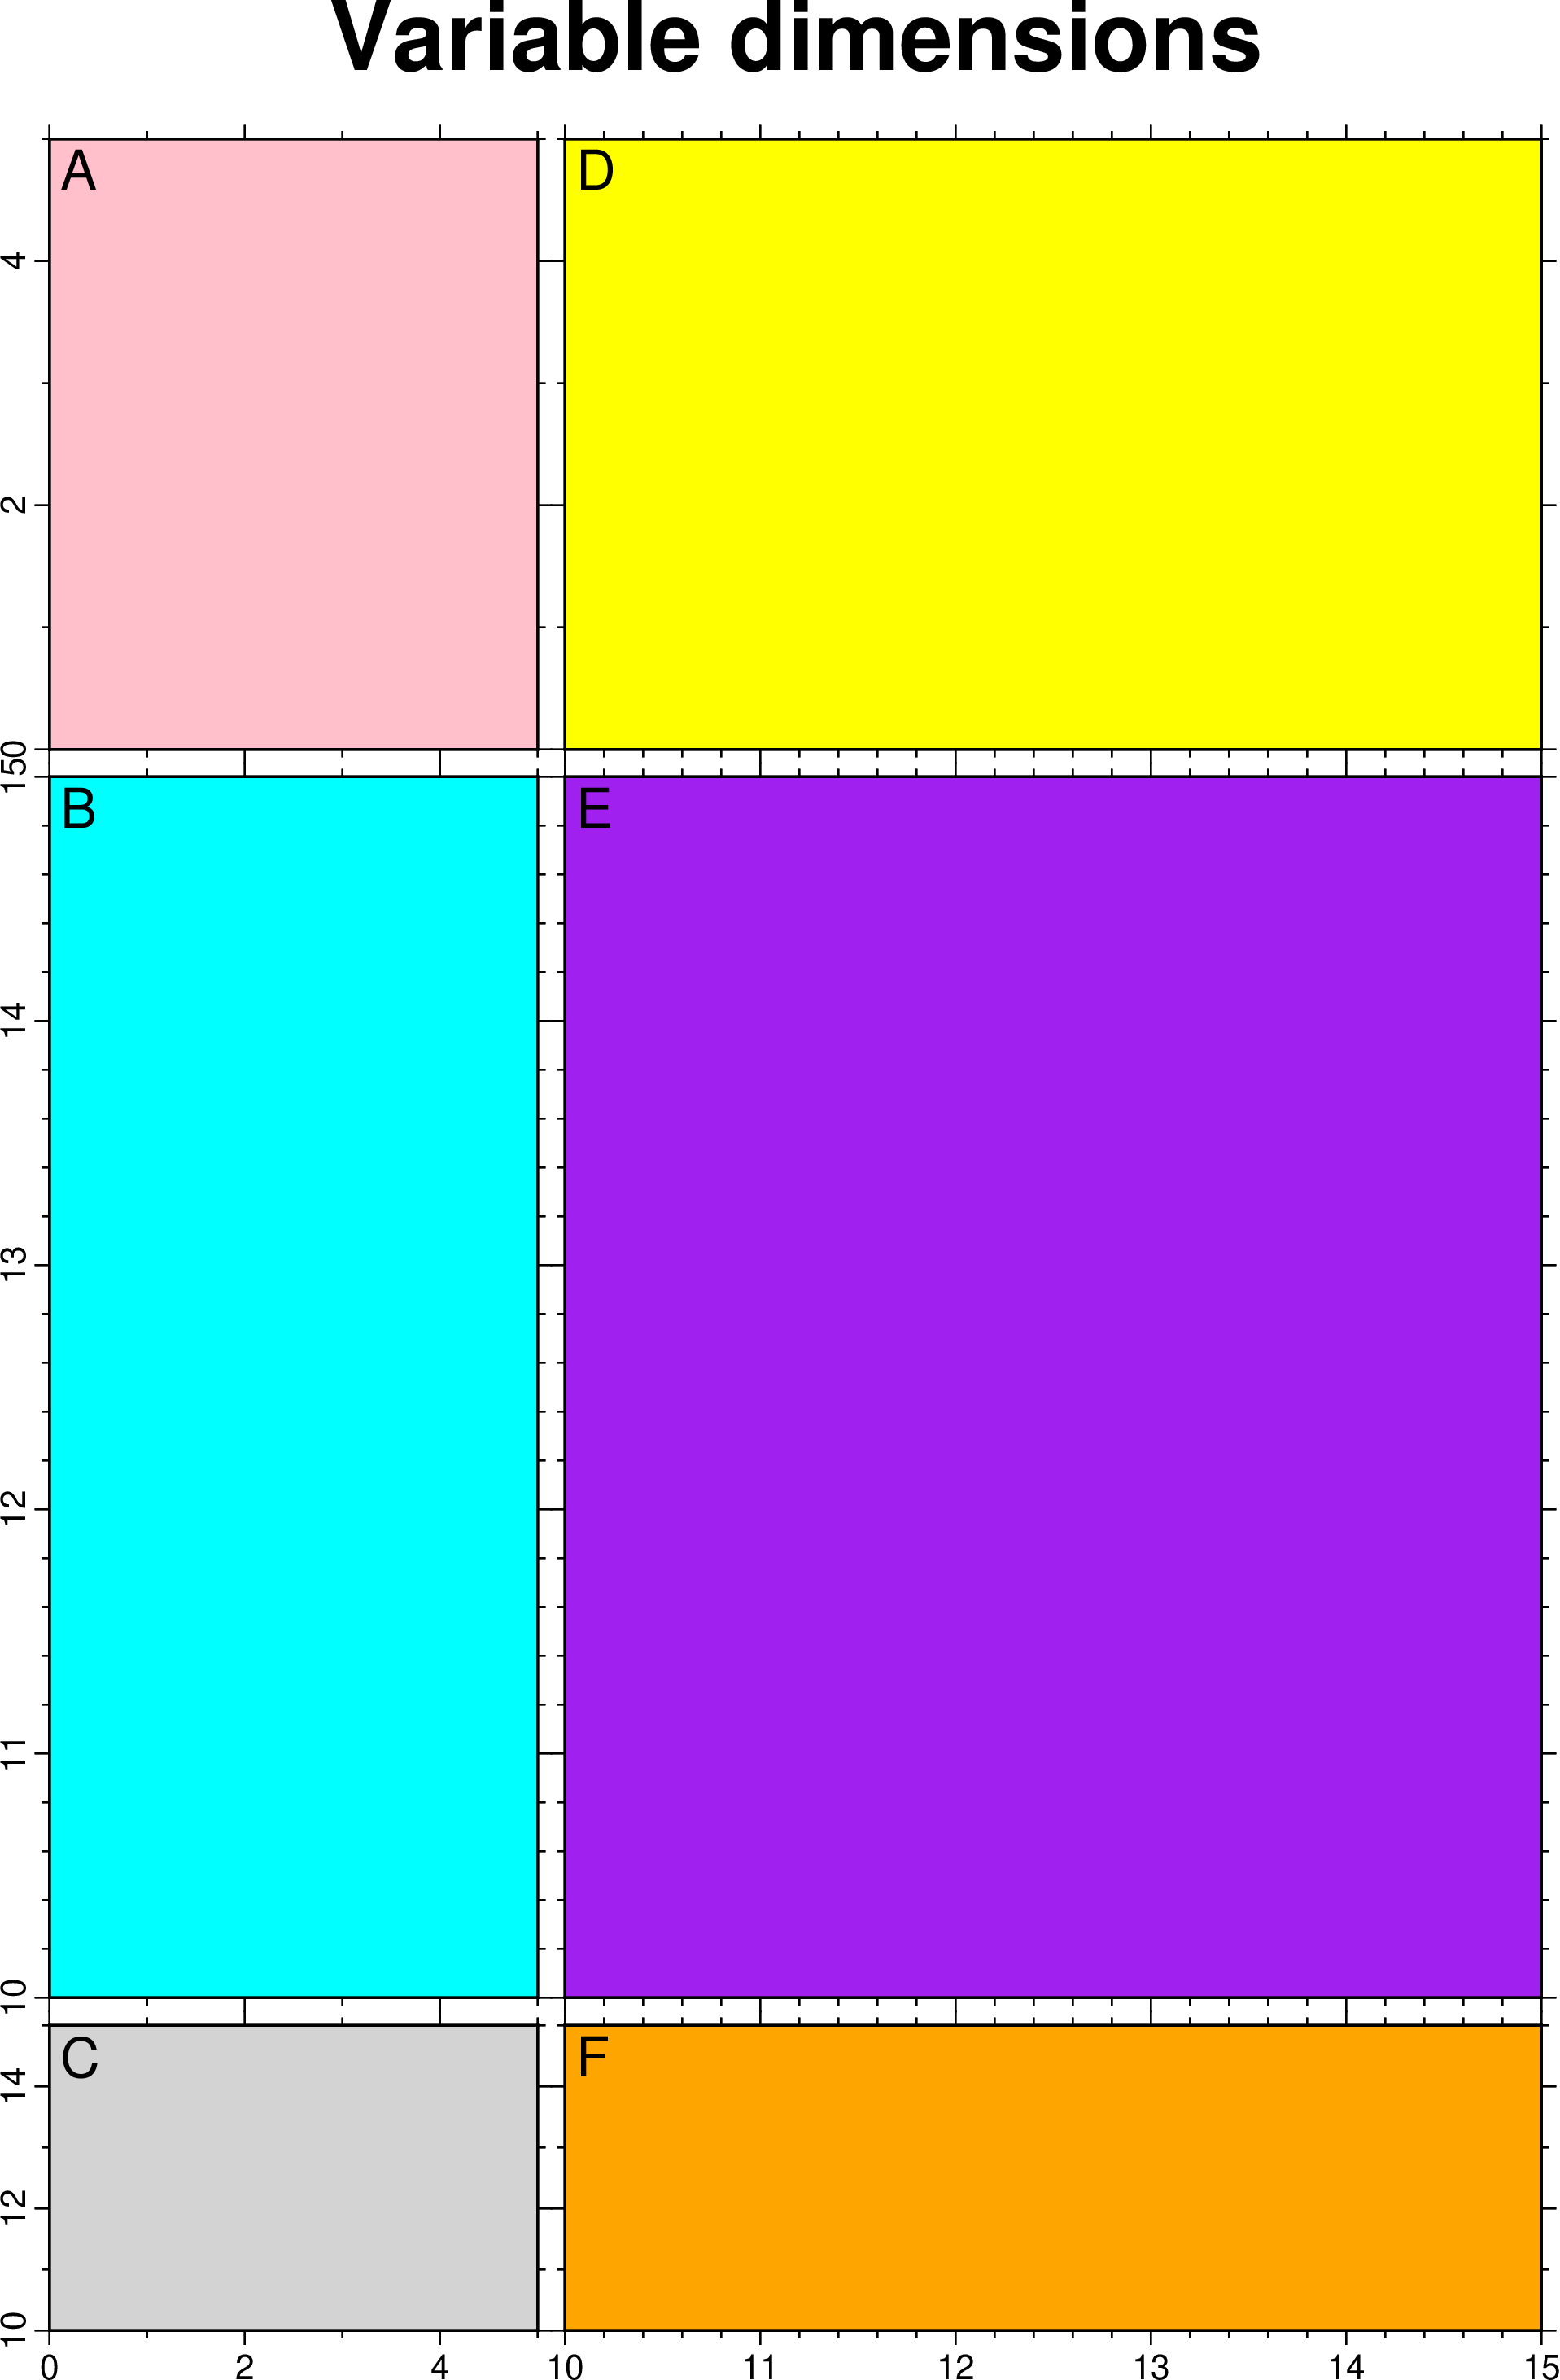
F or dims or dimensions or size or sizes : – dims=(panels=(w,h), figsize=(w,h), frac=(), clearance=(dx,dy), outline=pen, fill=color, divlines=pen)
Specify the dimensions of the figure. There are two different ways to do this:
With the keyword figsize Specify overall figure dimensions
With the keyword panels specify the dimensions of a single subplot.
For grids up to 3x3 and 2x1 and 3x1, if neither figsize or panels are specified, an estimation of the panels size plus margins will be provided. This may suite many use cases but with a probable need to specify better margins.
figsize
Specify the final figure dimensions. The subplot dimensions are then calculated from the figure dimensions after accounting for the space that optional tick marks, annotations, labels, and margins occupy between subplots. As for other figures, annotations, ticks, and labels along the outside perimeter are not counted as part of the figure dimensions. To specify different subplot dimensions for each row (or column), append frac with value given as a tuple of width and height fractions. For example dims=(size=(10,10), frac=((3,1),(1,2))) will make a 10x10 cm fig with the first column three times as wide as the second, while the second row will be twice as tall as the first row. A single number means constant widths (or heights) [Default]. If prefered, instead of size and/or frac as tuples, the width=x, height=y, fwidth=(…), fheight=(…) form is also allowed.
panels
Specify the dimensions of each subplot directly. Then, the figure dimensions are computed from the subplot dimensions after adding the space that optional tick marks, annotations, labels, and margins occupy between subplots. As for other figures, annotations, ticks, and labels along the outside perimeter are not counted as part of the figure dimensions. To specify different subplot dimensions for each row (or column), append a comma-separated list of widths, a slash, and then the comma-separated list of heights. A single number means constant widths (or heights) [Default]. For example dims=(panels=((5,8),8),) will make the first column 5 cm wide and the second column 8 cm wide, with all having a constant height of 8 cm. The number of values must either be one (constant across the rows or columns) or exactly match the number of rows (or columns). For geographic maps, the height of each subplot depends on your map region and projection. There are two options:
Specify both limits and projection and we use these to compute the height of each subplot. All subplots must share the same region and projection and you specify a zero height, or
you can select height based on trial and error to suit your plot layout.
Optionally, you may draw the outline (outline=pen) or paint (fill=color) the figure rectangle behind the subplots, add dividing lines between panels (divlines=pen), and even expand it via clearance=(dx,dy). These are most useful if you supply axes=:none, meaning no ticks or annotations will take place in the subplots. See [Setting color] and [Pen attributes] for extend color and pen selections.
But when we only want to set panels with a constant size one can use the simpler form subplot(grid=…, panels_size=8, …), i.e. without using the dims=(panels=()) form. panels_size, panel_size and panel_sizes are all aliases.
Optional Arguments
A or autolabel : – autolabel=(Anchor=tag, anchor=tag, label=““, clearance=(dx,dy), fill=color, pen=pen, offset=, roman=Bool, Roman=Bool, vertical=Bool)
Specify automatic tagging of each subplot. Use label= either a number or letter (as a string) [Default “a”]. This sets the tag of the first, top-left subplot and others follow sequentially. Surround the number or letter by parentheses on any side if these should be typeset as part of the tag. Use anchor or Anchor=refpoint to specify where the tag should be placed in the subplot [TL, meaning TopLeft]. Note: anchor sets the justification of the tag to refpoint (suitable for interior tags) while Anchor instead selects the mirror opposite (suitable for exterior tags).
Append clearance=dx or clearance=(dx,dy) to set the clearance between the tag and a surrounding text box requested via fill or pen [3p/3p, i.e., 15% of the FONT_TAG size dimension].
Append fill=color to paint the tag’s text box with color [no painting].
Append offset=dx or offset=(dx,dy) to offset the tag’s reference point in the direction implied by the justification [4p/4p, i.e., 20% of the FONT_TAG size].
Append pen=pen to draw the outline of the tag’s text box using selected pen [no outline].
Append roman=true to typeset your tag numbers using lowercase Roman numerals.
Append Roman=true for uppercase Roman numerals [Arabic numerals].
Append vertical=true to increase tag numbers vertically down columns [horizontally across rows].
B or axes or frame
Set map boundary frame and axes attributes. Default is to draw and annotate left, bottom and vertical axes and just draw left and top axes. More at frame
C or clearance : – clearance=val|clearance=(left=val, right=val, bott=val, bottom=val, top=val))
Reserve a space of dimension val between the margin and the subplot on the specified side, using side values from left=val, right=val, bottom=val, or top=val. No side means all sides. Can specify more than one side. Such space will be left untouched by the main map plotting but can be accessed by modules that plot scales, bars, text, etc. Settings specified under begin directive apply to all subplots, while settings under set only apply to the selected (active) subplot. Note: Common options xshift and yshift are not available during subplots; use clearance instead.
D or noframes : – noframes=true|false
Use the prevailing defaults settings (via par=(...)) and the selections made via frame, clearance, margins and S to determine the panel sizes (if using dims_figsize_) and panel spacings only, but do not draw and annotate any frames. This option is useful if you wish to lay down a partial subplot with annotations and frames, but then want to plot data inside it separately later without redrawing the frames. With different frame, clearance, margins and S choices the two subplots may not align, but with noframes they will. Note: It is assumed that noframes stays the same [Draw and annotate frames as indicated].
J or proj or projection : – proj=
Select map projection. More at proj
M or margins : – margins=val
This is margin space that is added between neighboring subplots (i.e., the interior margins) in addition to the automatic space added for tick marks, annotations, and labels. The margins can be specified as a single value (for same margin on all sides), a pair of values separated by slashes (or in a tuple) (for setting separate horizontal and vertical margins), or the full set of four slash-separated margins (for setting separate left, right, bottom, and top margins). The actual gap created is always a sum of the margins for the two opposing sides (e.g., east plus west or south plus north margins) [Default is half the primary annotation font size, giving the full annotation font size as the default gap].
R or region or limits : – limits=(xmin, xmax, ymin, ymax)|limits=(BB=(xmin, xmax, ymin, ymax),)|limits=(LLUR=(xmin, xmax, ymin, ymax),units=“unit”)| …more
Specify the region of interest. More at limits. For perspective view view, optionally add zmin,zmax. This option may be used to indicate the range used for the 3-D axes. You may ask for a larger w/e/s/n region to have more room between the image and the axes.
SC or col_axes or colaxes or sharex : – col_axes=(top=““, bott=”“, bottom=”“, label=”“, grid=pen)
SR or row_axes or rowaxes or sharey : – row_axes=(left=““, right=”“, label=”“, parallel=”“, row_title=”t”, top_row_title=““, grid=pen)
Set subplot layout for shared axes. May be set separately for rows (row_axes) and columns (col_axes).
Considerations for col_axes:
Use when all subplots in a column share a common x-range. The first (i.e., top) and the last (i.e., bottom) rows will have x annotations; append top=““ or bott=““ to select only one of those two rows [both].
Add label=““ if annotated x-axes should have a label [none]; optionally append the label if it is the same for the entire subplot. Labels and titles that depends on which row or column are specified as usual via a subplot’s own axes setting.
Considerations for row_axes:
Use when all subplots in a row share a common y-range. The first (i.e., left) and the last (i.e., right) columns will have y-annotations; append left=““ or right=““ to select only one of those two columns [both].
Add left=““ if annotated y-axes will have a label [none]; optionally, append the label if it is the same for the entire subplot.
Add row_title to make space for subplot titles for each row; use top_row_title for top row titles only [no subplot titles].
Add parallel=““ to make all annotations axis-parallel [horizontal]; if not used you may have to set clearance to secure extra space for long horizontal annotations.
Add grid=pen to draw horizontal and vertical lines between interior panels using selected pen [no lines].
T or title : – title=“Heading”
While individual subplots can have titles (see S or axes), the entire figure may also have a overarching heading [no heading]. Font is determined by setting FONT_HEADING.
Before you start plotting you must first select the active subplot. Note: If any figsize or figscale option is passed with auto as width or scale when plotting subplots, then the dimensions of the map are automatically determined by the subplot size and your region. For Cartesian plots: If you want the scale to apply equally to both dimensions then you must specify proj=:linear, figscale=“auto” [The default figsize=“auto” will fill the subplot by using unequal scales].
Optional Arguments
panel=(row,col)
Sets the current subplot until further notice. Note: First row or col is 1 not 0 like in plain GMT. If not given we go to the next subplot by order specified via autolabel=(vertical=true,). As an alternative, you may bypass the set mode and instead supply the common option panel=(row,col) to the first plot command you issue in that subplot. GMT maintains information about the current figure and subplot. Also, you may give the one-dimensional index instead which starts at 1 and follows the row or column order set via autolabel=(vertical=true,). panel=“next” or panel=““ are alternative index syntaxes
A or fixedlabel : – fixedlabel=“Label”
Overrides the automatic labeling with the given string. No modifiers are allowed. Placement, justification, etc. are all inherited from how autolablel was specified.
C or clearance : – clearance=(left=val, right=val, bott=val, bottom=val, top=val))
Reserve a space of dimension clearance between the margin and the subplot on the specified side. This setting has the same syntax and overrides the common clearances set by clearance outside the subplot(:set, …) command.
Any number of plotting command can now take place and all output will be directed to the selected subplot. There are a few other rules that need to be followed:
1. The subplot machinery expects the first plotting command in a new subplot window to take care of plotting the base frame. The particulars of this frame may have been specified by the row|col_axes option. In either case, should you need to set or override frame and axes parameters then you must specify these axes options with this first plot command. 2. The subplot machinery automatically uses the xshift and yshift options under the hood so these options are not available while a subplot is active.
Synopsis (end mode)
subplot(:end) or subplot(:show)
This command finalizes the current subplot, including any placement of tags, and updates the gmt.history to reflect the dimensions and linear projection required to draw the entire figure outline. This allows subsequent commands, such as colorbar, to use pos=… to place bars with reference to the complete figure dimensions. We also reset the current plot location to where it was prior to the subplot. The keyword :end just finishes the plot silently whislst with :show the plot is displayed automatically.
V or verbose : – verbose=true|verbose=level
Select verbosity level. More at verbose
X or xshift or x_offset : xshift=true|xshift=x-shift|xshift=(shift=x-shift, mov=“a|c|f|r”)
Shift plot origin. More at xshift
Y or yshift or y_offset : yshift=true|yshift=y-shift|yshift=(shift=y-shift, mov=“a|c|f|r”)
Shift plot origin. More at yshift
Currently, nesting of subplots is not implemented. With the geog projection one cannot set the fist axes to geog and the other to whatever because only last dimension is assigned that label. The solution to fine control here is to use the GMT syntax given as a string