using GMT

G = GMT.peaks(N=21);  # Create an example grid
pcolor(G, outline=(0.5,:dot), show=true)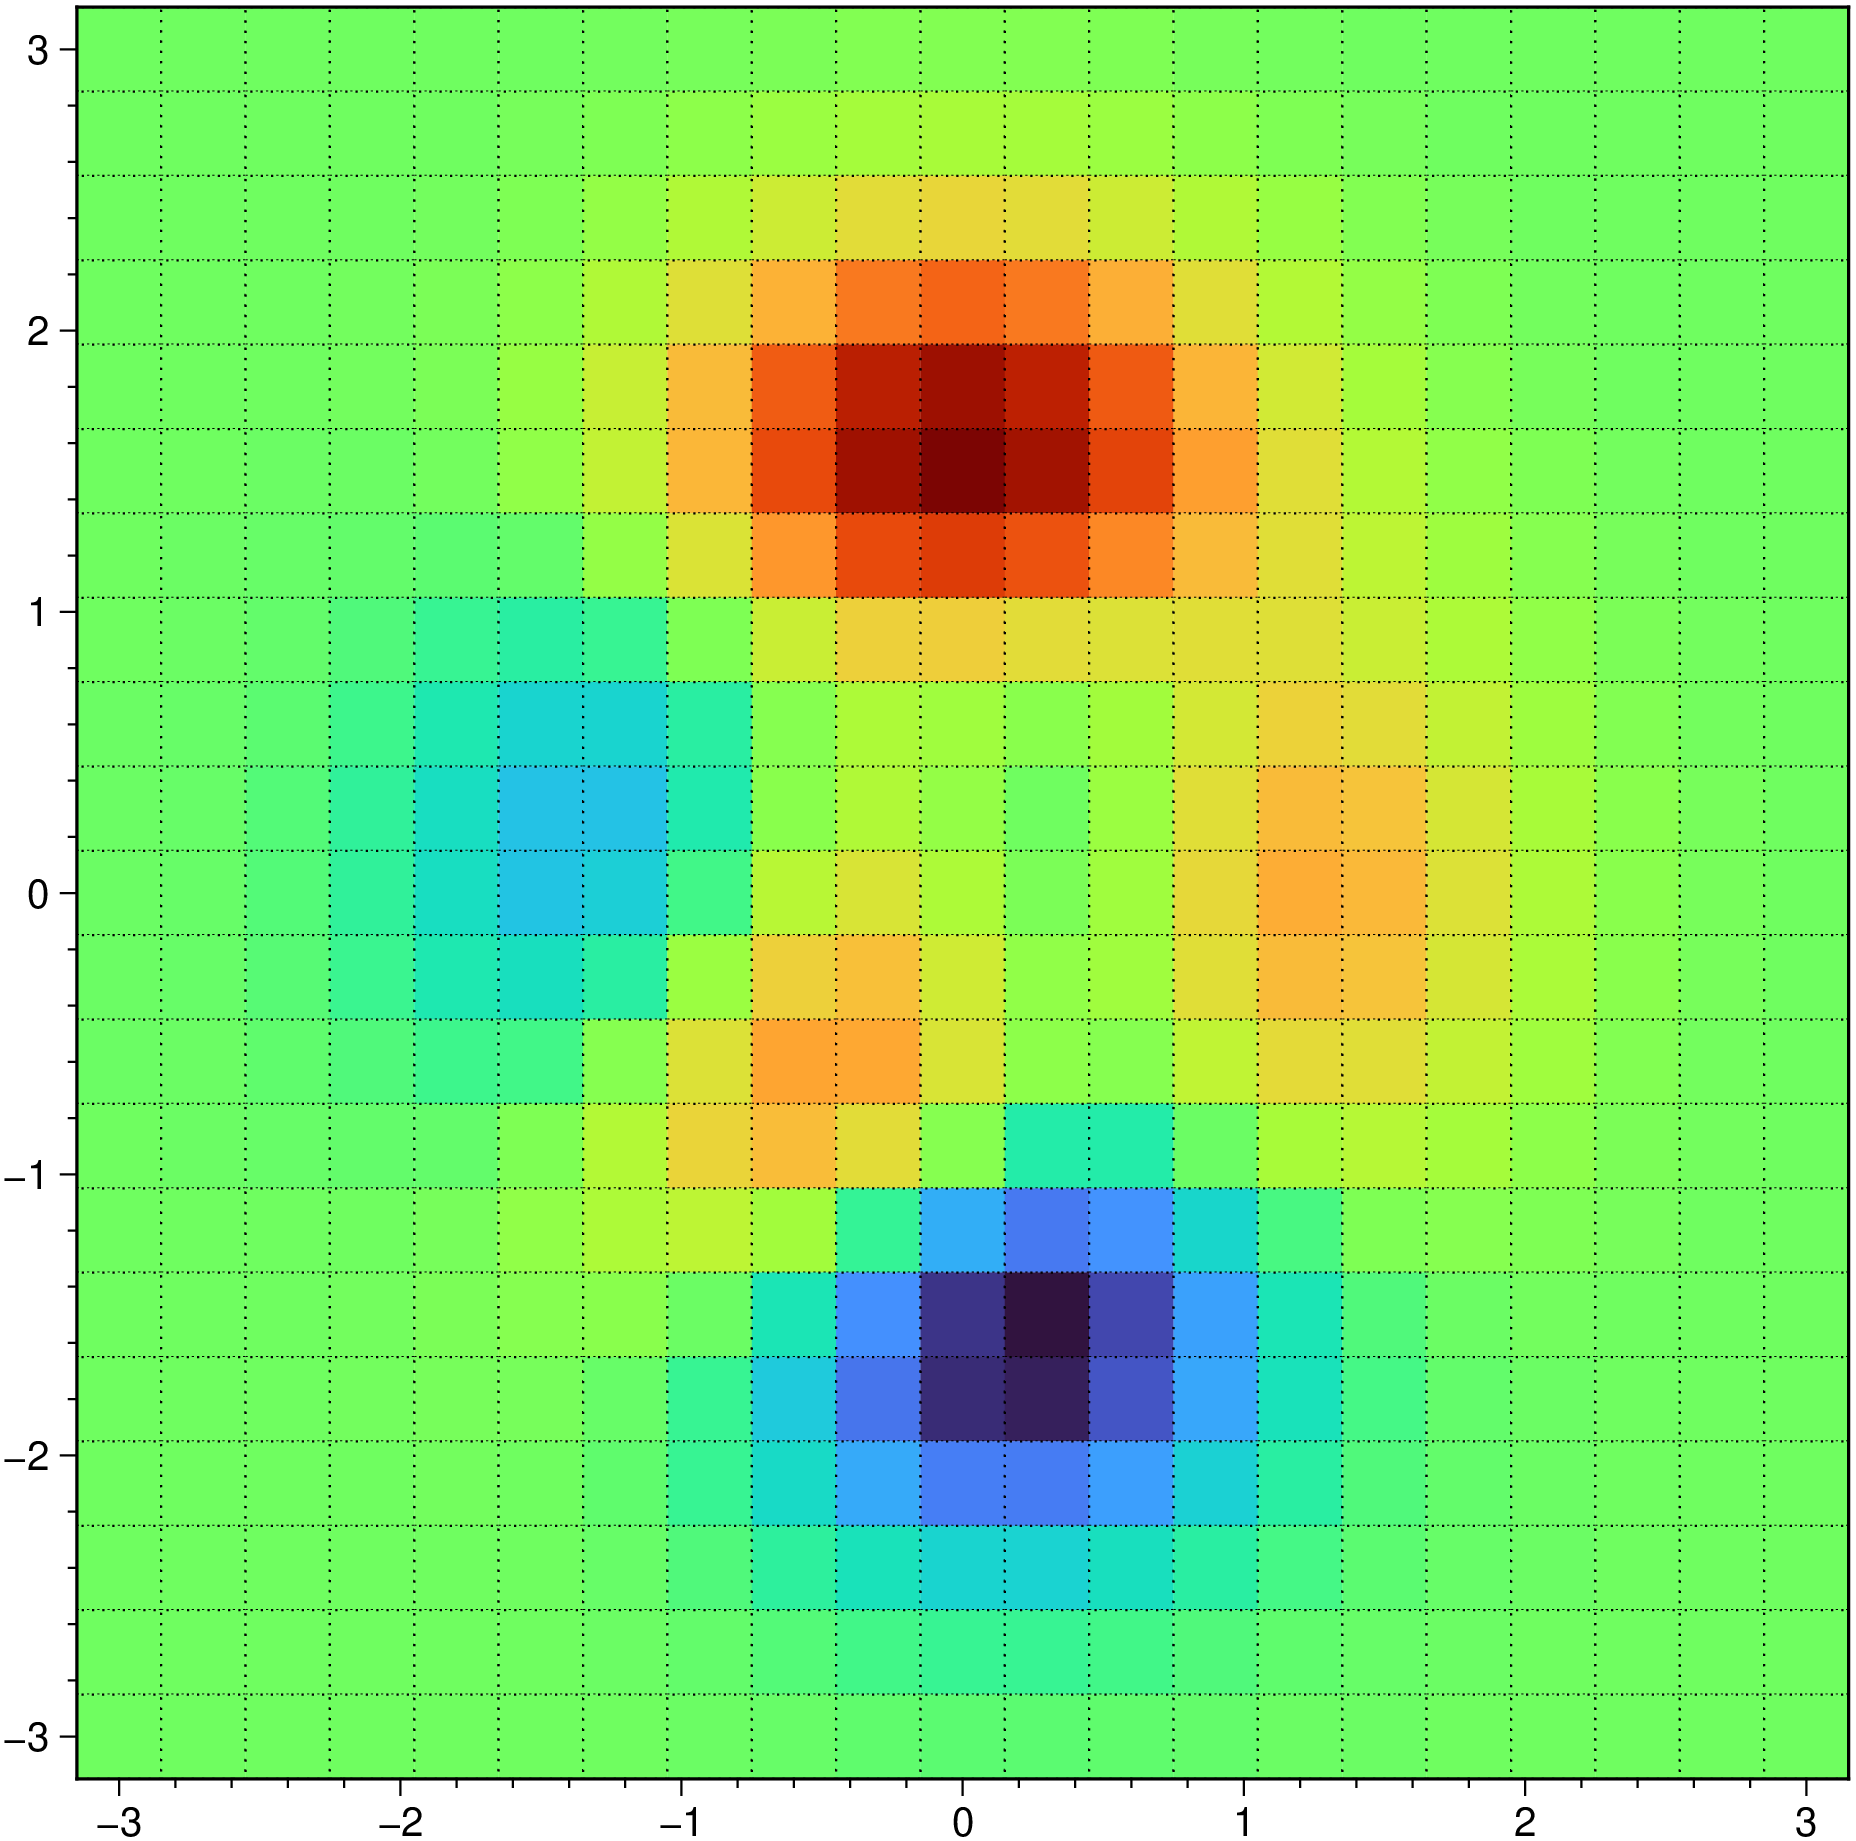
pcolor(X, Y, C::Matrix{<:Real}; kwargs...)Creates a colored cells plot using the values in matrix C. The color of each cell depends on the value of each value of C after consulting a color table (cpt). If a color table is not provided via option cmap=xxx we compute a default one.
X, Y: Vectors or 1 row matrices with the x- and y-coordinates for the vertices. The number of elements of X must match the number of columns in C (is using the grid registration model) or exceed it by one (pixel registration). The same for Y and the number of rows in C. Notice that X and Y do not need to be equispaced.
X, Y: Matrices with the x- and y-coordinates for the vertices. In this case the if X and Y define an m-by-n grid, then C should be an (m-1)-by-(n-1) matrix, though we also allow it to be m-by-n but we then drop the last row and column from C
C: A matrix with the values that will be used to color the cells.
kwargs: This form of pcolor is in fact a wrap up of plot so any option of that module can be used here.
labels: If this keyword is used then plot the value of each node in the corresponding cell. Use label=n, where n is integer and represents the number of printed decimals. Any other value like true, "y" or :y tells the program to guess the number of decimals.
font: When label is used one may also control text font settings. Options are a subset of the text attrib option. Namely, the angle and the font. Example: font=(angle=45, font=(5,:red)). If not specified, it defaults to font=(font=(6,:black),).
D = pcolor(X, Y; kwargs...)This form, that is without a color matrix, accepts X and Y as before but returns the tiles in a vector of GMTdatasets. Use the kwargs option to pass for example a projection setting (as for example proj=:geo).
pcolor(G::GMTgrid; kwargs...)This form takes a grid (or the file name of one) as input an paints it’s cell with a constant color.
outline: Draw the tile outlines and specify a custom pen if the default pen is not to your liking.
kwargs: This form of pcolor is a wrap of grdview so any option of that module can be used here. One can for example control the tilling option via grdview's tiles option.
using GMT
G = GMT.peaks(N=21); # Create an example grid
pcolor(G, outline=(0.5,:dot), show=true)
Now use the G x,y coordinates in the non-regular form
using GMT

pcolor(G.x, G.y, G.z, show=true)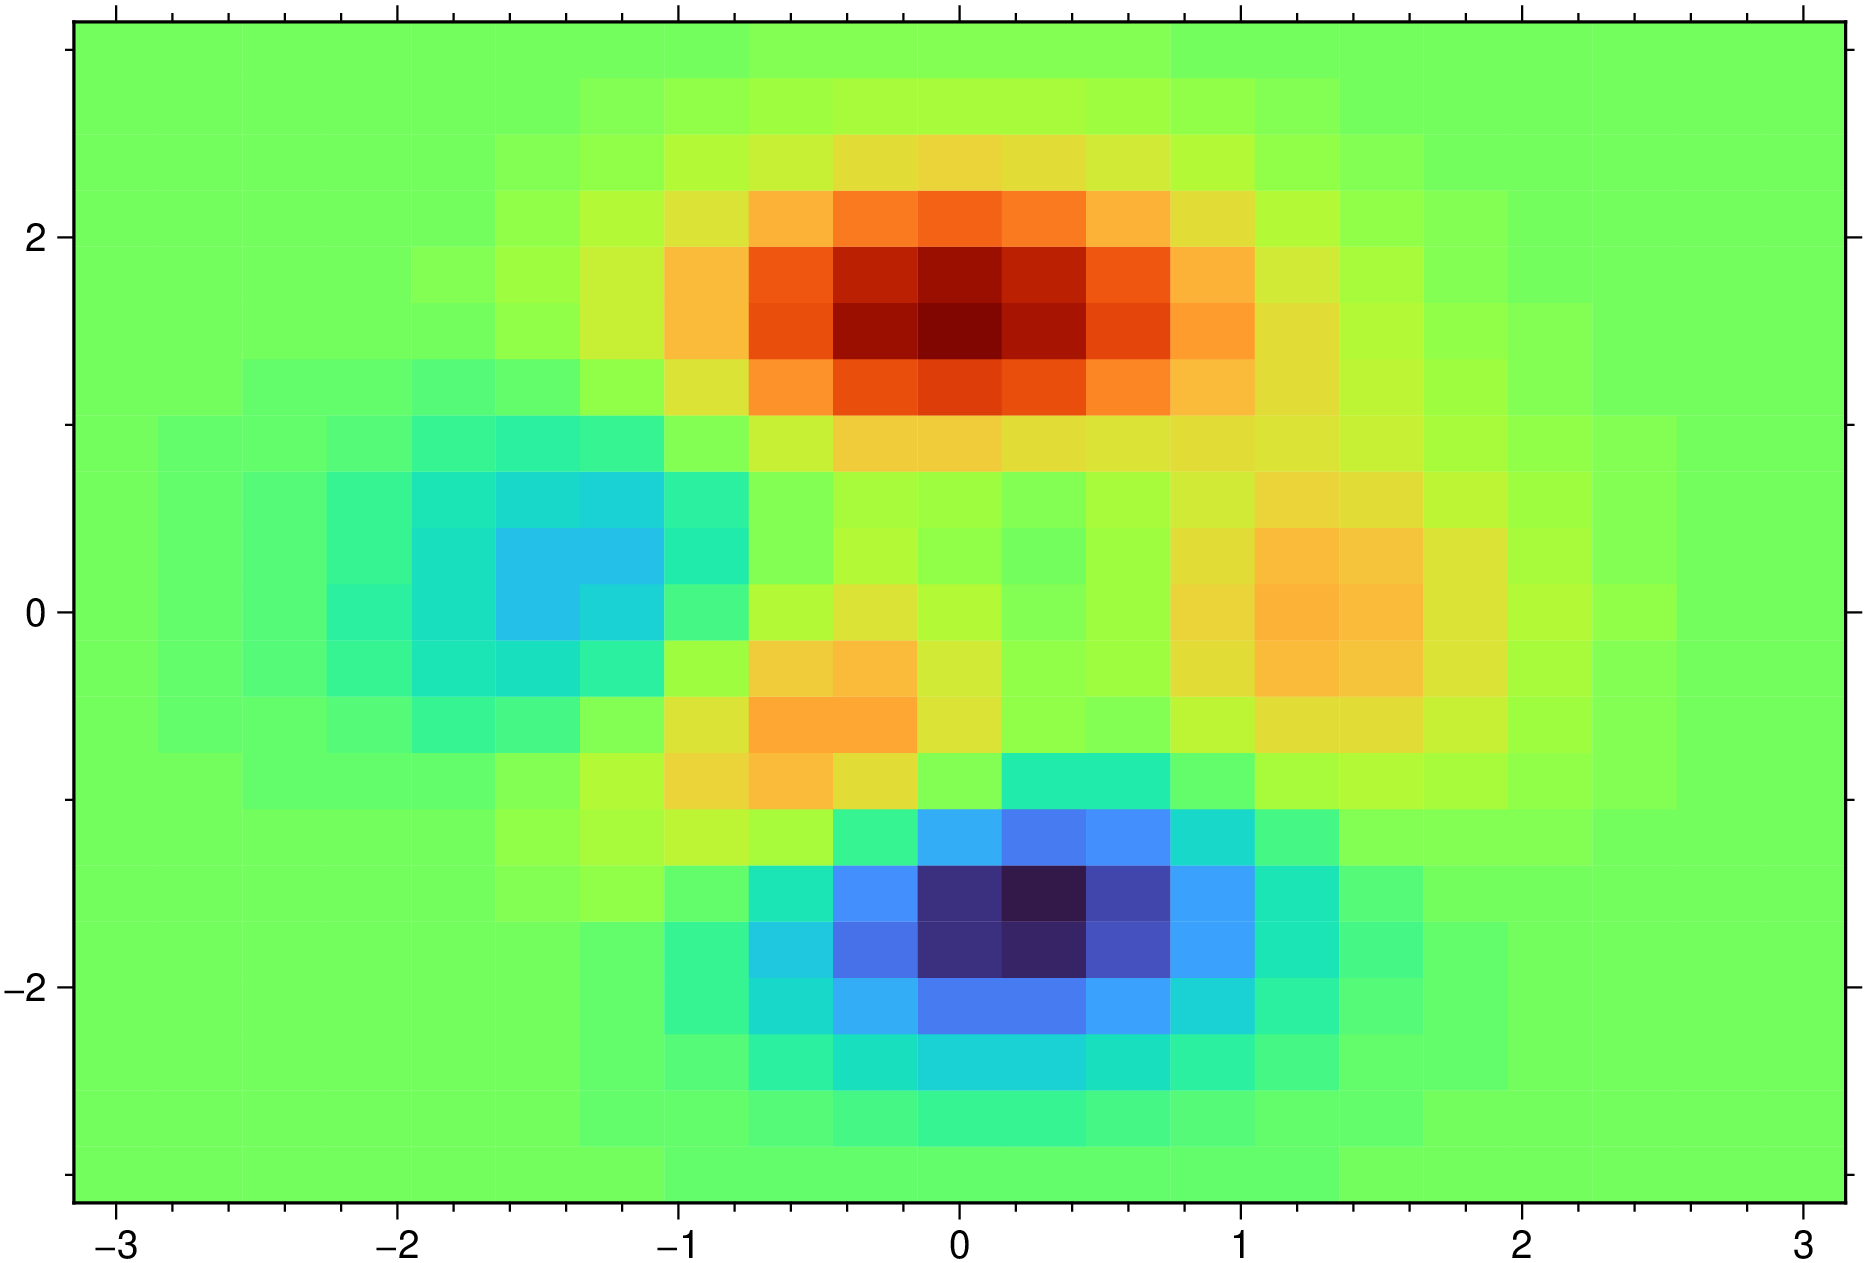
Add labels to cells using default settings (font size = 6p)
using GMT

pcolor(G.x, G.y, G.z, labels=:y, show=true)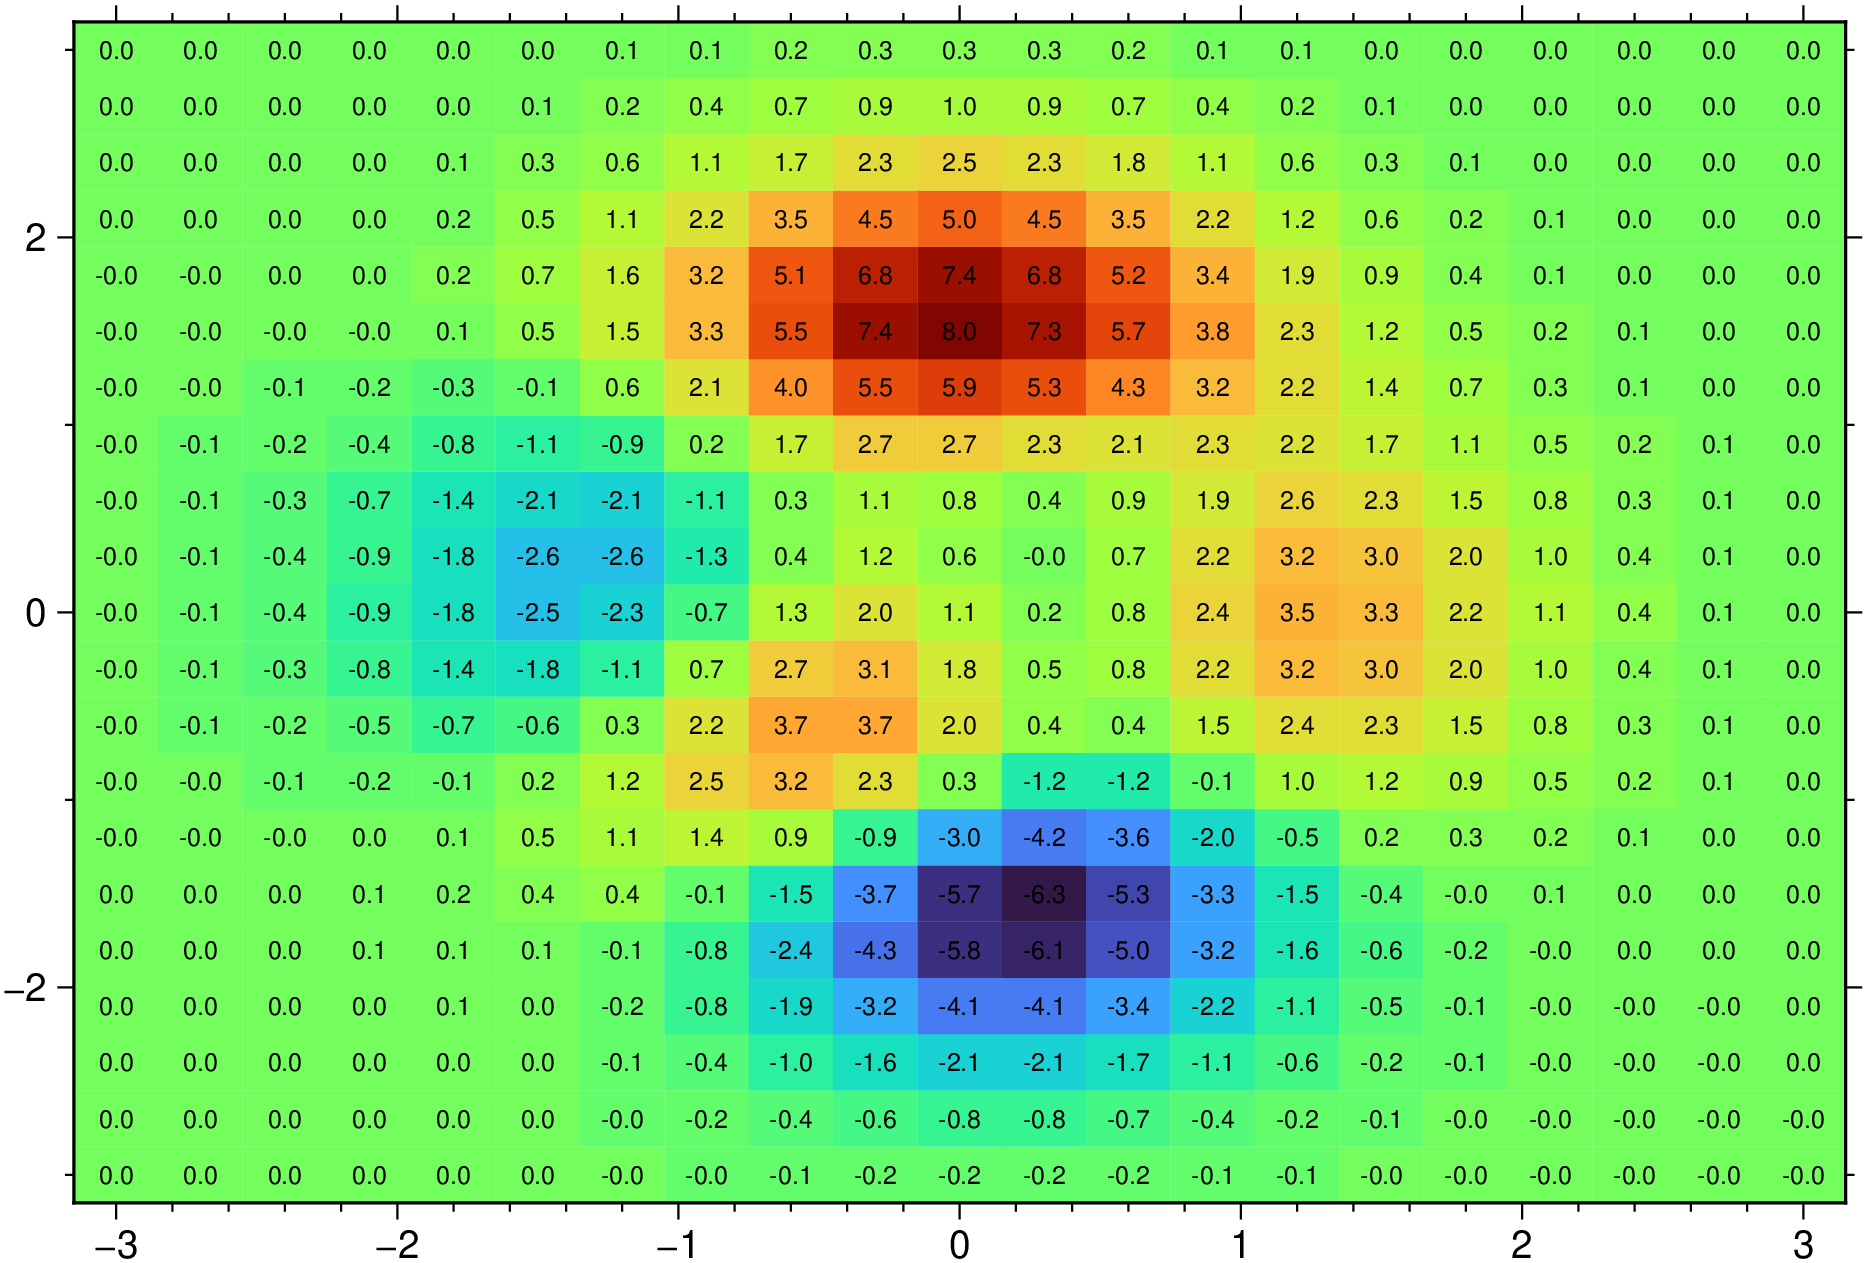
Similar to above but now set the number of decimlas in labels as well as it font settings
using GMT

pcolor(G.x, G.y, G.z, labels=2, font=(angle=45, font=(5,:red)), show=1)
Display a Pearson’s correlation matrix
using GMT

pcolor(GMT.cor(rand(4,4)), labels=:y, colorbar=1, show=true)
An irregular grid
using GMT

X,Y = GMT.meshgrid(-3:6/17:3);
XX = 2*X .* Y;  YY = X.^2 .- Y.^2;
pcolor(XX,YY, reshape(repeat([1:18; 18:-1:1], 9,1), size(XX)), lc=:black, show=true)
This function has multiple methods:
pcolor(cmd0::String; ...) - pcolor.jl:157pcolor(cmd0::String, arg1; first, kwargs...) - pcolor.jl:157pcolor(G::GMTgrid, first::Bool, d::Dict{Symbol, Any}) - pcolor.jl:192pcolor(D::GMTdataset; first, kwargs...) - pcolor.jl:169pcolor(; ...) - pcolor.jl:157pcolor(X_::Union{AbstractVector{<:Real}, Matrix{<:Real}}, Y_::Union{AbstractVector{<:Real}, Matrix{<:Real}}; ...) - pcolor.jl:79pcolor(X_::Union{AbstractVector{<:Real}, Matrix{<:Real}}, Y_::Union{AbstractVector{<:Real}, Matrix{<:Real}}, C::Union{Nothing, AbstractMatrix{<:Real}}; first, kwargs...) - pcolor.jl:79pcolor(X_::Union{AbstractVector{<:Real}, Matrix{<:Real}}, Y_::Union{AbstractVector{<:Real}, Matrix{<:Real}}, C::Union{Nothing, AbstractMatrix{<:Real}}, first::Bool, d) - pcolor.jl:82pcolor(arg1; kw...) - pcolor.jl:233