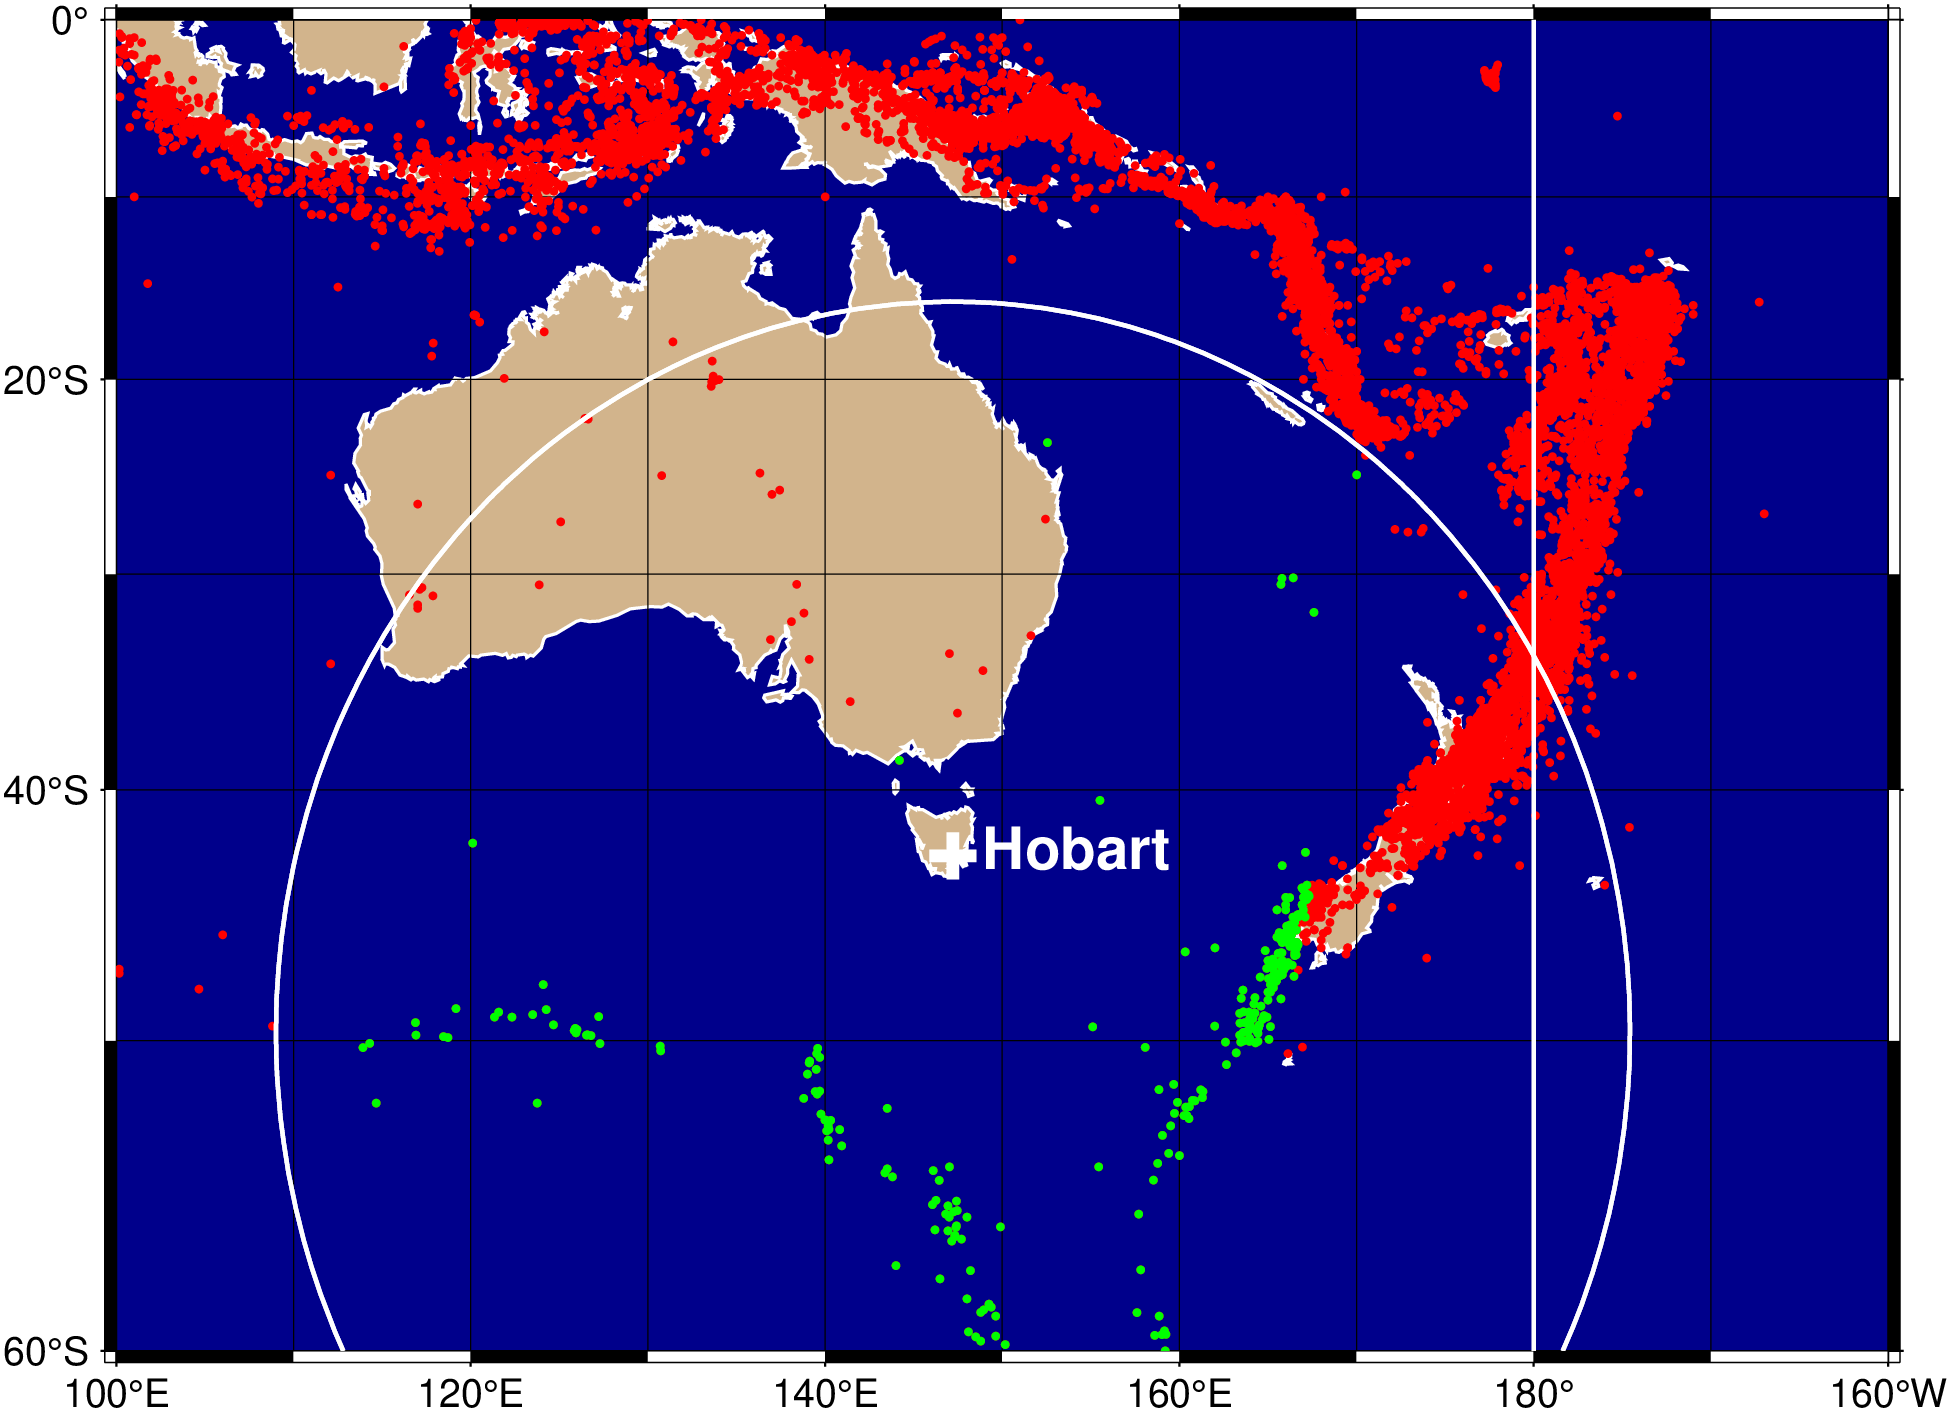
Although we are not seismologists, we have yet another example involving seismicity. We use seismicity data for the Australia/New Zealand region to demonstrate how we can extract subsets of data using geospatial criteria. In particular, we wish to plot the epicenters given in the remote file oz_quakes_24.txt as red or green circles. Green circles should only be used for epicenters that satisfy the following three criteria:
- They are located in the ocean and not on land

- They are within 3000 km of Hobart

- They are more than 1000 km away from the International Dateline
All remaining earthquakes should be plotted in red. Rather that doing the selection process twice we simply plot all quakes as red circles and then replot those that pass our criteria. Most of the work here is done by [gmtselect]; the rest is carried out by the usual [coast] and [plot] workhorses. Note for our purposes the Dateline is just a line along the 180 meridian.
The script produces the plot in Figure. Note that the horizontal distance from the dateline seems to increase as we go south; however that is just the projected distance (Mercator distortion) and not the actual distance which remains constant at 1000 km.