using GMT
GMT.resetGMT()  # hide

G = grdmath("-R0/360/2/4 -I6/0.1 X 4 MUL PI MUL 180 DIV COS Y 2 POW MUL");
grdcontour(G, proj=:polar, frame=(annot=30, axes=:Ns, fill=:honeydew),
           cont=2, smooth=4, par=(FORMAT_GEO_MAP="+ddd",), show=true)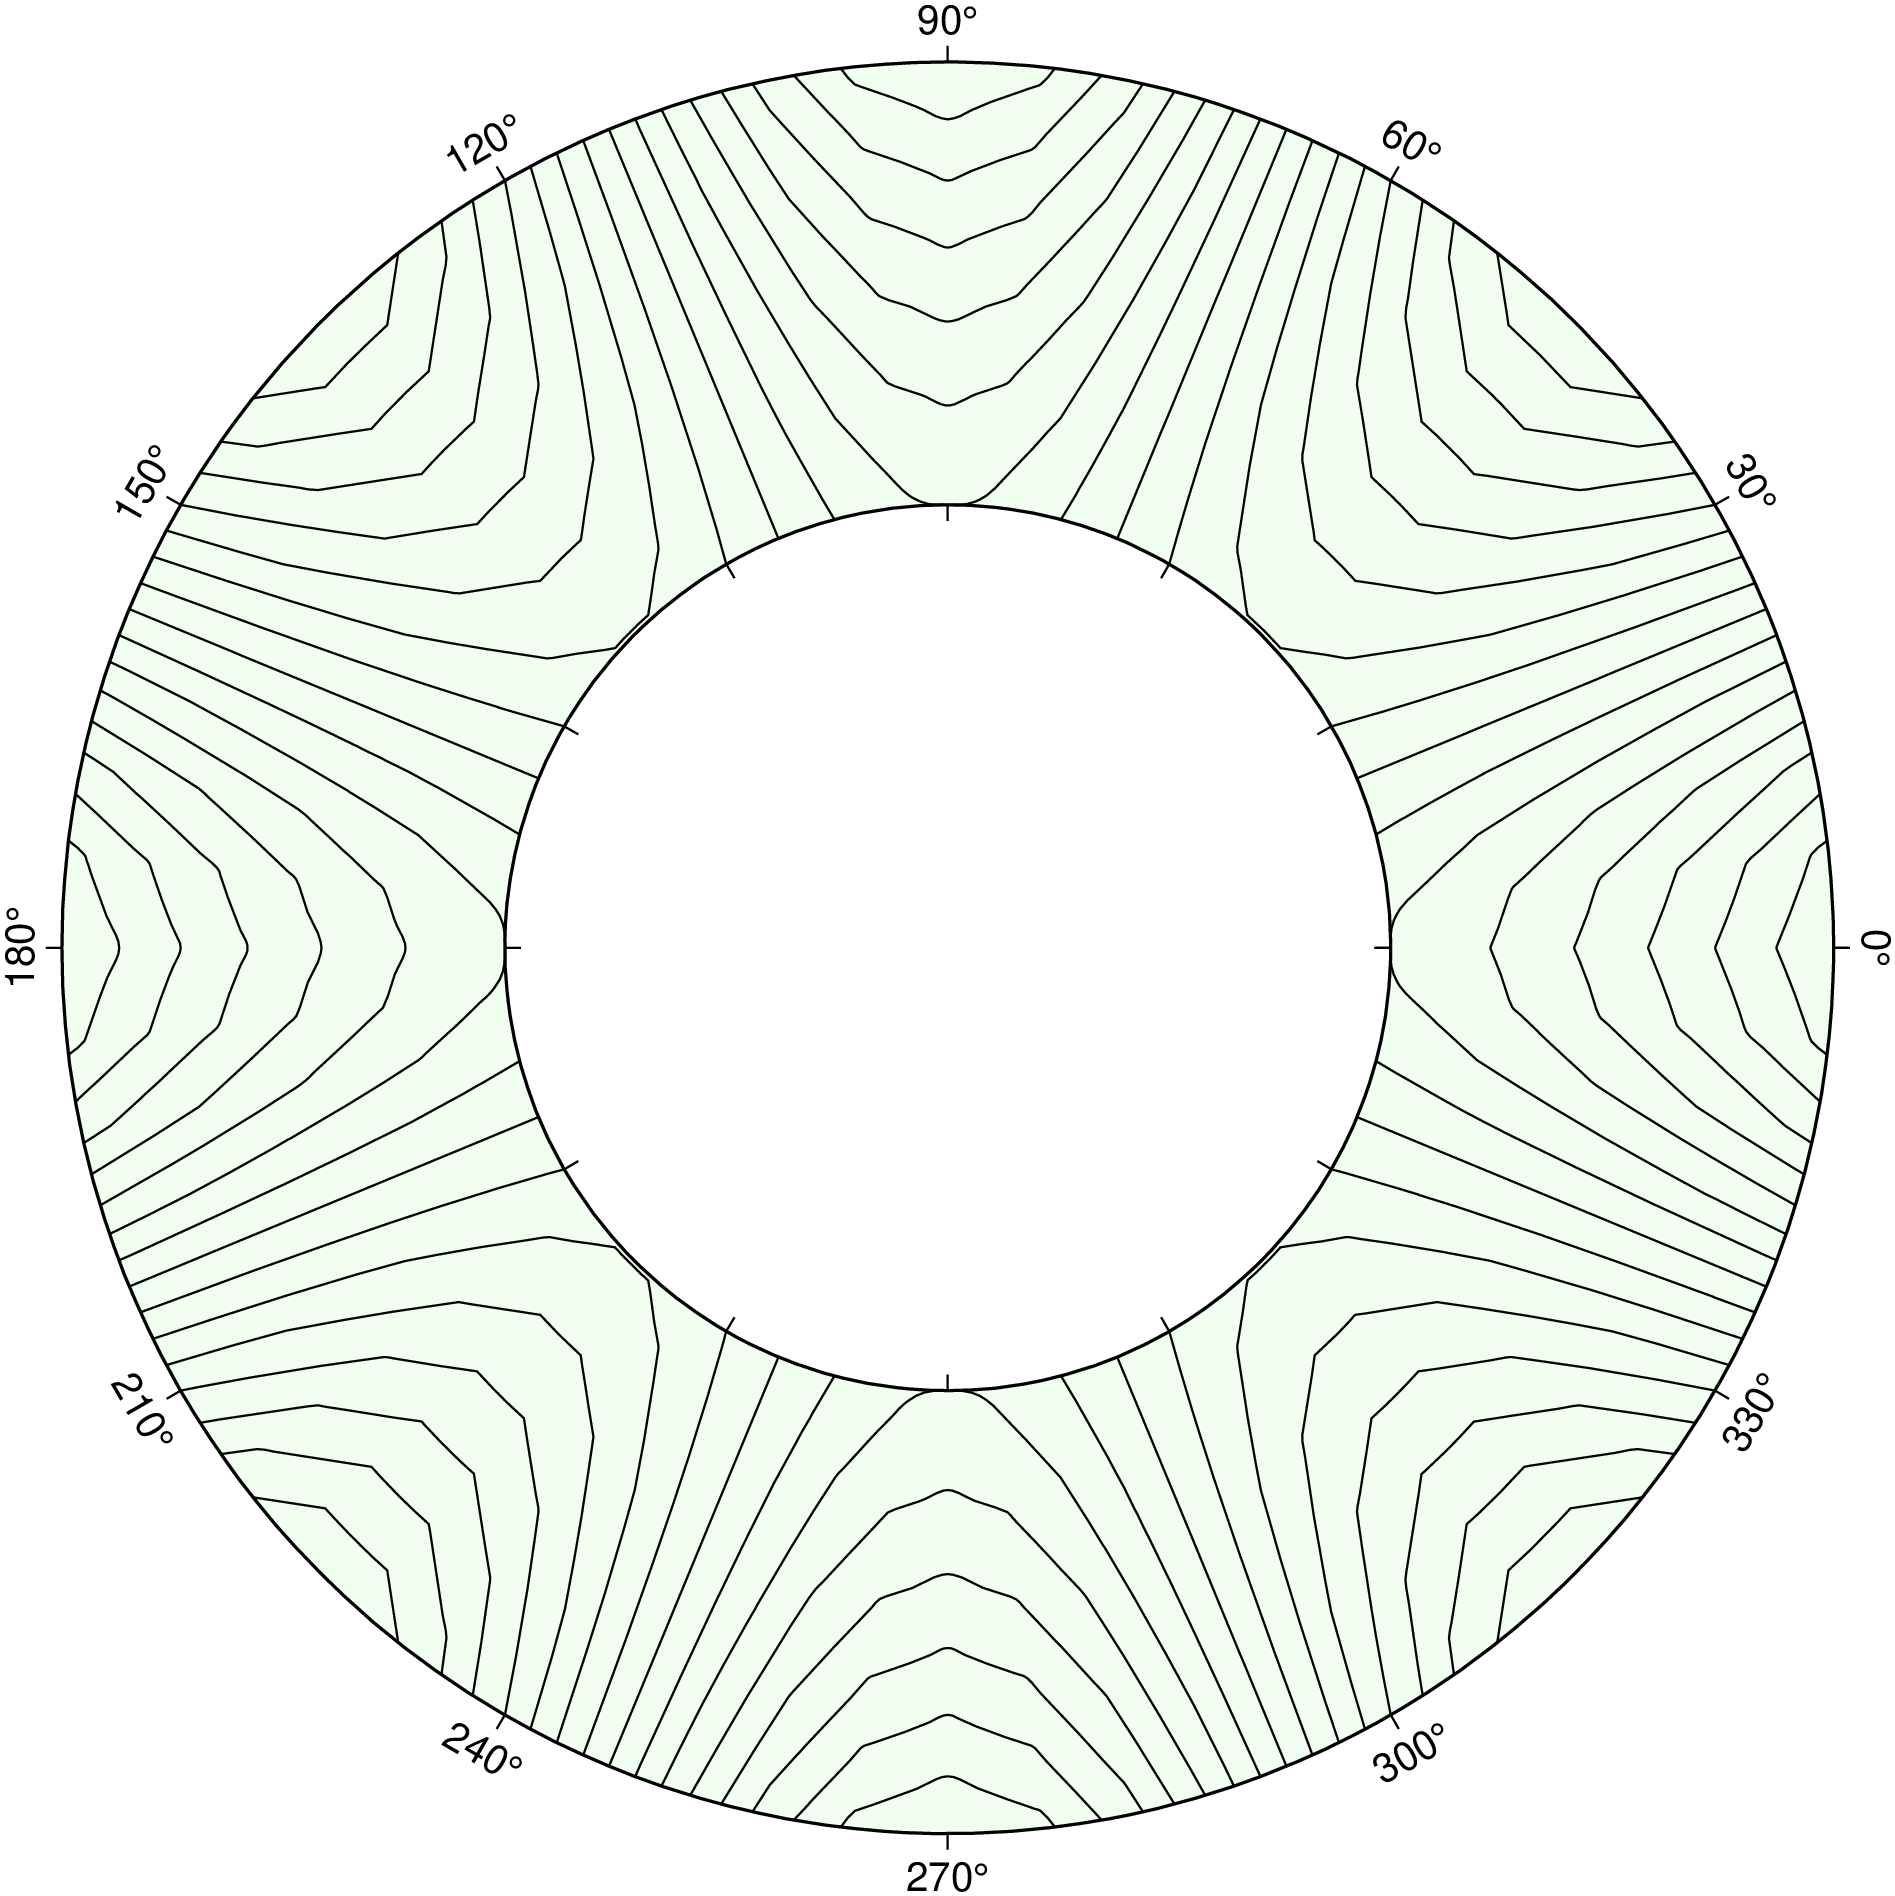
As an example of this projection we will create a gridded data set in polar coordinates using grdmath, a RPN calculator that operates on or creates grid files.
We will use grdcontour to make a contour map of this data. Because the data file only contains values with 2 =< r <= 4, a donut shaped plot appears in the example figure shown below.
using GMT
GMT.resetGMT() # hide
G = grdmath("-R0/360/2/4 -I6/0.1 X 4 MUL PI MUL 180 DIV COS Y 2 POW MUL");
grdcontour(G, proj=:polar, frame=(annot=30, axes=:Ns, fill=:honeydew),
cont=2, smooth=4, par=(FORMAT_GEO_MAP="+ddd",), show=true)