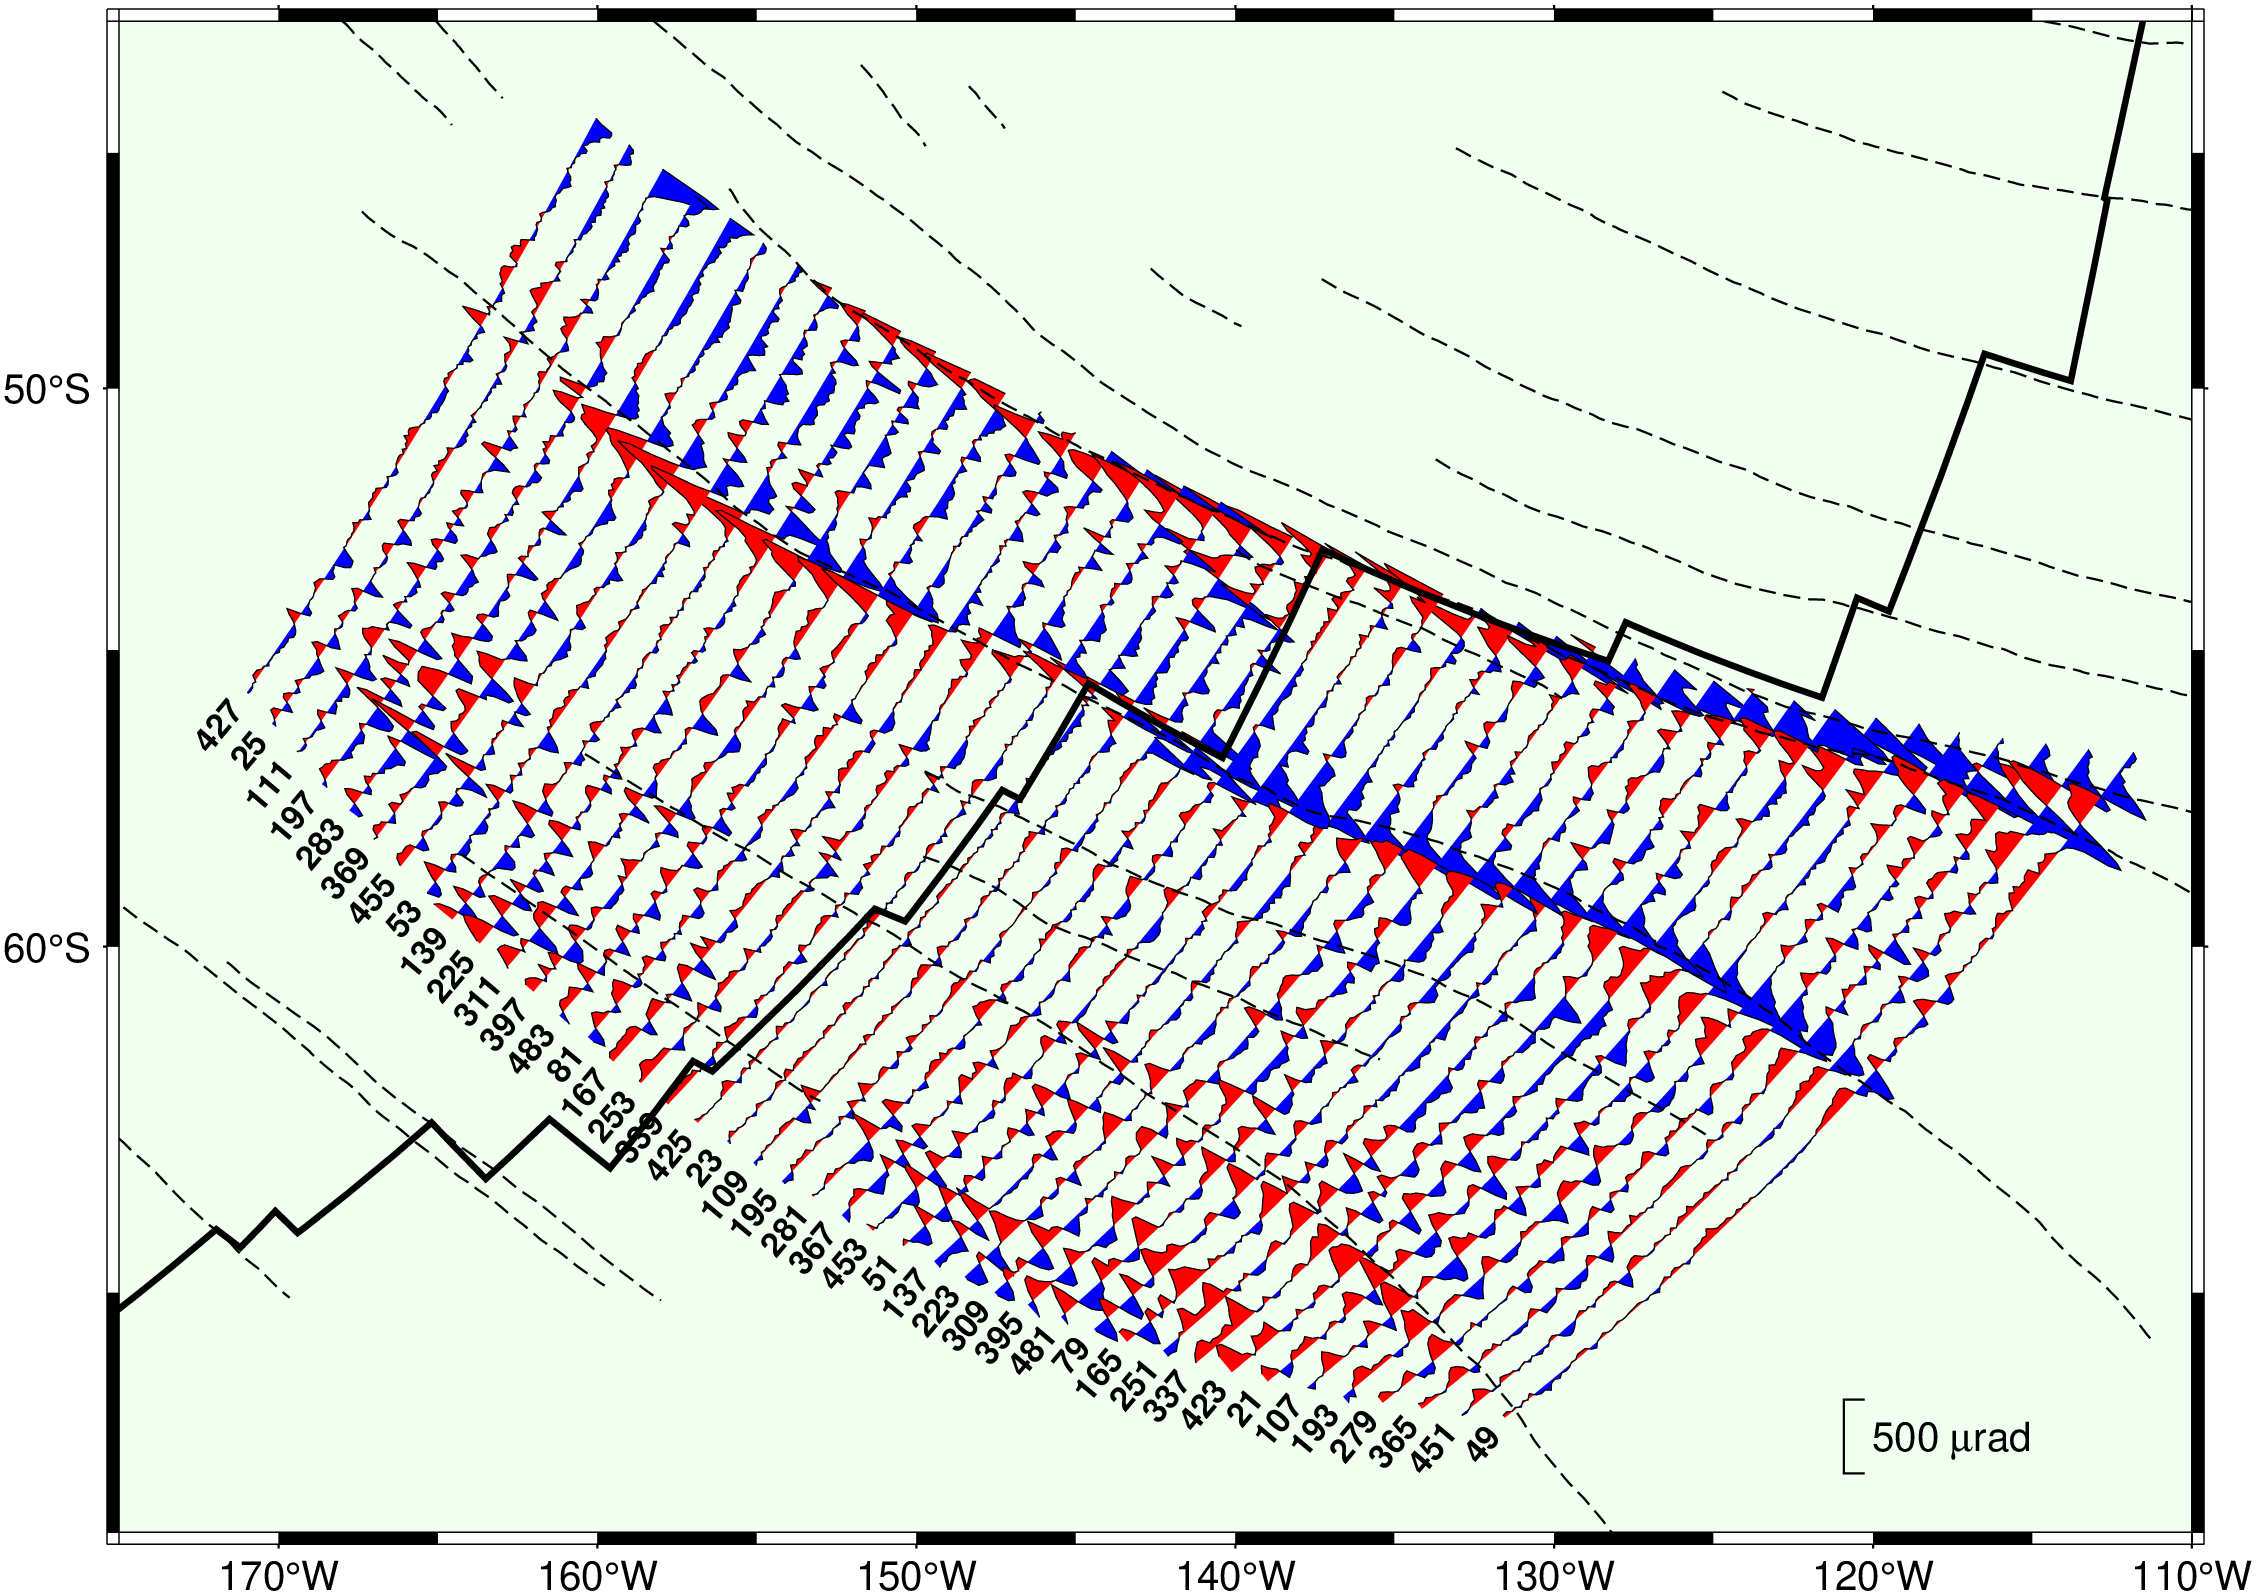
A common application in many scientific disciplines involves plotting one or several time-series as as “wiggles” along tracks. Marine geophysicists often display magnetic anomalies in this manner, and seismologists use the technique when plotting individual seismic traces. In our example we will show how a set of Geosat sea surface slope profiles from the south Pacific can be plotted as “wiggles” using the [wiggle] program. We will embellish the plot with track numbers, the location of the Pacific-Antarctic Ridge, recognized fracture zones in the area, and a “wiggle” scale. The Geosat tracks are stored in the file tracks_09.txt, the ridge in ridge_09.txt, and all the fracture zones are stored in the multiple segment file fz_09.txt. The profile id is contained in the segment headers and we wish to use the last data point in each of the track segments to construct an input file for text that will label each profile with the track number. We know the profiles trend approximately N40E so we want the labels to have that same orientation (i.e., the angle with the baseline must be 50). We do this by extracting the last record from each track and select segment header as textstring when running the output through text. Note we offset the text positions in order to have a small gap between the profile and the label:
usingGMTwiggle("@tracks_09.txt", limits=(185,250,-68,-42), proj=:Mercator, figscale=0.27, frame=(axes=:WSne, annot=10, ticks=5, fill=[240255240]), G="+red -G-blue", D="jBR+w500+l@~m@~rad+o0.5", ampscale=800, pen=:thinnest, par=(:FORMAT_GEO_MAP,:dddF))plot!("@ridge_09.txt", pen=:thicker)plot!("@fz_09.txt", pen="thinner,-")# Take label from segment header and plot near coordinates of last record of each trackt =gmtconvert("@tracks_09.txt", E=:l)for k =1:length(t) t[k].text = [t[k].header] endtext!(t, font=(8,"Helvetica-Bold"), angle=50, justify=:RM, header=true, offset=(-0.1,-0.1), show=true)