using GMT
resetGMT() # hide
makecpt(cmap=:rainbow, range=(-5000,-2000))
G = grdcut("@earth_relief_01m", region=(-118,-107,-49,-42))
grdimage(G, shade=(angle=15, norm="e0.75"), proj=:merc)
#resetGMT() # Need to find a fix for this. It lets the API in a geog mode
# Select two points along the ridge
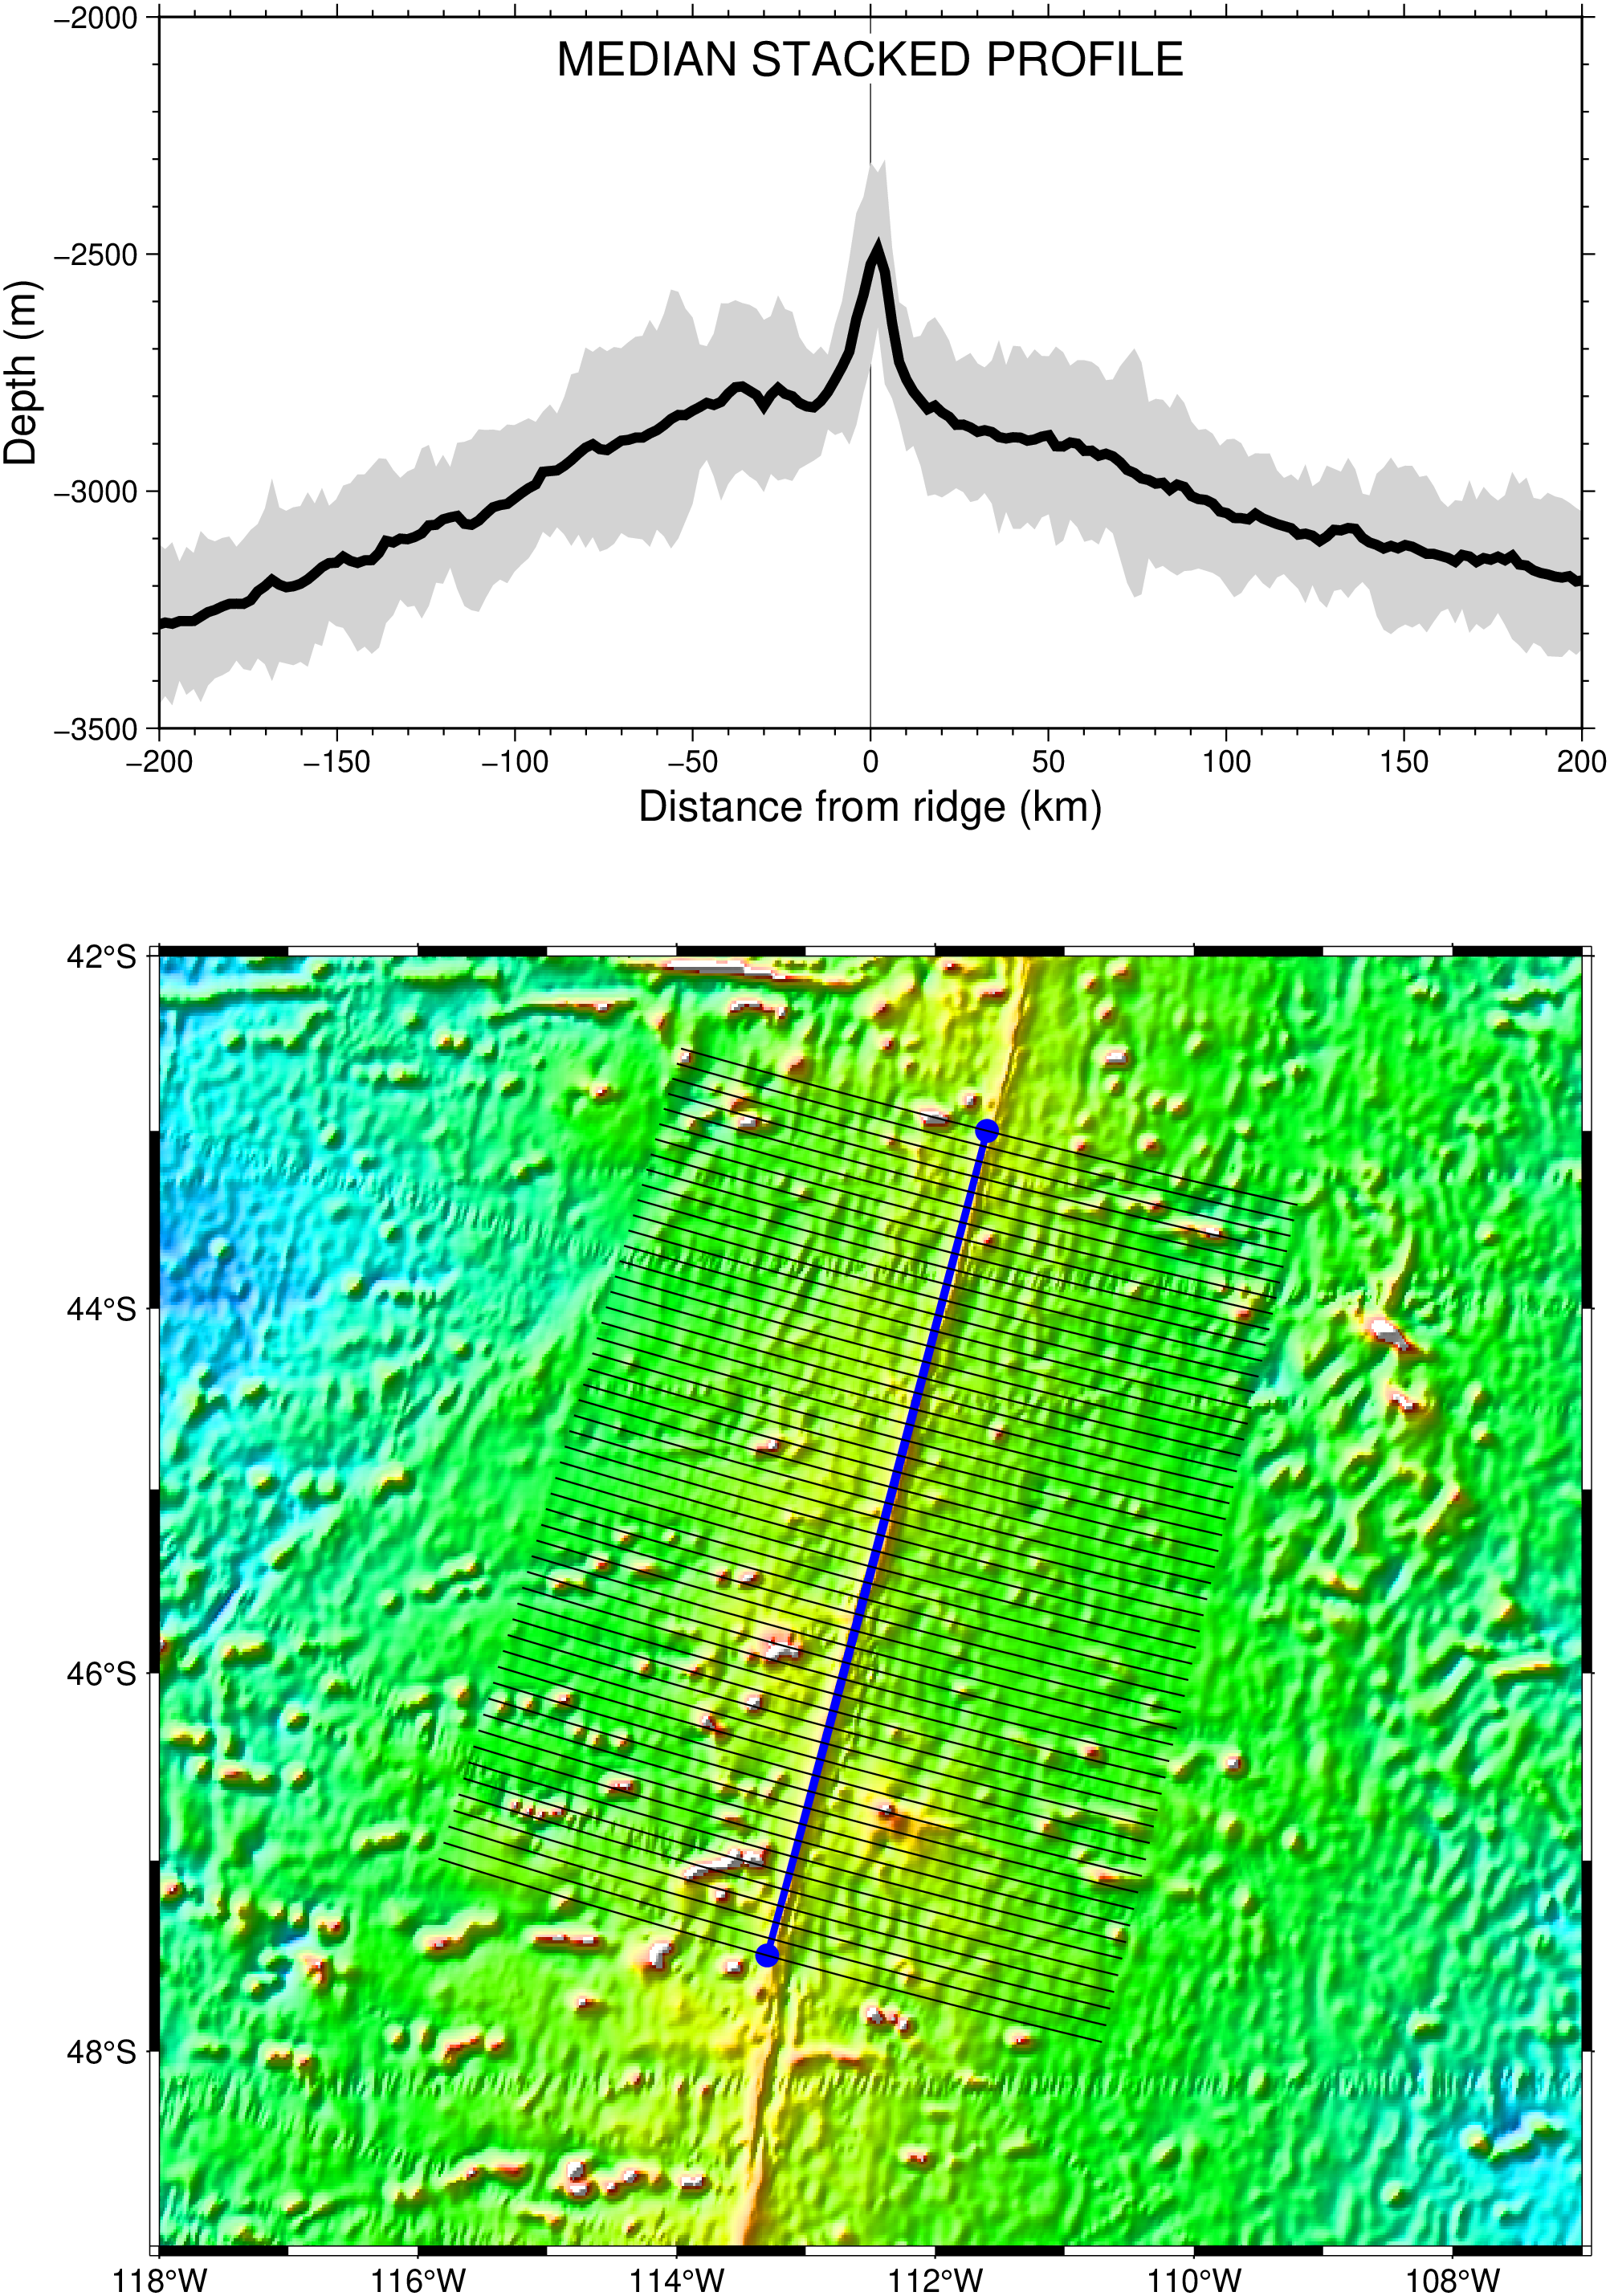
ridge_pts = [-111.6 -43.0; -113.3 -47.5];
# Plot ridge segment and end points
plot!(ridge_pts, region=G, symbol=(symb=:circle, size=0.25), fill=:blue, pen=(2,:blue))
# Generate cross-profiles 400 km long, spaced 10 km, samped every 2km
# and stack these using the median, write stacked profile
table, stack = grdtrack(G, ridge_pts, equidistant="400k/2k/10k+v", stack="m+s")
plot!(table, pen=0.5)
# Show upper/lower values encountered as an envelope
plot!(stack[:,[1,2,6,7]], region=(-200,200,-3500,-2000), frame=(axes=:WSne, annot=:auto, ticks=:auto),
xaxis=(grid=1000, label="Distance from ridge (km)"), ylabel="Depth (m)",
figsize=(15,7.5), fill=:lightgray, close=(envelope=true,), yshift=16)
plot!(stack, pen=3)
text!(mat2ds([0 -2000], "MEDIAN STACKED PROFILE"), fill=:white, font=14, justify=:TC,
offset=(away=true, shift=0.25), show=true)