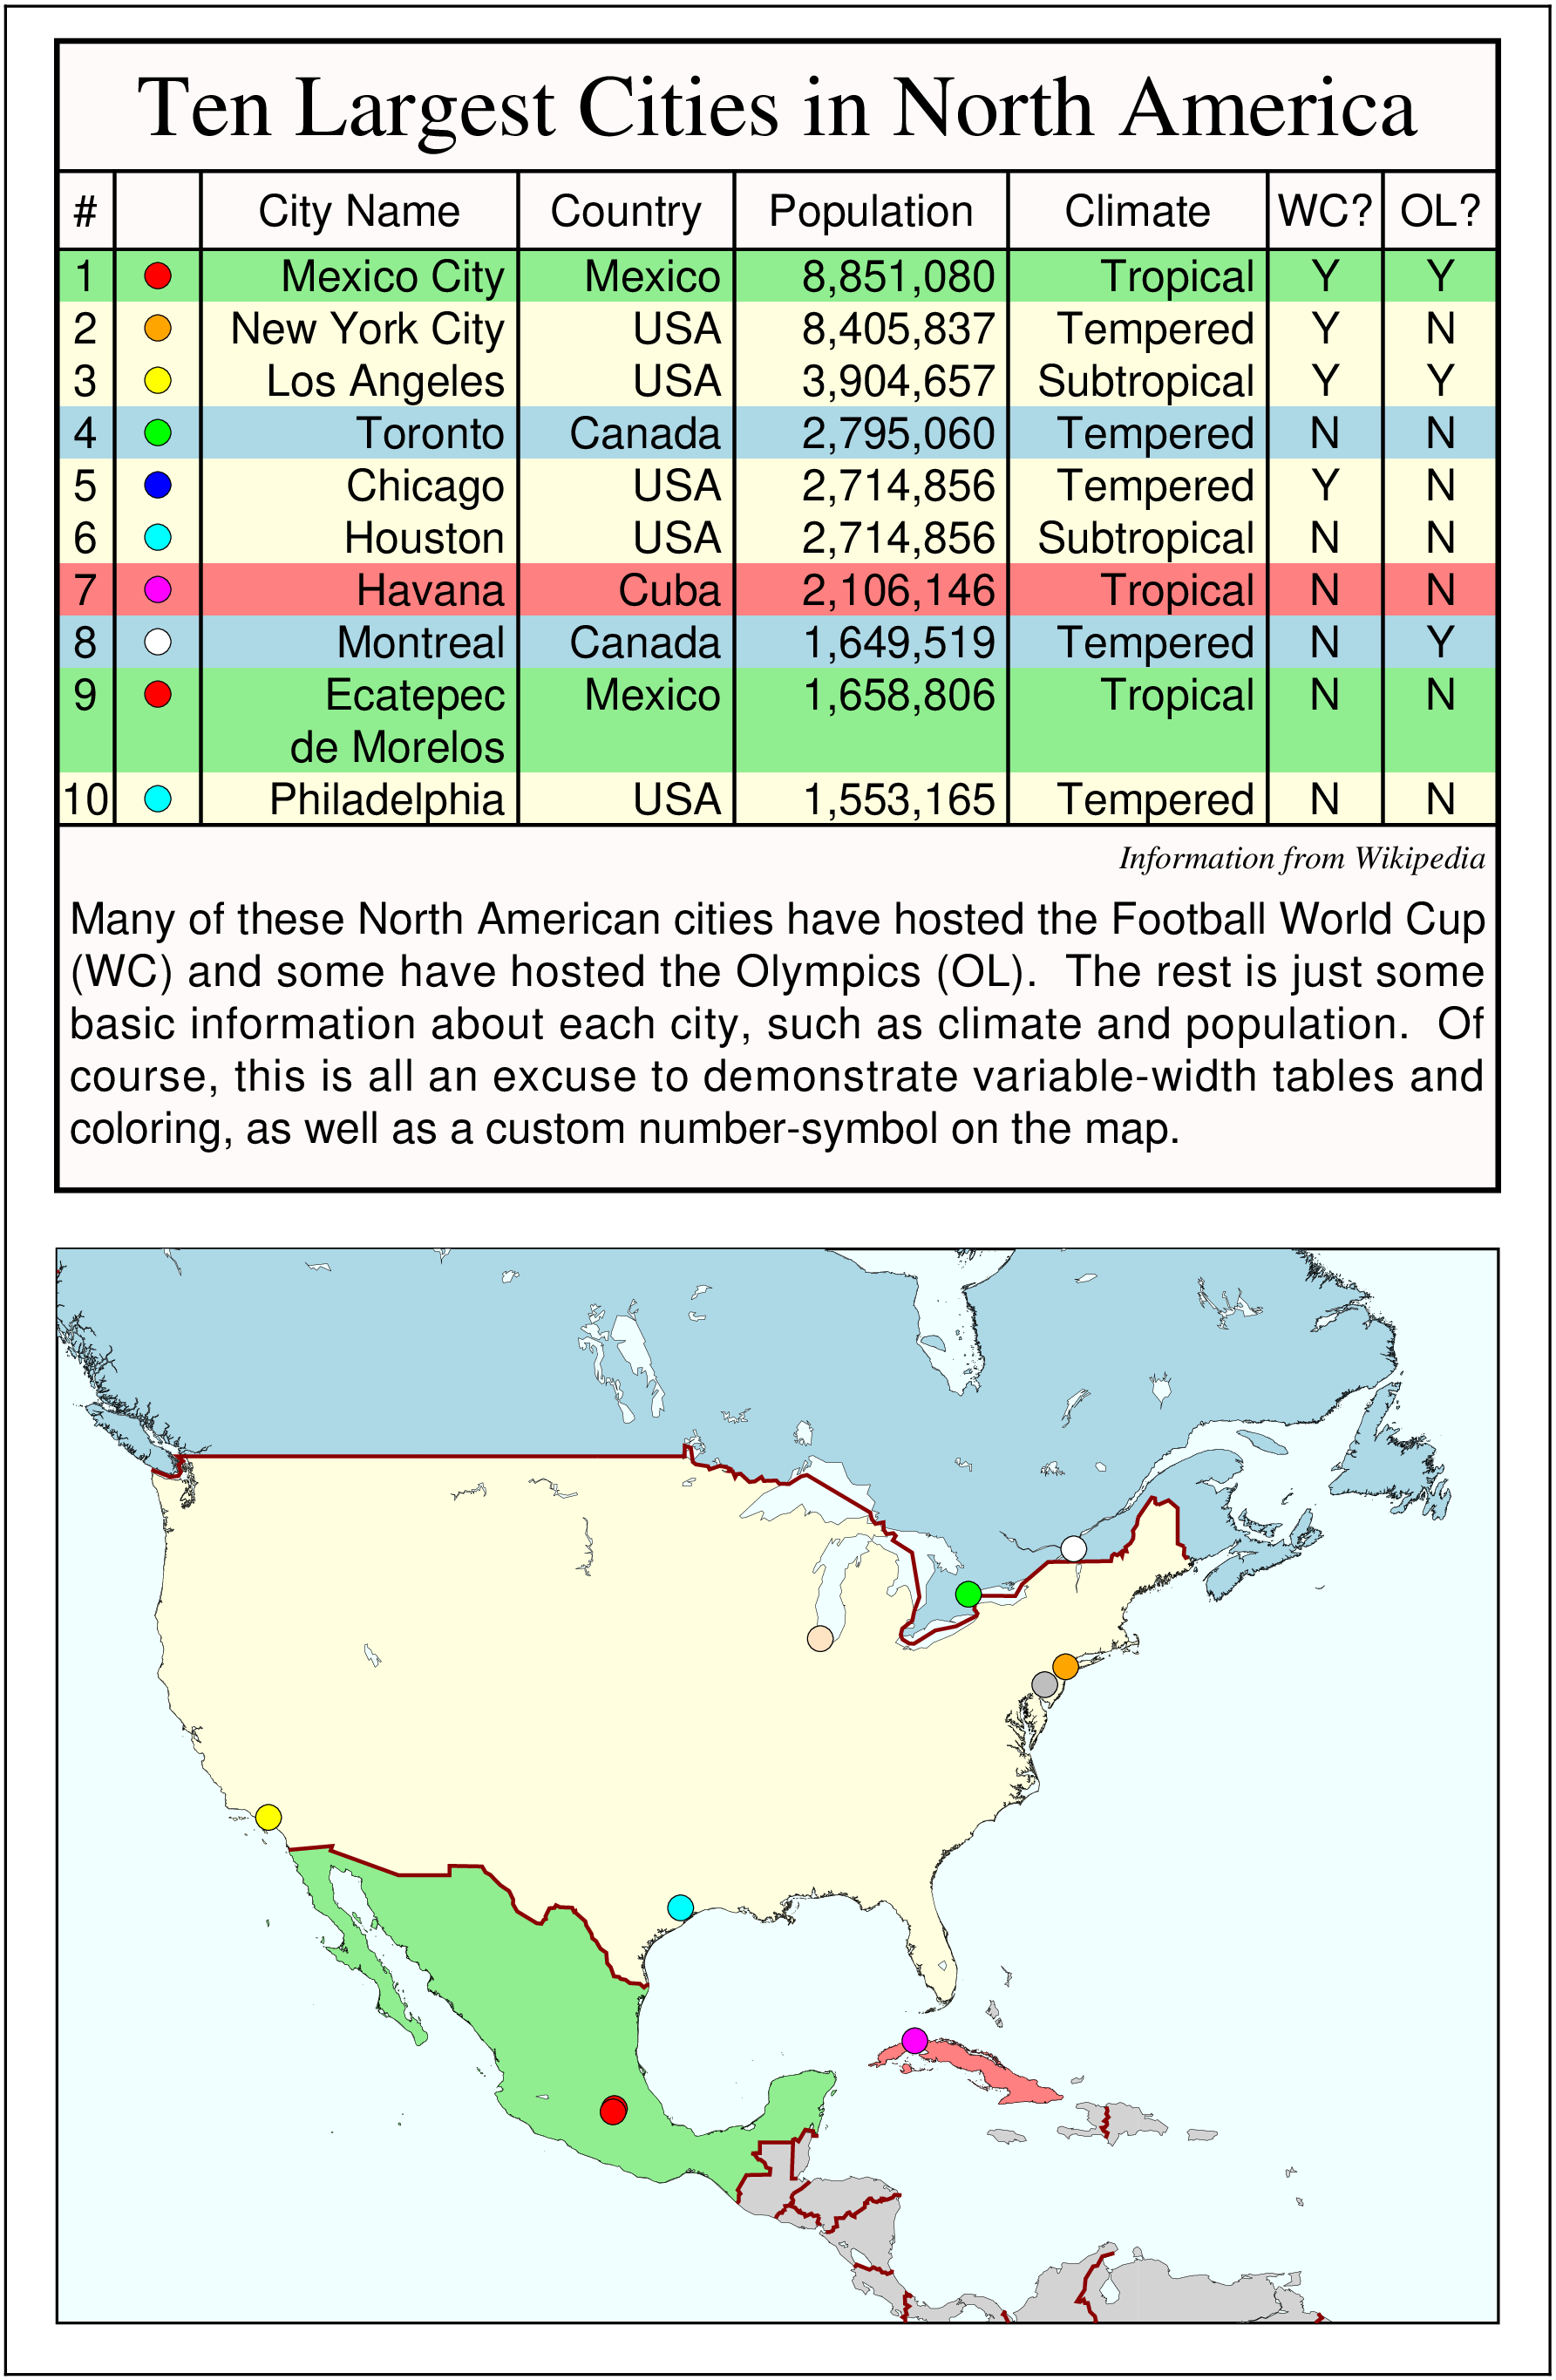
using GMT
resetGMT() # hide

C = makecpt(color="red,orange,yellow,green,bisque,cyan,magenta,white,gray", range=(1,10,1))
coast(region="130W/50W/8N/56N", proj=:Mercator, figsize=14, frame=:noannot,
      land=:lightgray, water=:azure1, area=1000, shore=:faint, yshift=3,
      par=(:MAP_FRAME_TYPE, :plain))
coast!(DCW=((country="US", pen=:faint, fill=:lightyellow), (country="CU", pen=:faint, fill=:lightred),
       (country="MX", pen=:faint, fill=:lightgreen), (country="CA", pen=:faint, fill=:lightblue)) )
coast!(borders=(type=1, pen=(1,:darkred)), area="1000/2/2", shore=:faint, river_fill=:azure1)
plot!("@data_41.txt", marker="k@symbol_41", ms=0.25, C=C, ml=0.25, yx=true)
legend!("@table_41.txt", region=(0,15,0,23), pos=(paper=true, anchor=(7.5,11.5), width=14, justify=:BC,
        spacing=1.2), clearance=0.12, box=(pen=true, fill=:snow1), proj=:linear, figscale=1,
        xshift=-0.5, yshift=-0.5, par=(FONT_ANNOT_PRIMARY=12, FONT_LABEL=12), frame=:bare, show=true)