using GMT
seismicity()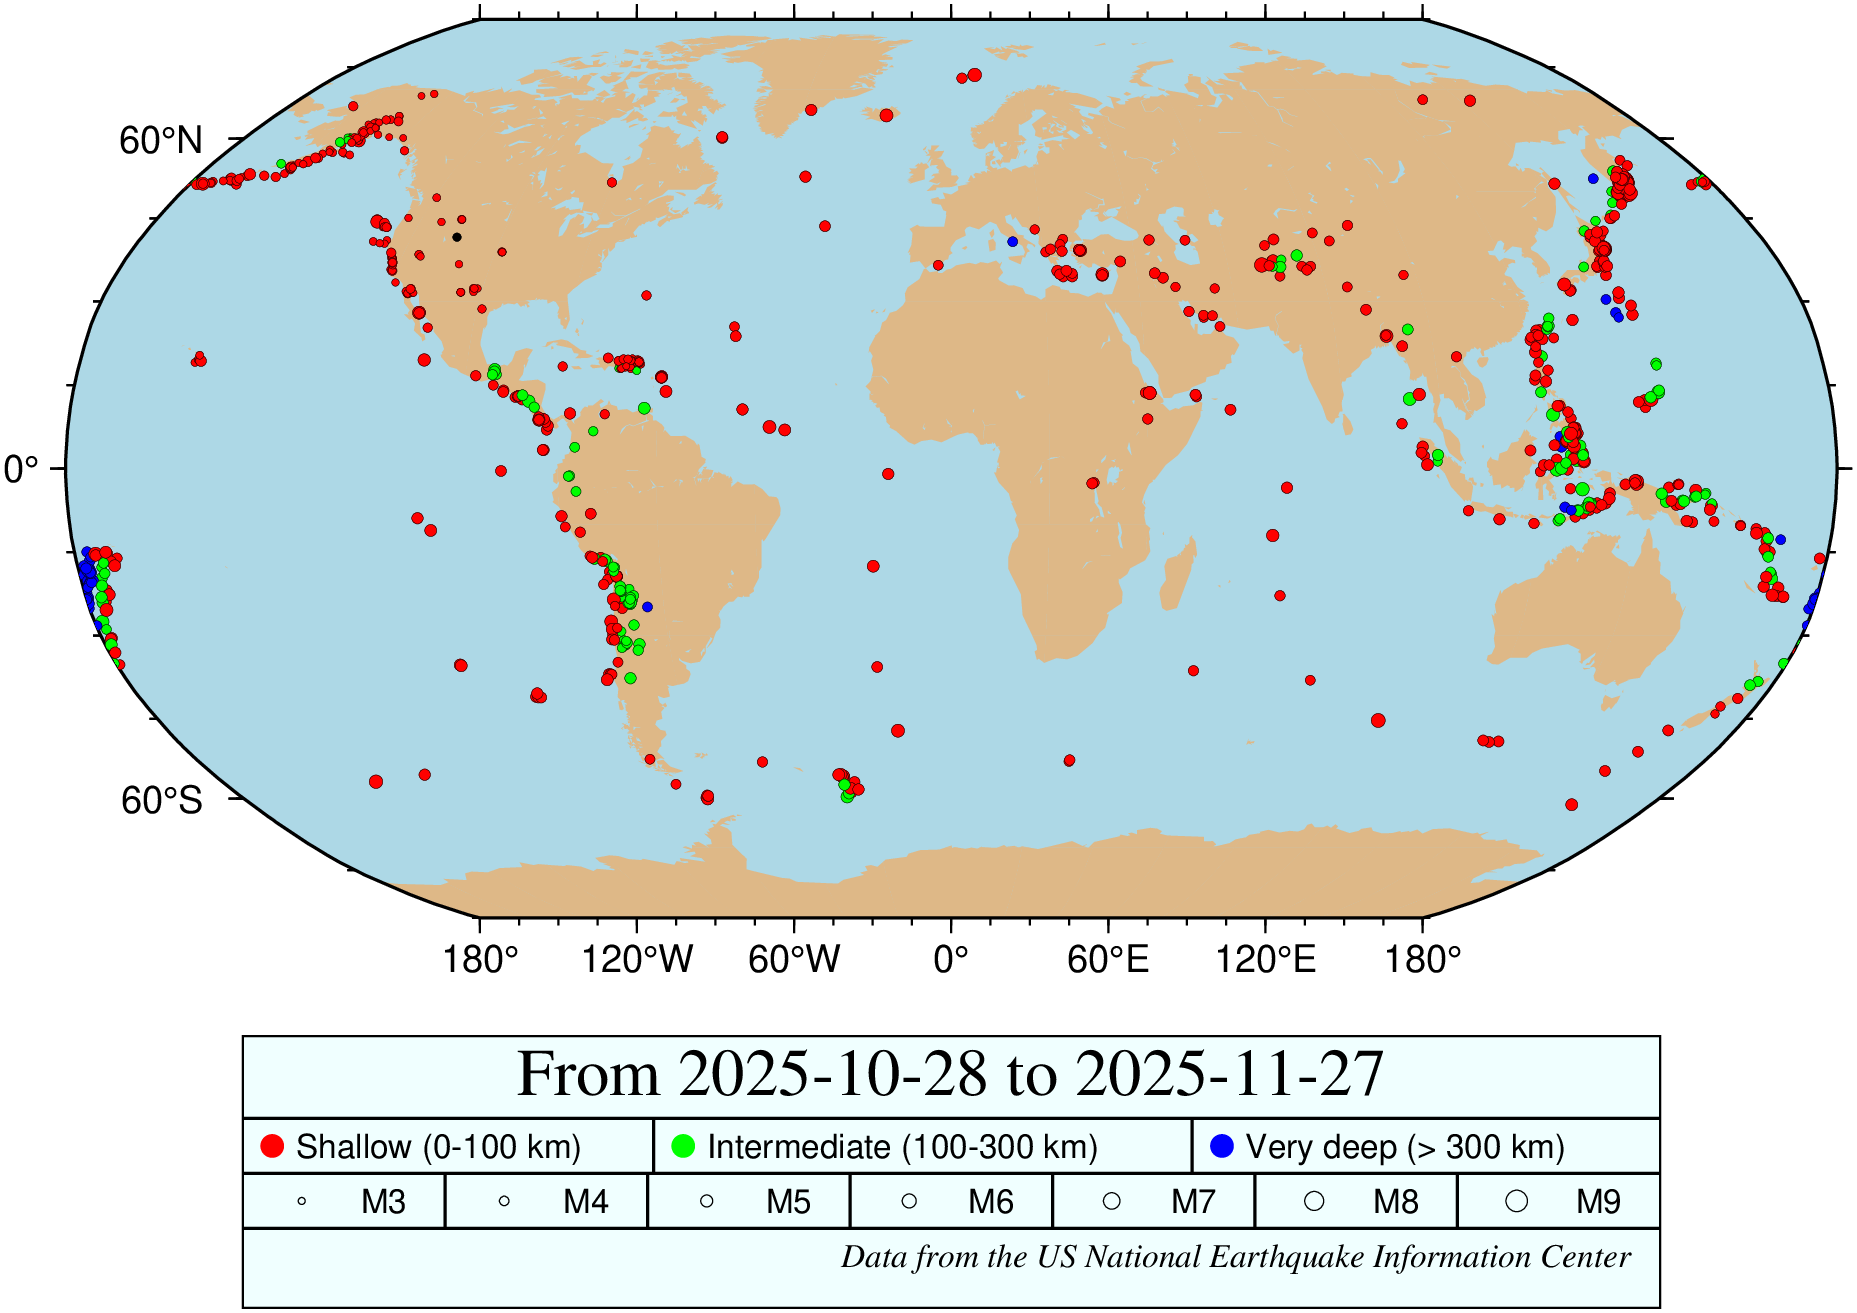
seismicity(starttime="", endtime="", minmagnitude=3, mindepth=0, maxdepth=0, last=0, printurl=false, show=true, kw...)Make automatic maps of the world-wide seismicity obtained from USGS Earthquake Hazards Program in Julia using GMT.
This module is a mix of plot, coast and legend functionalities. So not all (fine) controlling plotting parameters are listed here. For the finest control, user should consult the manuals of those modules.
B or axes or frame
Set map boundary frame and axes attributes. Default is to draw and annotate left, bottom and vertical axes and just draw left and top axes. More at frame
J or proj or projection : – proj=
Select map projection. More at proj
R or region or limits : – limits=(xmin, xmax, ymin, ymax) | limits=(BB=(xmin, xmax, ymin, ymax),) | limits=(LLUR=(xmin, xmax, ymin, ymax),units=“unit”) | …more
Specify the region of interest. More at limits. For perspective view view, optionally add zmin,zmax. This option may be used to indicate the range used for the 3-D axes. You may ask for a larger w/e/s/n region to have more room between the image and the axes.
G or markerfacecolor or MarkerFaceColor or markercolor or mc or fill
Select color or pattern for filling of symbols [Default is no fill]. Note that plot will search for fill and pen settings in all the segment headers (when passing a GMTdaset or file of a multi-segment dataset) and let any values thus found over-ride the command line settings (but those must be provided in the terse GMT syntax). See Setting color for extend color selection (including color map generation).
starttime: Limit to events on or after the specified start time. NOTE: All times use ISO8601 Date/Time format OR a DateTime type. Default is NOW - 30 days.
endtime: Limit to events on or before the specified end time. Same remarks as for starttime. Default is present time.
minmagnitude: Limit to events with a magnitude larger than the specified minimum.
mindepth: Limit to events with depth more than the specified minimum (km positive down).
maxdepth: Limit to events with depth less than the specified maximum (km positive down).
last: If value is an integer (e.g. last=90), select the events in the last n days. If it is a string than we expect that it ends with a ‘w’(eek), ‘m’(onth) or ‘y’(ear). Example: last="2Y" (period code is caseless)
printurl: Print the url of the requested data.
circle: A 3 elements Tuple or Array with lon,lat,radius, where radius is in km, to perform a circle search.
data: The default is to make a seismicity map but if the data option is used (containing whatever) we return the data in a GMTdataset
figname: Save the figure with the figname=name.ext where ext chooses the figure format (e.g. figname="name.png")
land: By default we paint the continents with the “burlywood” color. Like in the coast module, use land=“othercolor” to replace it.
layers: By default we divide depth into three layers; 1-100, 100-300 and > 300 km, Use layers=4 to subdivide top layer into 0-50 and 50-100 km.
legend: By default we plot a legend. Particular options for the legend command (e.g. pos, box, etc) are passed via the kw... options. Use legend=false to have no legend.
ocean: By default we paint the oceans with the “lightblue” color. Use ocean=“othercolor” to replace it.
region: The region of interest. By default it is [-180 180 -90 90] but one may pass a sub-region like all other modules that accept this option (e.g. coast)
proj: By default we select an appropriate projection based on the region extents, but that may be overridden by specifying a proj=xxx like, for example, in coast.
size: Can be a scalar to plot all events with same size. This size is expected to be in cm but > 1 it is interpreted to be in points.
size=[min_sz max_sz] will scale linearly min/max magnitude to have sizes min_sz/max_szsize=([min_sz max_sz], [min_mag max_mag]) will scale linearly min_mag/max_mag magnitude to have sizes min_sz/max_szsize=(fun, [min_sz max_sz] [, [min_mag max_mag]]) does the same as above but the transformation is determined by the function fun. Possibles functions are exp10, exp, pow and sqrt. In the pow case we must pass in also the exponent and the syntax is: size=((pow,2), [min_sz max_sz]) to have a square scaling.show: By default this function shows the plot (when no data option). Use show=false to prevent that (and leave the figure open to accept more plots from posterior commands.)
U or time_stamp : – time_stamp=true | time_stamp=(just=“code”, pos=(dx,dy), label=“label”, com=true)
Draw GMT time stamp logo on plot. More at timestamp
V or verbose : – verbose=true | verbose=level
Select verbosity level. More at verbose
X or xshift or x_offset : xshift=true | xshift=x-shift | xshift=(shift=x-shift, mov=“a|c|f|r”)
Shift plot origin. More at xshift
Y or yshift or y_offset : yshift=true | yshift=y-shift | yshift=(shift=y-shift, mov=“a|c|f|r”)
Shift plot origin. More at yshift
figname or savefig or name : – figname=name.png
Save the figure with the figname=name.ext where ext chooses the figure image format.
Make a map of the global seismicity of last 30 days..
using GMT
seismicity()
View the source code for this function.