using GMT
scatter(1:10,rand(10), fill=:red, show=true)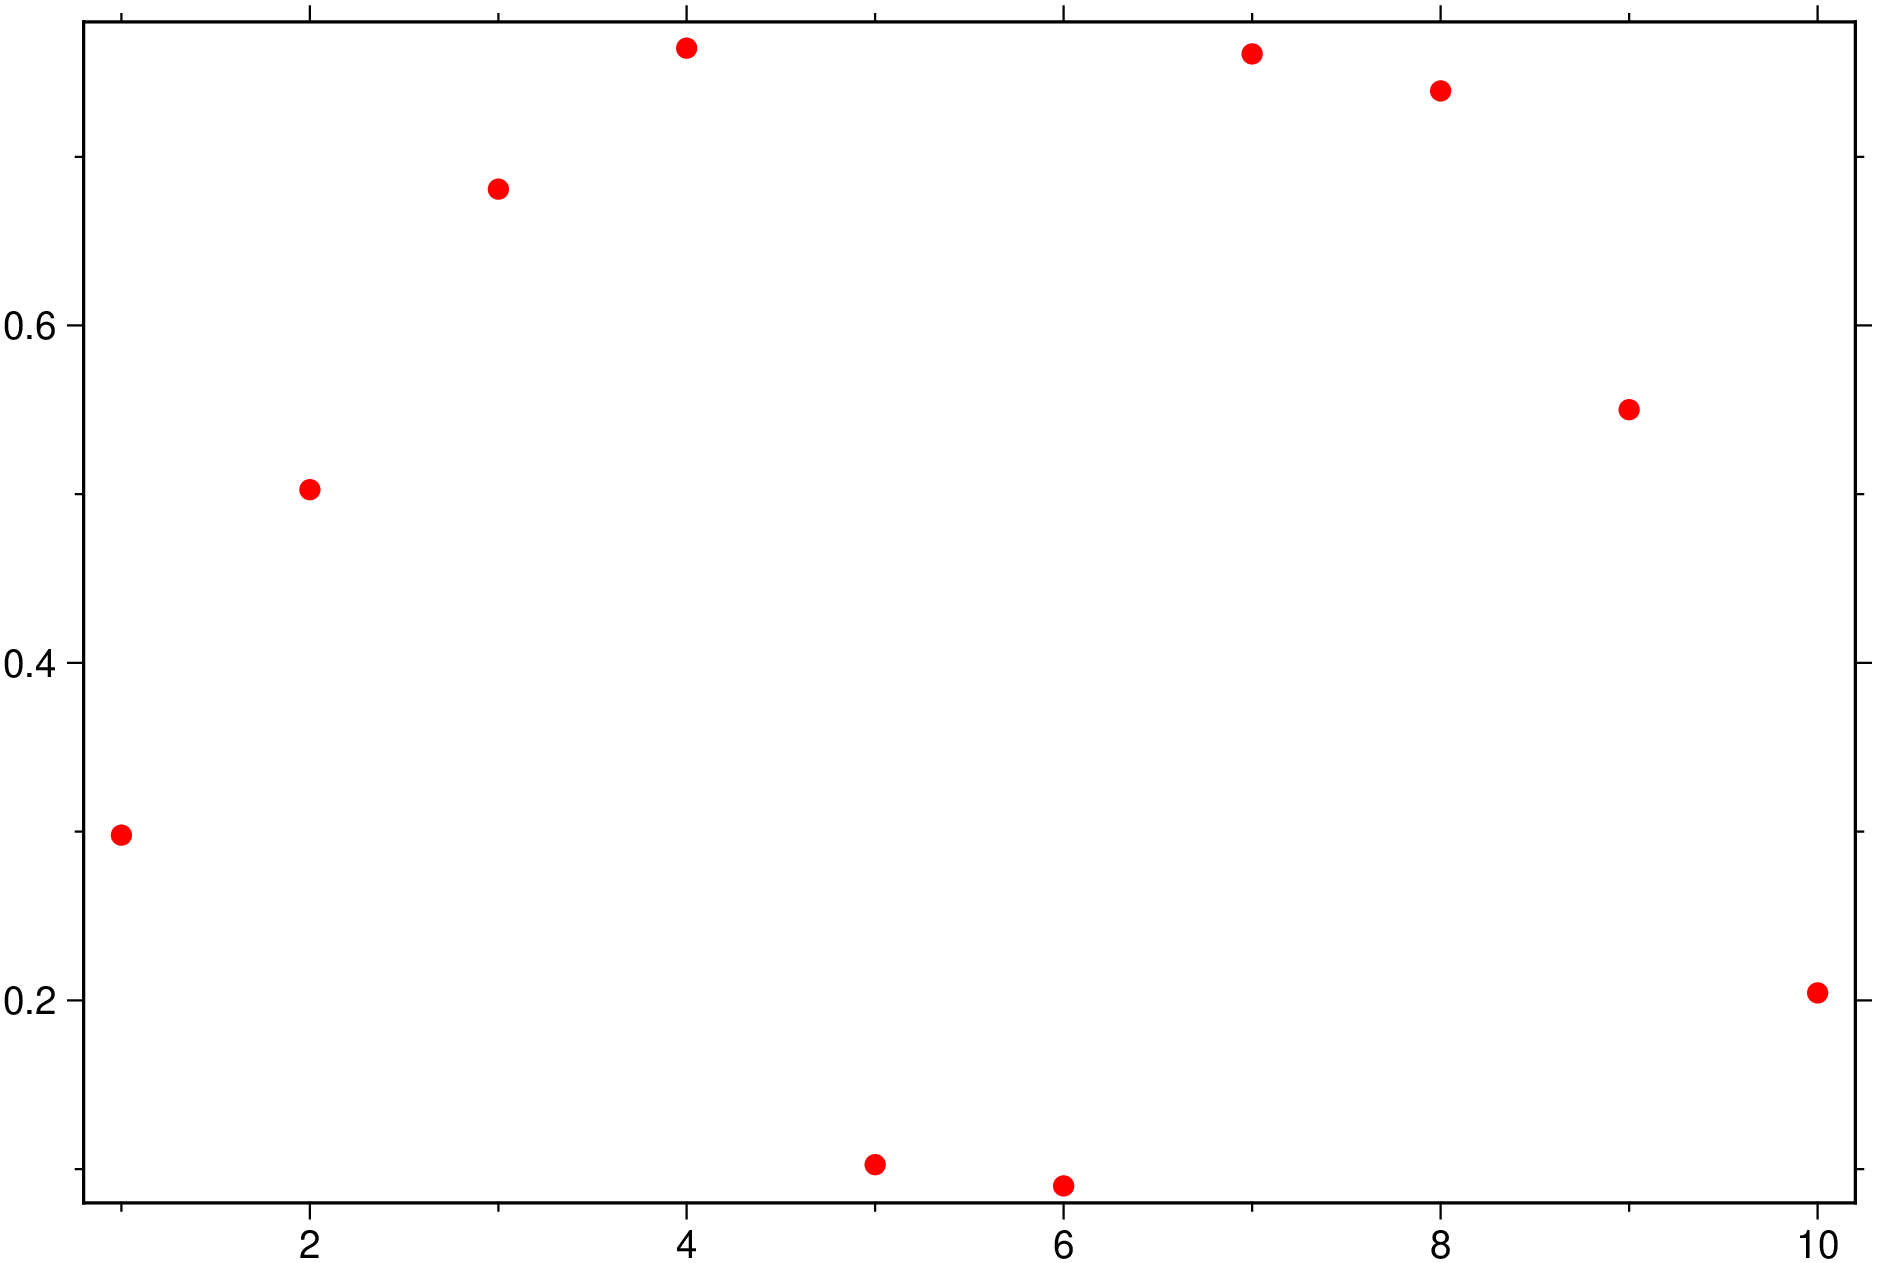
scatter(cmd0::String="", arg1=nothing; kwargs...)Reads (x,y) pairs and plot symbols at those locations on a map/figure. The input can either be a file name of a file with at least two columns (x,y), but optionally more, a GMTdatset object with also two or more columns.
This module is a subset of plot to make it simpler to draw scatter plots. So many (fine) controlling parameters are not listed here. For a finer control, user should consult the plot module.
There are no required arguments but
B or axes or frame
Set map boundary frame and axes attributes. Default is to draw and annotate left, bottom and vertical axes and just draw left and top axes. More at frame
J or proj or projection : – proj=
Select map projection. More at proj
R or region or limits : – limits=(xmin, xmax, ymin, ymax) | limits=(BB=(xmin, xmax, ymin, ymax),) | limits=(LLUR=(xmin, xmax, ymin, ymax),units=“unit”) | …more
Specify the region of interest. More at limits. For perspective view view, optionally add zmin,zmax. This option may be used to indicate the range used for the 3-D axes. You may ask for a larger w/e/s/n region to have more room between the image and the axes.
G or markerfacecolor or MarkerFaceColor or markercolor or mc or fill
Select color or pattern for filling of symbols [Default is no fill]. Note that plot will search for fill and pen settings in all the segment headers (when passing a GMTdaset or file of a multi-segment dataset) and let any values thus found over-ride the command line settings (but those must be provided in the terse GMT syntax). See Setting color for extend color selection (including color map generation).
zcolor or markerz or mz : – zcolor=xx | zcolor=true
Take the vector xx (same size as number os points in data) and interpolate the current color scale to paint the symbols based on that color scale. The form zcolor=true is equivant to zcolor=1:npoints
S or symbol or marker or Marker or shape : – Default is circle with a diameter of 7 points
:circle, size is symbol size in cm, unless unit is specified i.e. :pointsIn alternative to the symbol keyword, user can select the symbol name with either marker or shape and symbol size with markersize or ms. The value of these keywords can be either numeric (symb meaning size in cm) or string if an unit is appended, e.g. markersize="5p" This form of symbol selection allows also to specify a variable symbol size. All it’s need for this is that the keyword’s value be an array with the same number of elements as the number of data points.
p or view or perspective : – view=(azim, elev)
Default is viewpoint from an azimuth of 200 and elevation of 30 degrees.
Specify the viewpoint in terms of azimuth and elevation. The azimuth is the horizontal rotation about the z-axis as measured in degrees from the positive y-axis. That is, from North. This option is not yet fully expanded. Current alternatives are:
bar3!) More at perspectivet or transparency or alpha: – alpha=50
Set PDF transparency level for an overlay, in (0-100] percent range. [Default is 0, i.e., opaque]. Works only for the PDF and PNG formats.
figname or savefig or name : – figname=name.png
Save the figure with the figname=name.ext where ext chooses the figure image format.
A simple scatter of ten points plotted as red circles of 7 points size
using GMT
scatter(1:10,rand(10), fill=:red, show=true)
A plot where symbol’s size grows linearly
using GMT
sizevec = [s for s = 1:10] ./ 10;
scatter(1:10, 1:10, markersize = sizevec, marker=:square, fill=:green, show=1)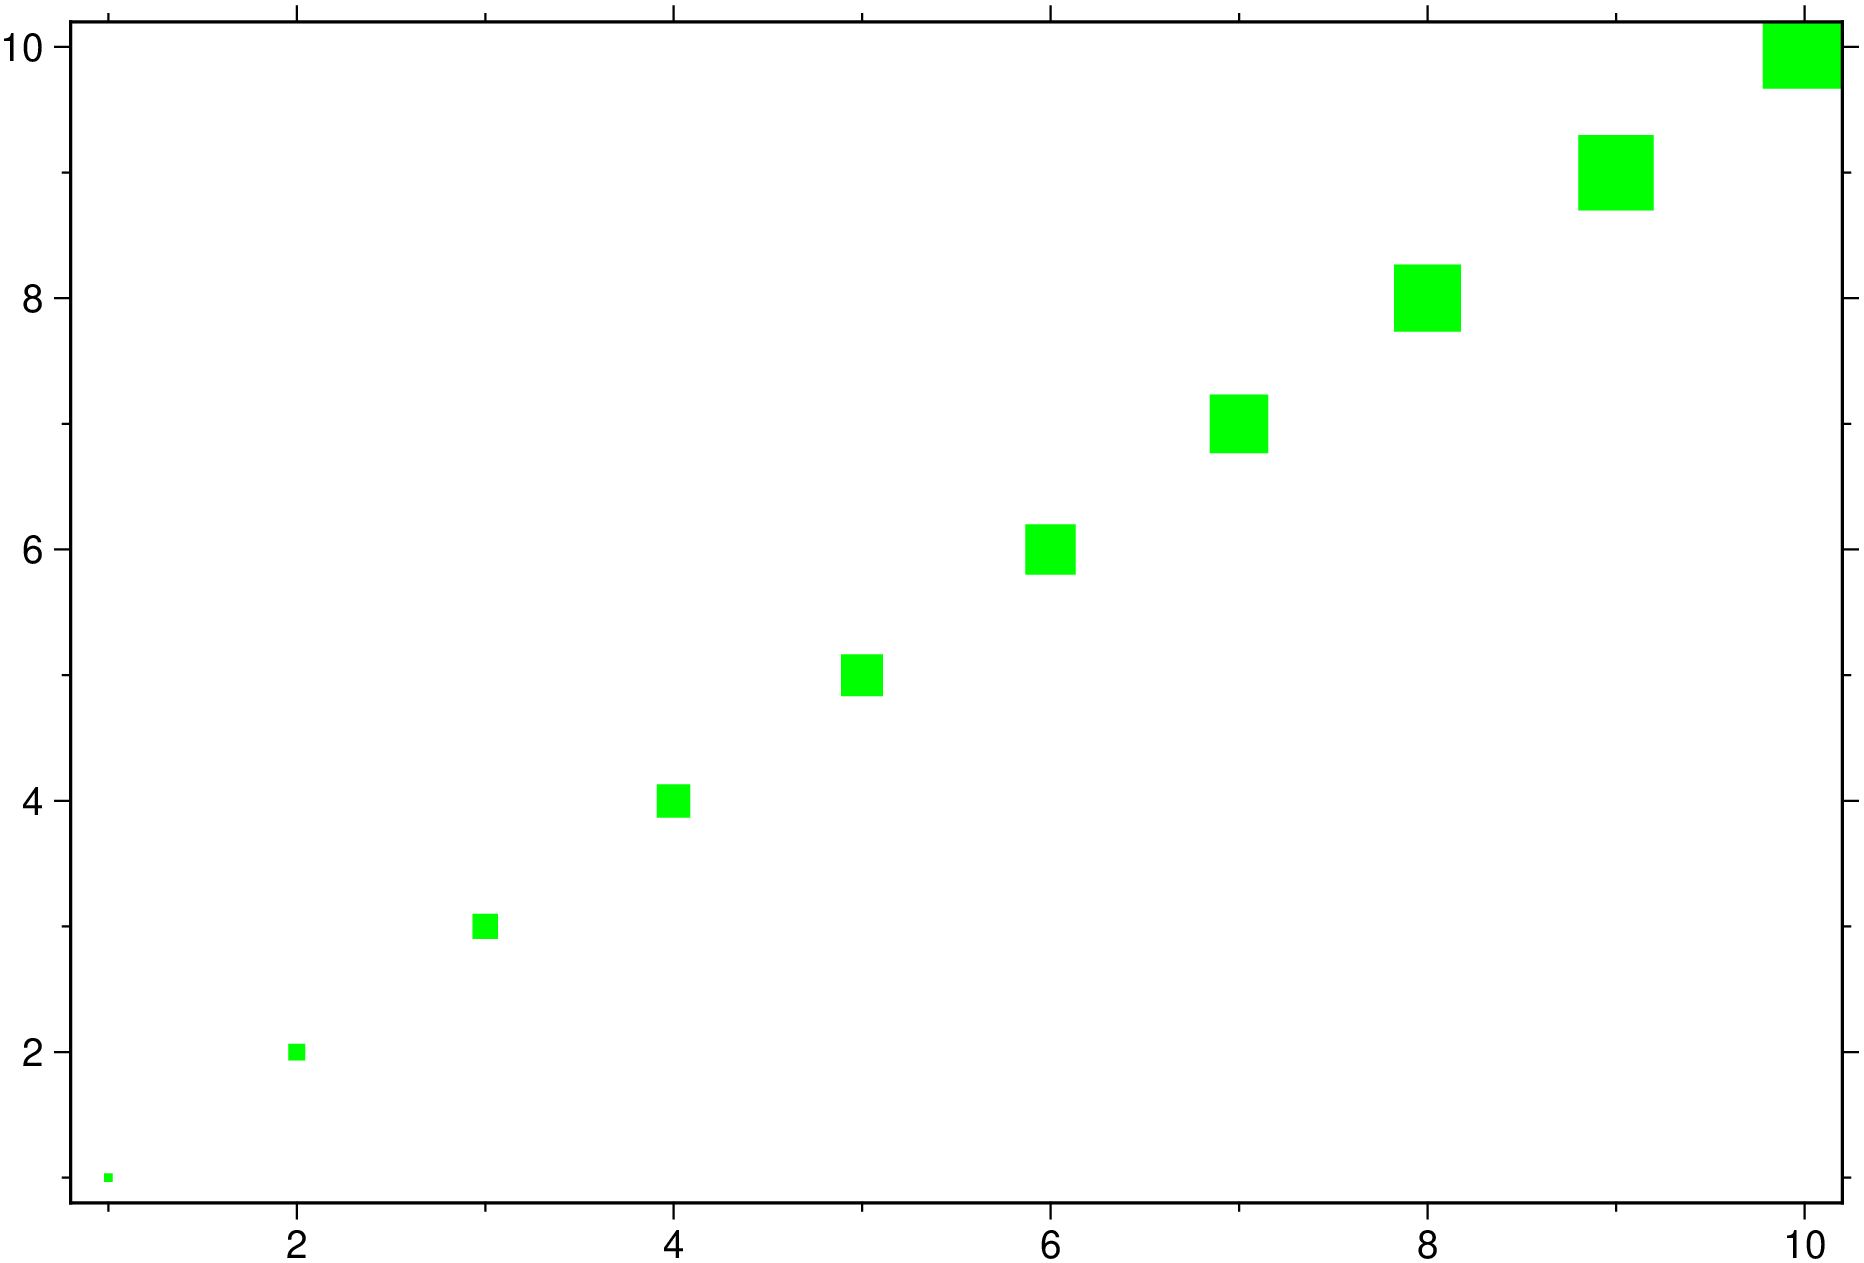
The GMT man page
This function has multiple methods:
scatter(cmd0::String; ...) - plot.jl:387scatter(cmd0::String, arg1; kw...) - plot.jl:387scatter(D::Vector{<:GMTdataset{Float64, 2}}; first, kw...) - plot.jl:399scatter(f::Function; ...) - plot.jl:376scatter(f1::Function, f2::Function; ...) - plot.jl:382scatter(f::Function, range_x; first, kw...) - plot.jl:376scatter(f1::Function, f2::Function, range_t; first, kw...) - plot.jl:382scatter(; ...) - plot.jl:387scatter(arg1, arg2; kw...) - plot.jl:393scatter(arg; kw...) - plot.jl:390