findpeaks
findpeaks(y, x=1:length(y); min_height=minimum(y), min_prom=minimum(y), min_dist=0, threshold=0; xsorted::Bool=false)
or

findpeaks(D::GMTdataset; min_height=D.bbox[1], min_prom=zero(D[1]), min_dist=0, threshold=0; xsorted::Bool=false)
Returns indices of local maxima (sorted from highest peaks to lowest) in 1D array of real numbers. Similar to MATLAB's findpeaks().
A local peak is a data sample that is either larger than its two neighboring samples or is equal to Inf. The peaks are output in order of occurrence. This function is from the Findpeaks.jl package.
Args
y: Input data, specified as a vector.ymust be real and must have at least three elements.x: Locations, specified as a vector or a datetime array.xmust increase monotonically and have the same length asy. Ifxis omitted, then the indices ofyare used as locations.D: Alternatively toyandxyou can provide aGMTdatasetwith two,x,y(or more), columns.
Kwargs
min_height: Minimum peak height, specified as a real scalar. Use this argument to havefindpeaksreturn only those peaks higher thanmin_height.min_prom: Minimum peak prominence, specified as a nonnegative real scalar. Use this argument to havefindpeaksreturn only those peaks that have a relative importance of at leastmin_prom(see Prominence).min_dist: Minimum peak separation (keeping highest peaks). When you specify a value for this option, the algorithm chooses the tallest peak and ignores all peaks withinmin_distof it.threshold: Minimal difference (absolute value) between peak and neighboring points. Use this argument to havefindpeaksreturn only those peaks that exceed their immediate neighboring values by at least the value ofthreshold.xsorted: If true, the indices of local maxima are sorted in ascending order ofx. Default is to sort by amplitude.
Returns
peaks: A vector of indices of local maxima (sorted from highest peaks to lowest whenxsorted=false).
Examples
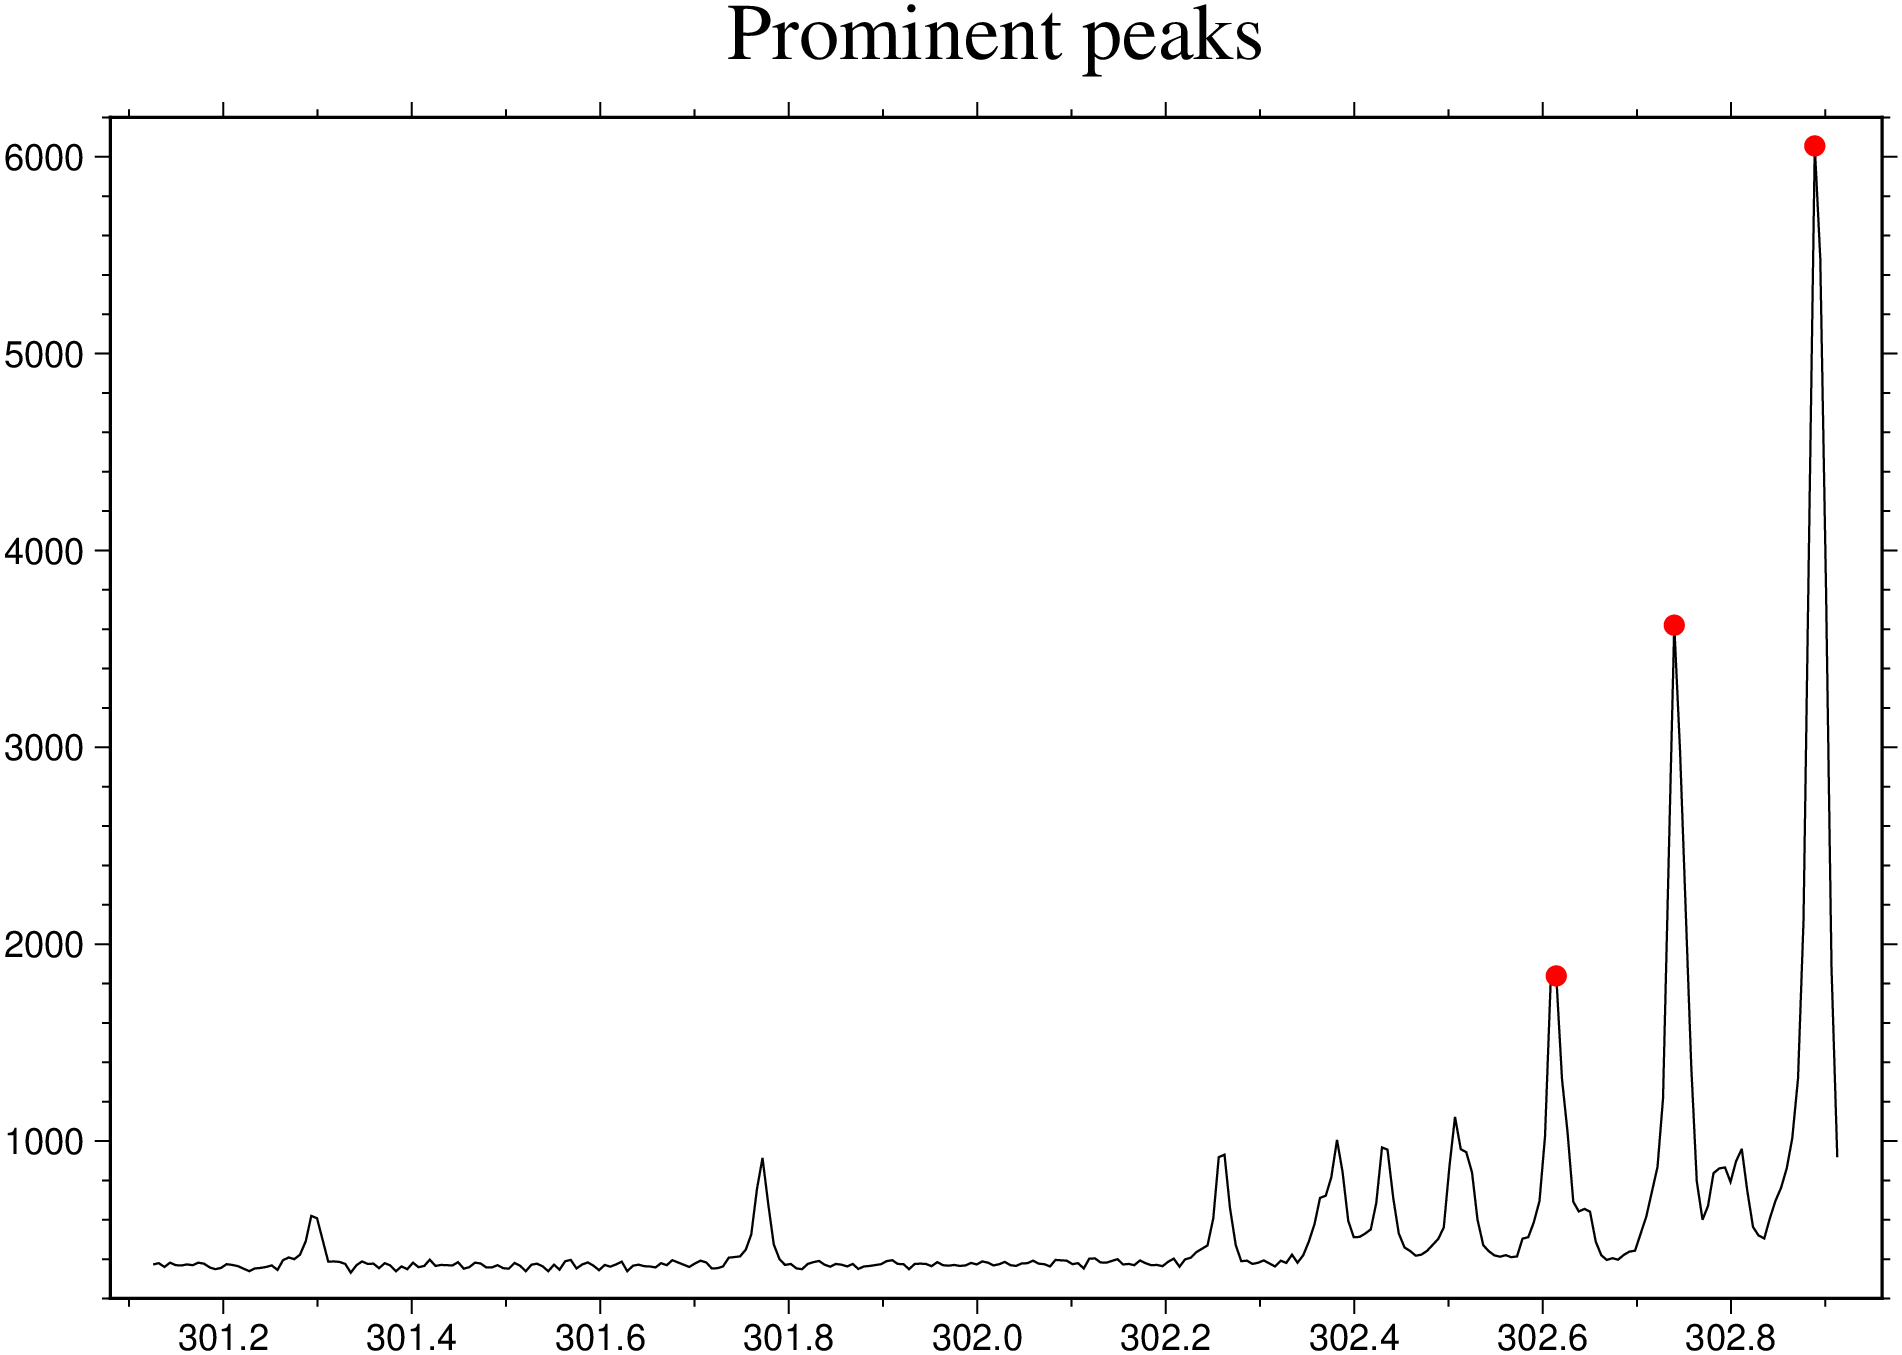
using GMT

D = gmtread(TESTSDIR * "assets/example_spectrum.txt");
peaks = findpeaks(D, min_prom=1000.);

plot(D, title="Prominent peaks")
scatter!(D[peaks,:], mc=:red, show=true)
using GMT

D = gmtread(TESTSDIR * "assets/example_spectrum.txt");
peaks = findpeaks(D, min_dist=0.2)

plot(D, title="Peaks at least 0.2 units apart")
scatter!(D[peaks,:], mc=:red, show=true)

These docs were autogenerated using GMT: v1.33.0