inset
inset(kwargs...)
Manage figure inset setup and completion
The inset module is used to carve out a sub-region of the current plot canvas and restrict further plotting to that section of the canvas. The inset setup is started with the inset(...) directive that defines the placement and size of the inset. Subsequent plot commands will be directed to that window. The inset is completed via the inset(:end) directive, which reverts operations to the full canvas and restores the plot region and map projection that was in effect prior to the setup of the inset.
Description
The inset(...) defines the dimension and placement of the inset canvas. It records the current region and projection so that we may return to the initial plot environment when the inset is completed. The user may select any plot region and projection once plotting in the inset, but if the first command uses a projection that leaves off the scale or width then we supply a scale or width to fill the inset as best as possible, given the inset size and margins (if selected). Note: If you wish to let the inset dimensions be determined by the region and projection that will be used to draw in the inset, then give these arguments in the inset() command.
Required Arguments
D or pos or positionor inset_box or insetbox : – position=(map=true, inside=true, outside=true, norm=true, paper=true, anchor=XX, size=XX, width=XX, justify=code, offset=XX)
Define the map inset rectangle on the map. Specify the rectangle in one of three ways:Use
map=(lon,lat)for map coordinates. Requires both region and proj to be set.Use
inside=codeoroutside=codefor setting the refpoint via a 2-char justification code that refers to the (invisible) projected map bounding box. Requires both region and proj to be set.Use
norm=(x,y)for normalized bounding box coordinates (0-1). Requires both region and proj to be set.Use
paper=(x,y)for plot coordinates (append cm, inch, or point).
Use size=(length,width) (or width) of bounding rectangle or box in plot coordinates (inches, cm, etc.). By default, the anchor point on the scale is assumed to be the bottom left corner (BL), but this can be changed by using justify=?? where ?? stands for a 2-char justification code justify (see \myreflink{text}). Note: with the default outside=true, the justify defaults to the same as anchor, if inside=true is used then justify defaults to the mirror opposite of anchor. Specify inset box attributes via the box option [outline only].
Alternatively, use position="west/east/south/north" of geographic rectangle bounded by parallels and meridians; append +r if the coordinates instead are the lower left and upper right corners of the desired rectangle. (Or, give xmin/xmax/ymin/ymax of bounding rectangle in projected coordinates and optionally append +uunit [Default coordinate unit is meter (e)]. NOTE that this form requires passing the options as a string and it uses the terse pure GMT syntax.
Optional Arguments
C or clearance : – clearance=val | clearance=(left=val, right=val, bott=val, bottom=val, top=val))
Reserve a space of dimension clearance between the actual inset plot area and the given inset box on the specified side, using side values from left=val, right=val, bottom=val, or top=val, or lr=val for both left and right or tb=val for both top and bott. No side means all sides. Alternatively, if all sides are to be set you can also give a pair of values separated by slashes (for setting separate horizontal and vertical margins), or the full set of four separate margins. Such space will be left untouched by the inset map plotting. Append units as desired (cm, inch, or point) [Default is set byPROJ_LENGTH_UNIT].F or box : – box=(clearance=val, fill=color, inner=true, pen=pen, rounded=true, shaded=XX)
Without further options, draws a rectangular border around the map inset usingMAP_FRAME_PEN. The following modifiers can be appended to |-F|, with additional explanation and examples provided in the The background panel cookbook section:clearance=val where val is either gap or (xgap,ygap), or (lgap,rgap,bgap,tgap) where these items are uniform, separate in x- and y-direction, or individual side spacings between the map embellishment and the border for each side.
fill=color, where color is any valid color setting (see myreflink{Setting color}), to fill the scale panel [no fill].
inner=true to draw a secondary, inner border as well. We use a uniform gap between borders of 2p and the
MAP_DEFAULTS_PENunless other values are specified (like inner="gap/pen").
pen=pen, to specify different myreflink{Pen attributes} attributes.
rounded=true to draw rounded rectangular borders instead, with a 6p corner radius. You can override this radius by using another value instead of true.
shadded=true or shadded=(dx,dy) or shadded=shade to draw an offset background shaded region. Here, dx/dy indicates the shift relative to the foreground frame [4p/-4p]and shade sets the fill style to use for shading ("gray50").
J or proj or projection : – proj=<parameters>
Select map projection. More at proj
N or noclip or no_clip : noclip=true
Do not clip features extruding outside map inset boundaries [Default will clip].
R or region or limits : – limits=(xmin, xmax, ymin, ymax) | limits=(BB=(xmin, xmax, ymin, ymax),) | limits=(LLUR=(xmin, xmax, ymin, ymax),units="unit") | ...more
Specify the region of interest. More at limits. For perspective view view, optionally add zmin,zmax. This option may be used to indicate the range used for the 3-D axes. You may ask for a larger w/e/s/n region to have more room between the image and the axes.
V or verbose : – verbose=true | verbose=level
Select verbosity level. More at verbose
Synopsis (end mode)
The inset(:end) command finalizes the current inset, which returns the plotting environment to the state prior to the start of the inset. The previous region and map projection will be in effect going forward.
The nested call mode
The options described above respect the pure use of inset as a modern mode function. But we can also use it in a mix mode in one-liners commands. It is mixed because the functioning relies in mixing the classic and modern modes (in a way transparent to the user). And, as just said, this mix mode consists in calling the inset function as an option to the plot, basemap and grdimage functions. Since we are doing a nested call, we need to pass all options as argument to inset and this ofc reduces the number of possibilities but still, it offers quite nice features that allow creating elaborated figures with very short commands. The Figure insets shows several examples of this usage.
The inset windows are located according to an algorithm that tries to avoid overlapping lines in line plots (with a moderate success), or in some corner position for insets with images. Inset windows sizes are also automatically estimated from image sizes and projections (when they are geographical). However, user can manually control this wth position option explained above.
inset – inset=(data, zoom=(...), coast=(...), position=(...), box=(...), clearance=(...))
data An image, a grid a table (GMTdataset) or a file name that can be automatically read by
\myreflink{gmtread}. Depending on the data type an x,y plot or an image is displayed inside the inset window.
zoom This refers to an area of the main window that we wish to make a zoom of. Its arguments depend
on whether we are zooming an x,y plot or an image. In the first case we pass an x location and a half-width. For example
zoom=(10,2)means that the zoom window covers the abscissa [8 12] range. The y extent is whatever the line has between those x limits. But for the case of images we need one more argument because now we have 2 dimensions. The syntax now iszoom=(x0,y0,delta), an extension of the previous concept, which requires that the units of x and y are the same and we get a square zoom window. The alternative is to use the usual way of GMT specifying region limits. That iszoom=(x_min, x_max, y_min, y_max)pzoom When adding insets to images we can provide an external image (or file name) that will be displayed
in the inset. But since in this case the inset does not have to share the same coordinates with main figure, we only provide here the point coordinates of the interesting area. The syntax is hence
pzoom=(x0,y0).coast With this argument we can call the \myreflink{coast} command with all of its normal arguments. And
furthermore, we can even call the \myreflink{plot} (or any of its avatars) to add line/symbol plots over the inset map. A further option to this form of calling
coastis the optionrect=?. If?istrue, it will plot a 0.75 pt blue rectangle showing the main window limits. Alternatives isrect=number,rect=colororrect=(number, color), wherecoloris a color name andnumberis the rectangle line thickness in pointsposition, box, clearance Have the same meaning/usage as explained above.
Examples
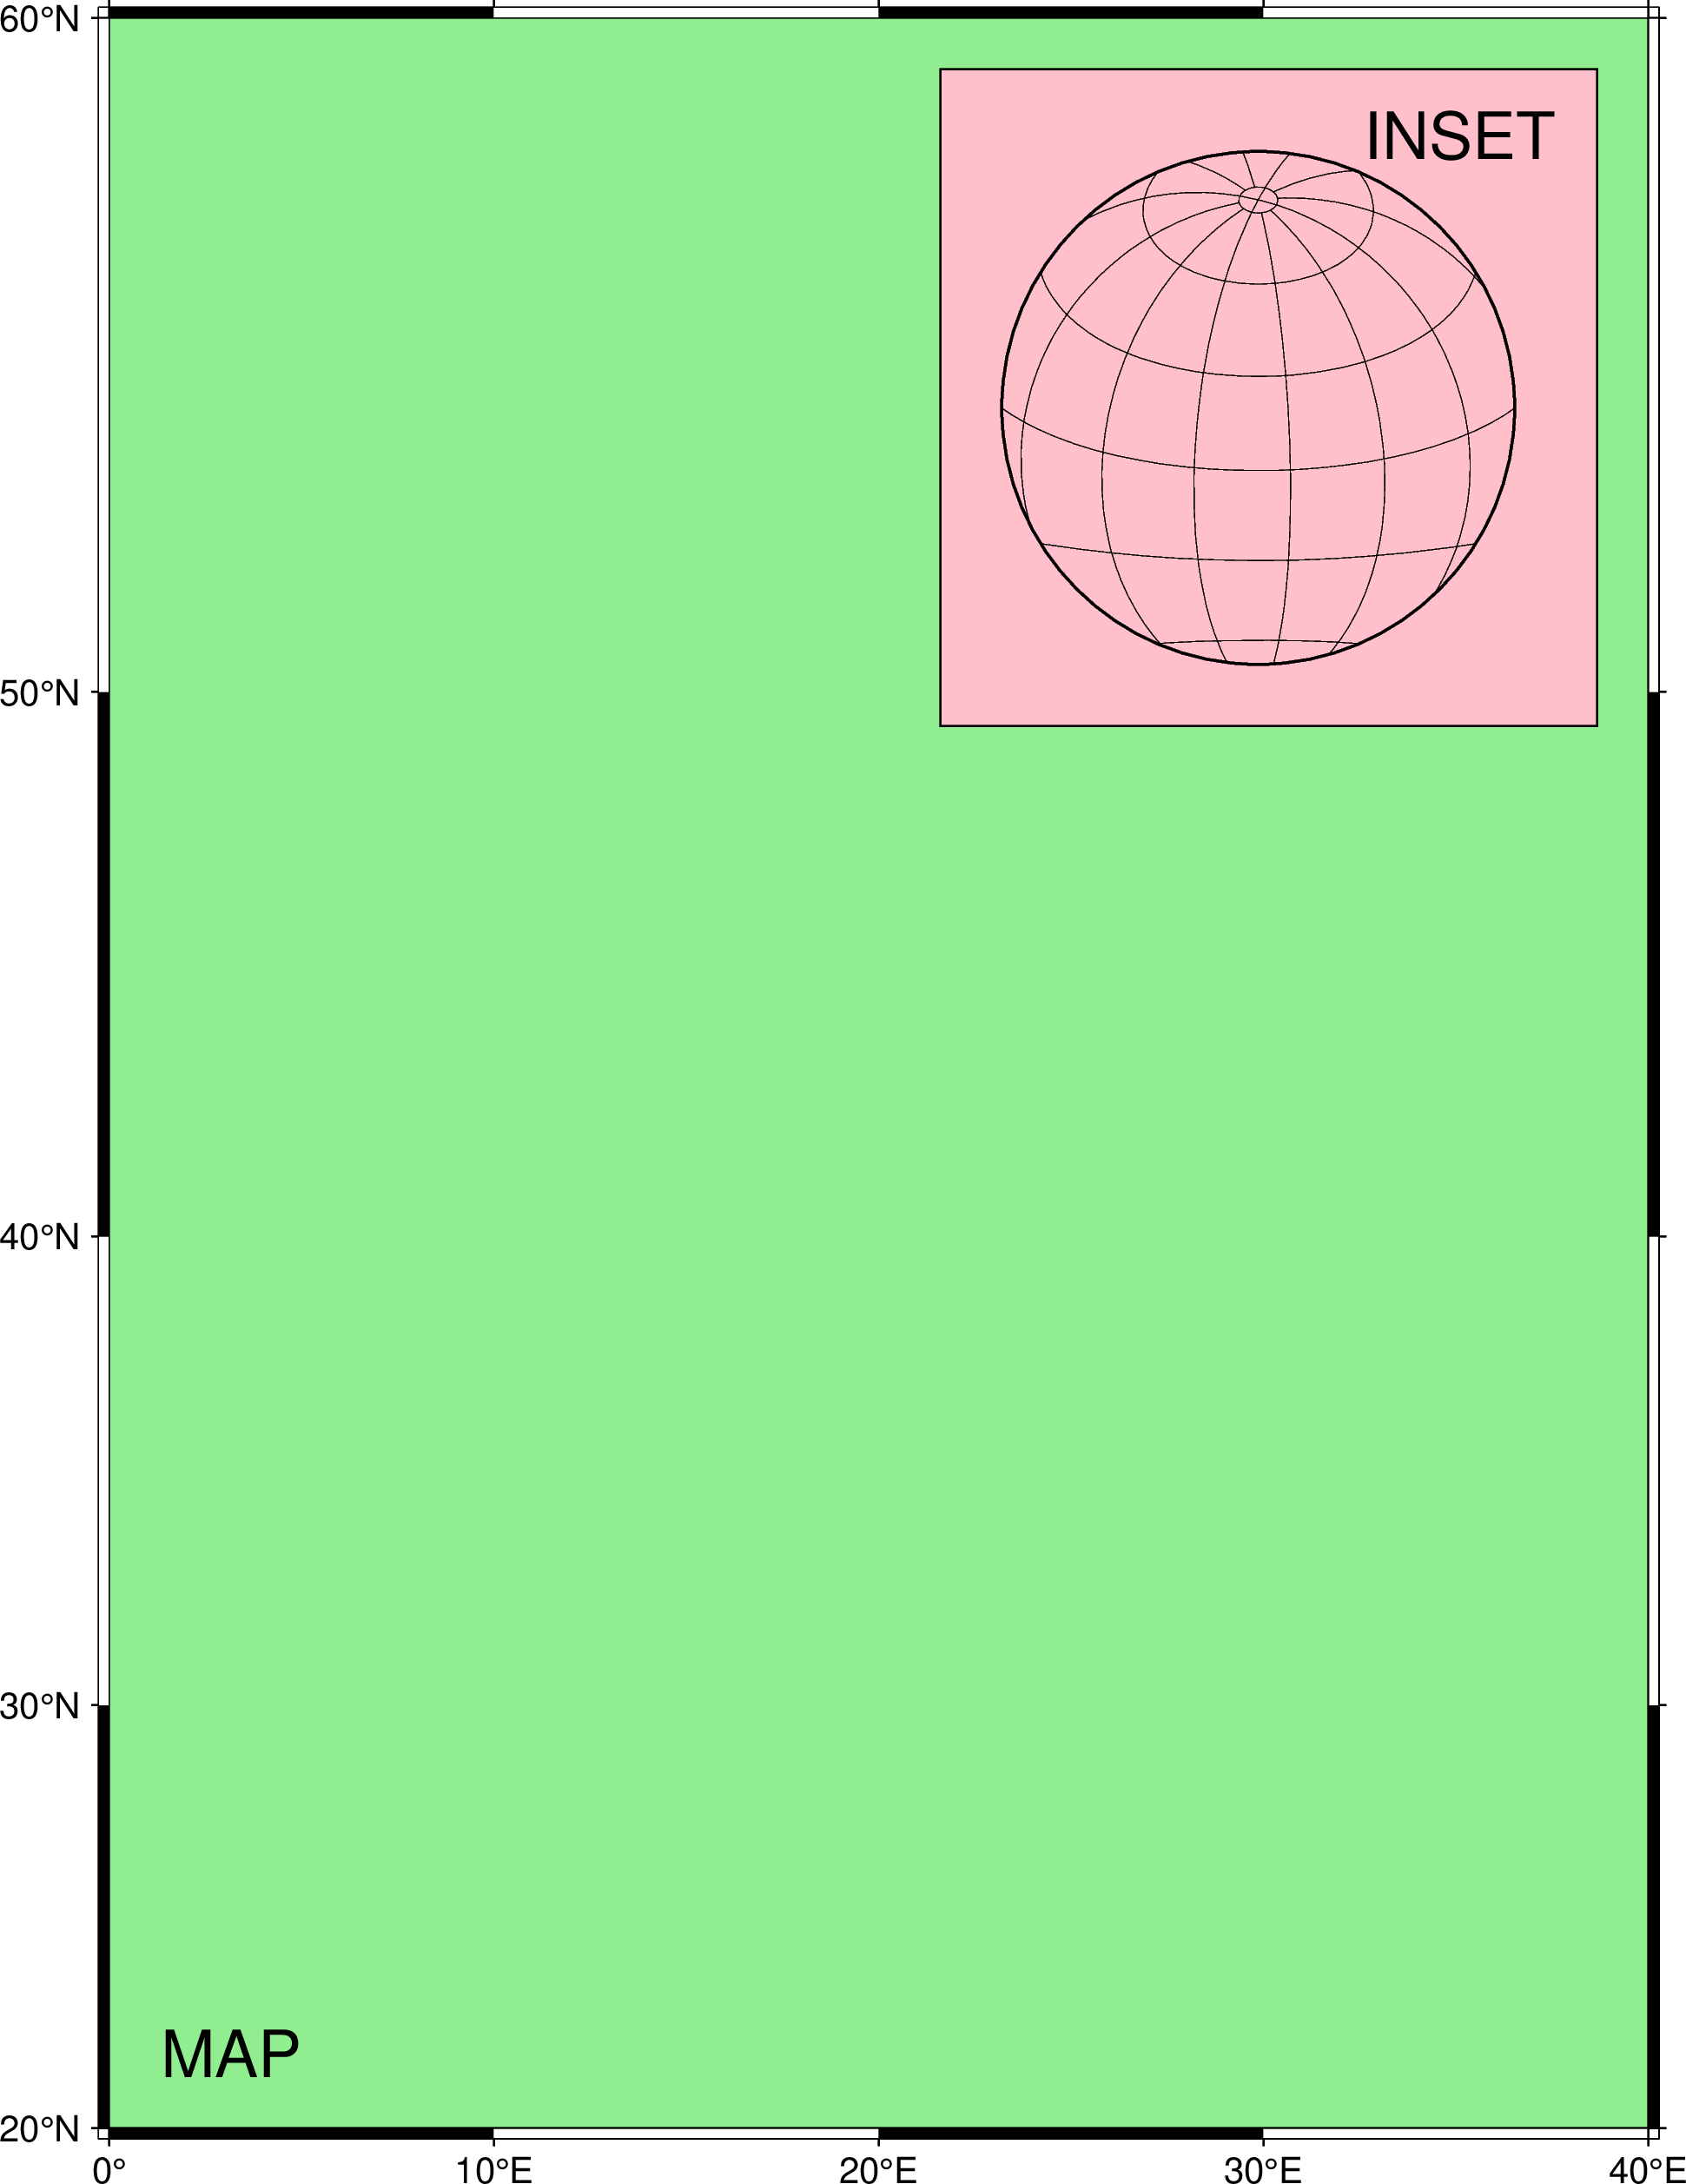
To make a simple basemap plot that demonstrates the inset module, try
using GMT
gmtbegin()
	basemap(region=(0,40,20,60), proj=:merc, frame=(annot=:afg, fill=:lightgreen))
	inset(position=(anchor=:TR, width=6.4, offset=0.5), box=(fill=:pink, pen=0.5), margins=0.6)
		basemap(region=:global360, proj=(name=:laea, center=[20,20]), figsize=5, frame=:afg)
		text(text="INSET", font=18, region_justify=:TR, offset=(away=true, shift=-0.4), noclip=true)
	inset(:end)
	text(text="MAP", font=18, region_justify=:BL, offset=(away=true, shift=0.5))
gmtend(:show)
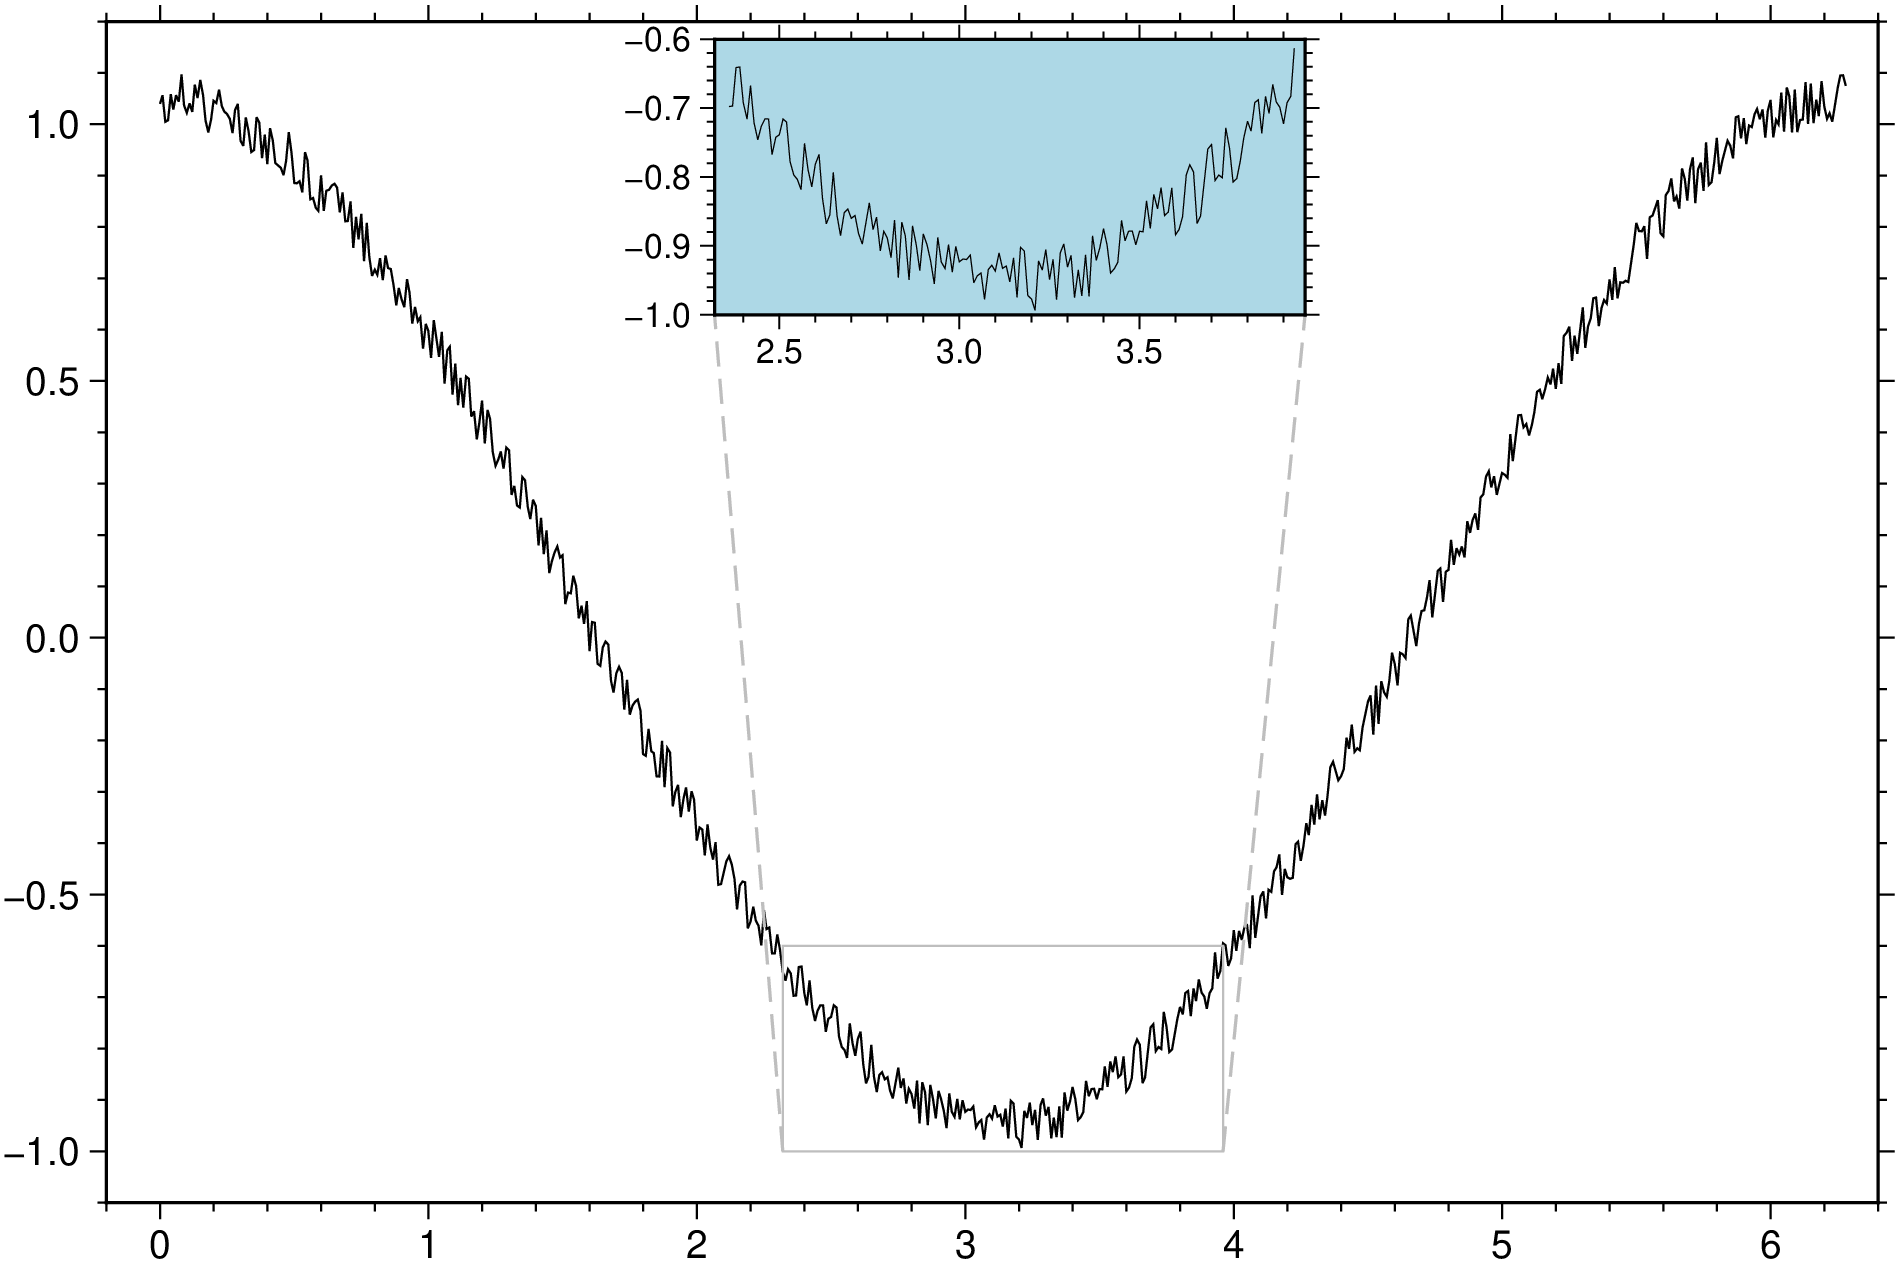
Make a zoom over a region of a synthetic plot.
using GMT

t = 0:0.01:2pi;
plot(t, cos.(t).+rand(length(t))*0.1, inset=(zoom=(pi,pi/4), box=(fill=:lightblue,)), show=true)
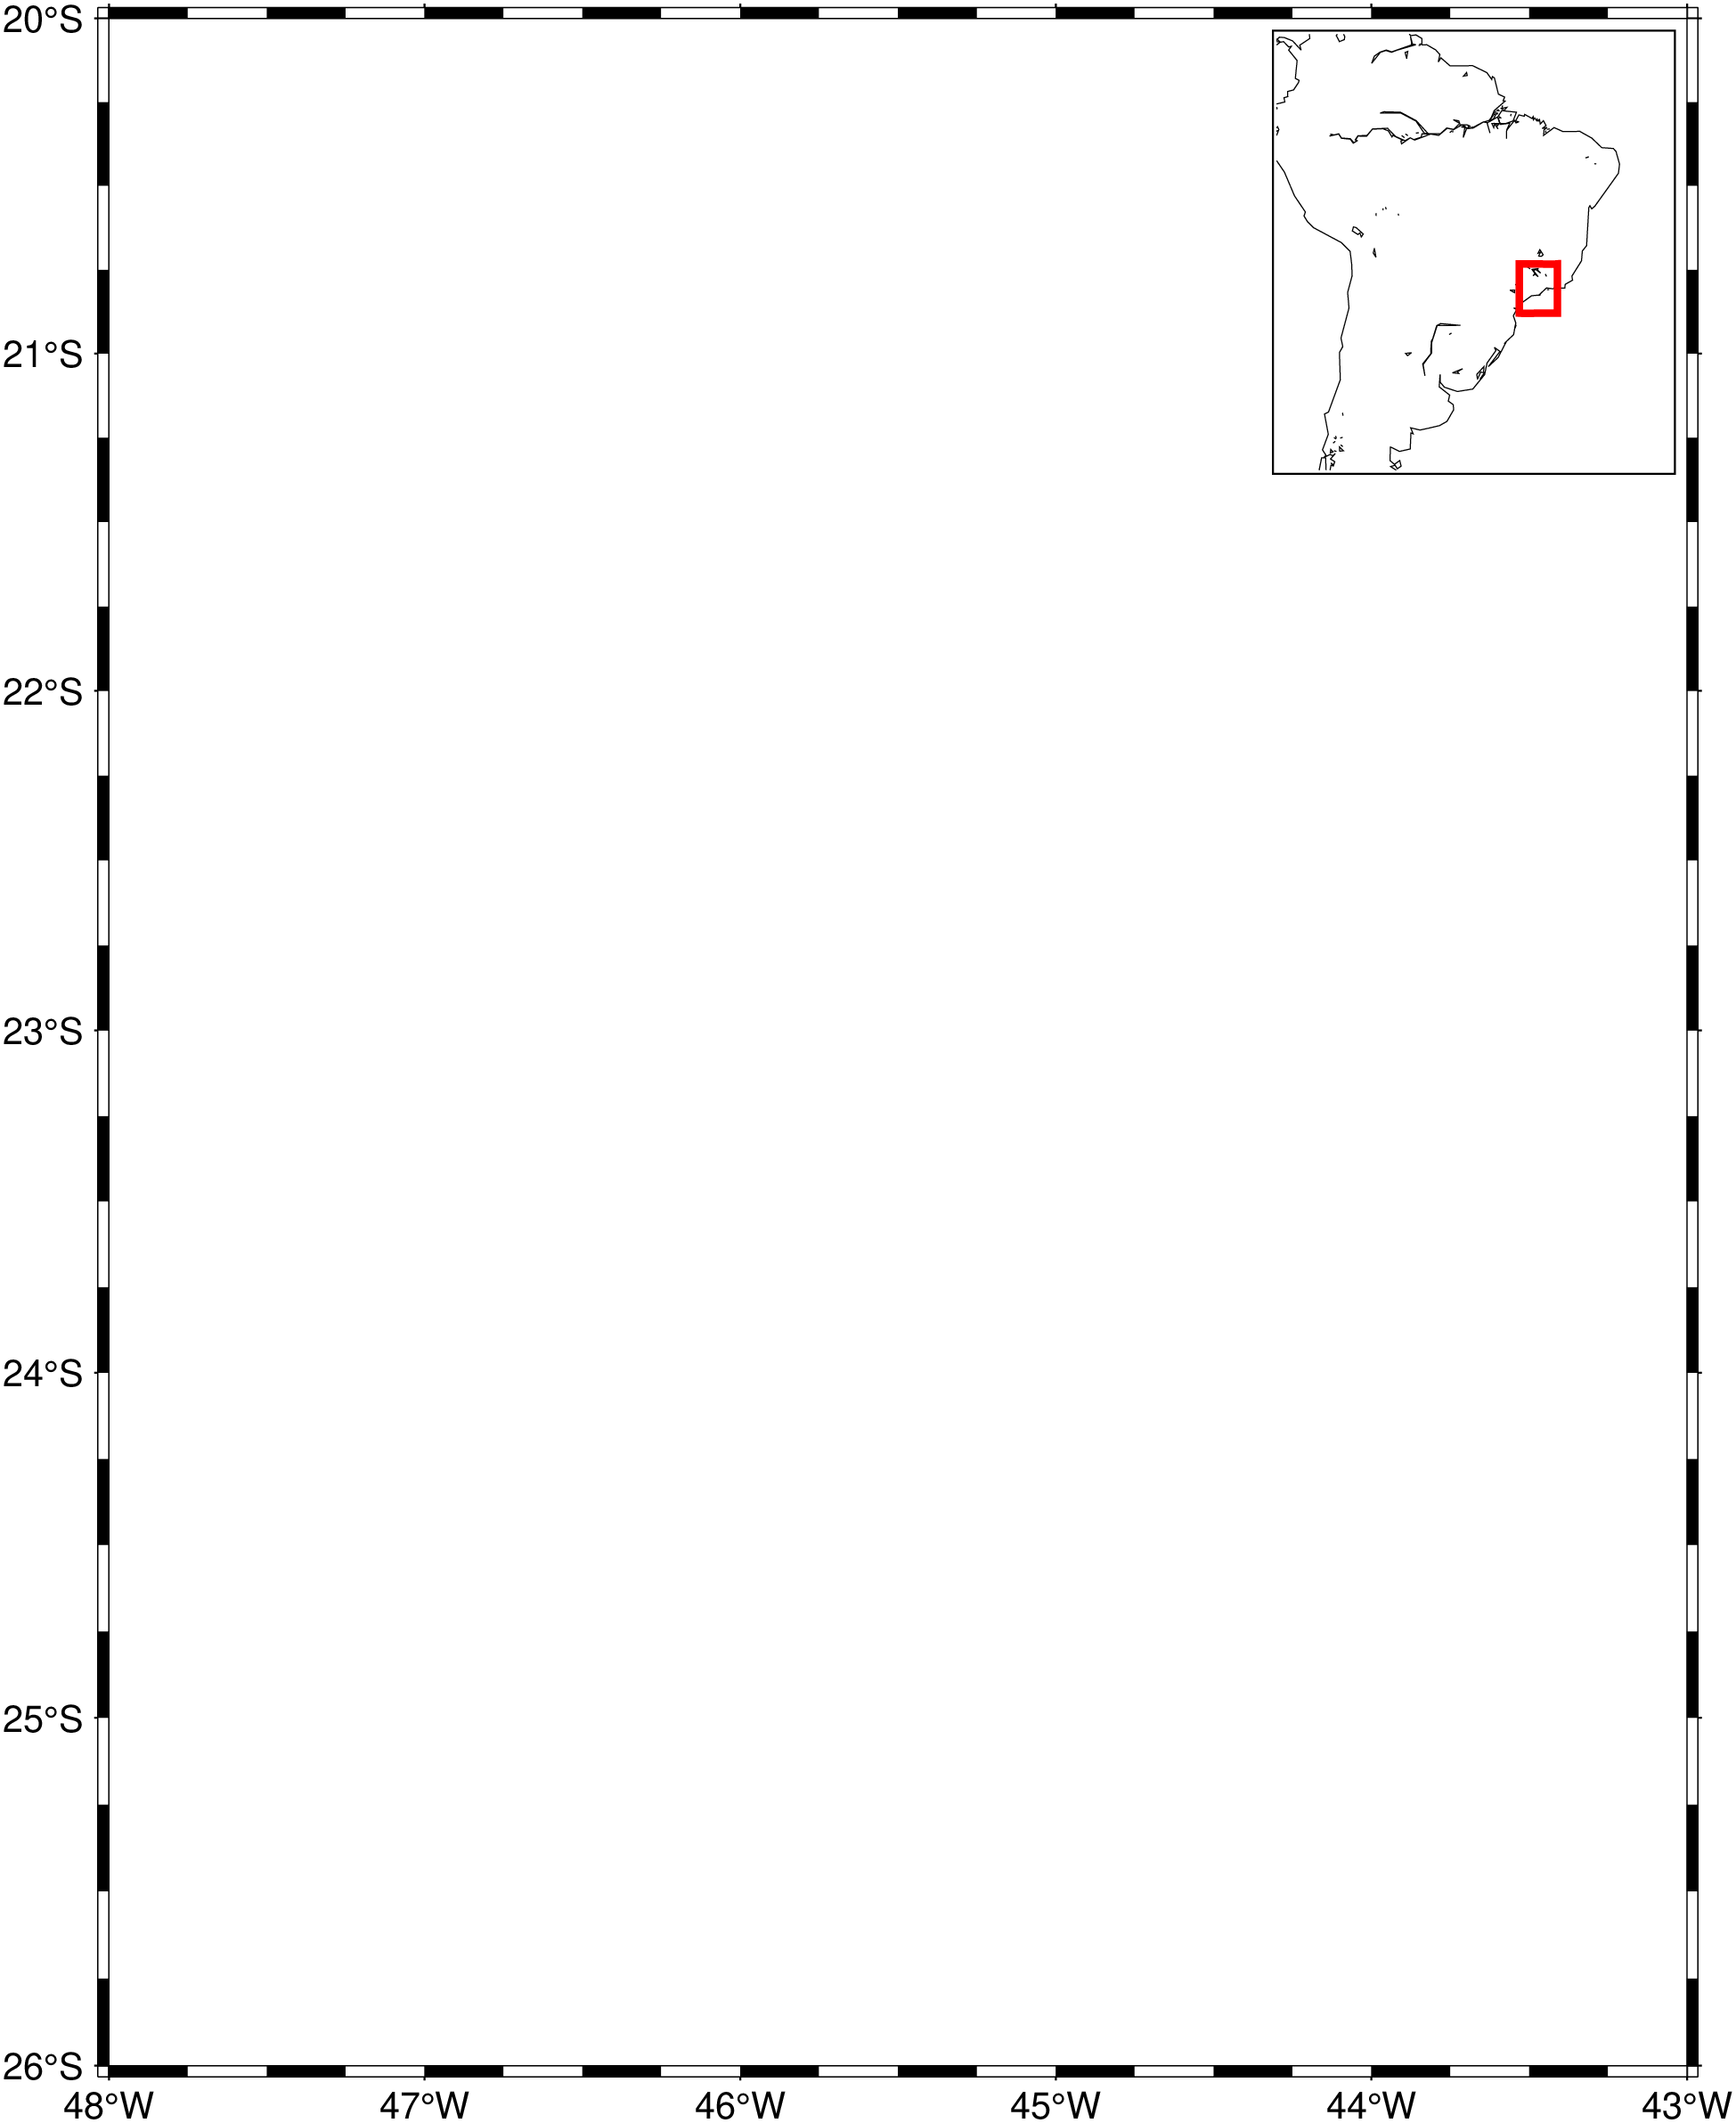
Add an inset to basemap image with a rectangle in the inset taken from main image limits.
using GMT

basemap(region=(-48,-43,-26,-20), proj=:merc,
        inset=(coast, R="-80/-28/-43/10", proj=:merc, shore=true, rect=(2,:red)), show=true)
These docs were autogenerated using GMT: v1.33.0