Plotyy
Examples
Using x and y vectors
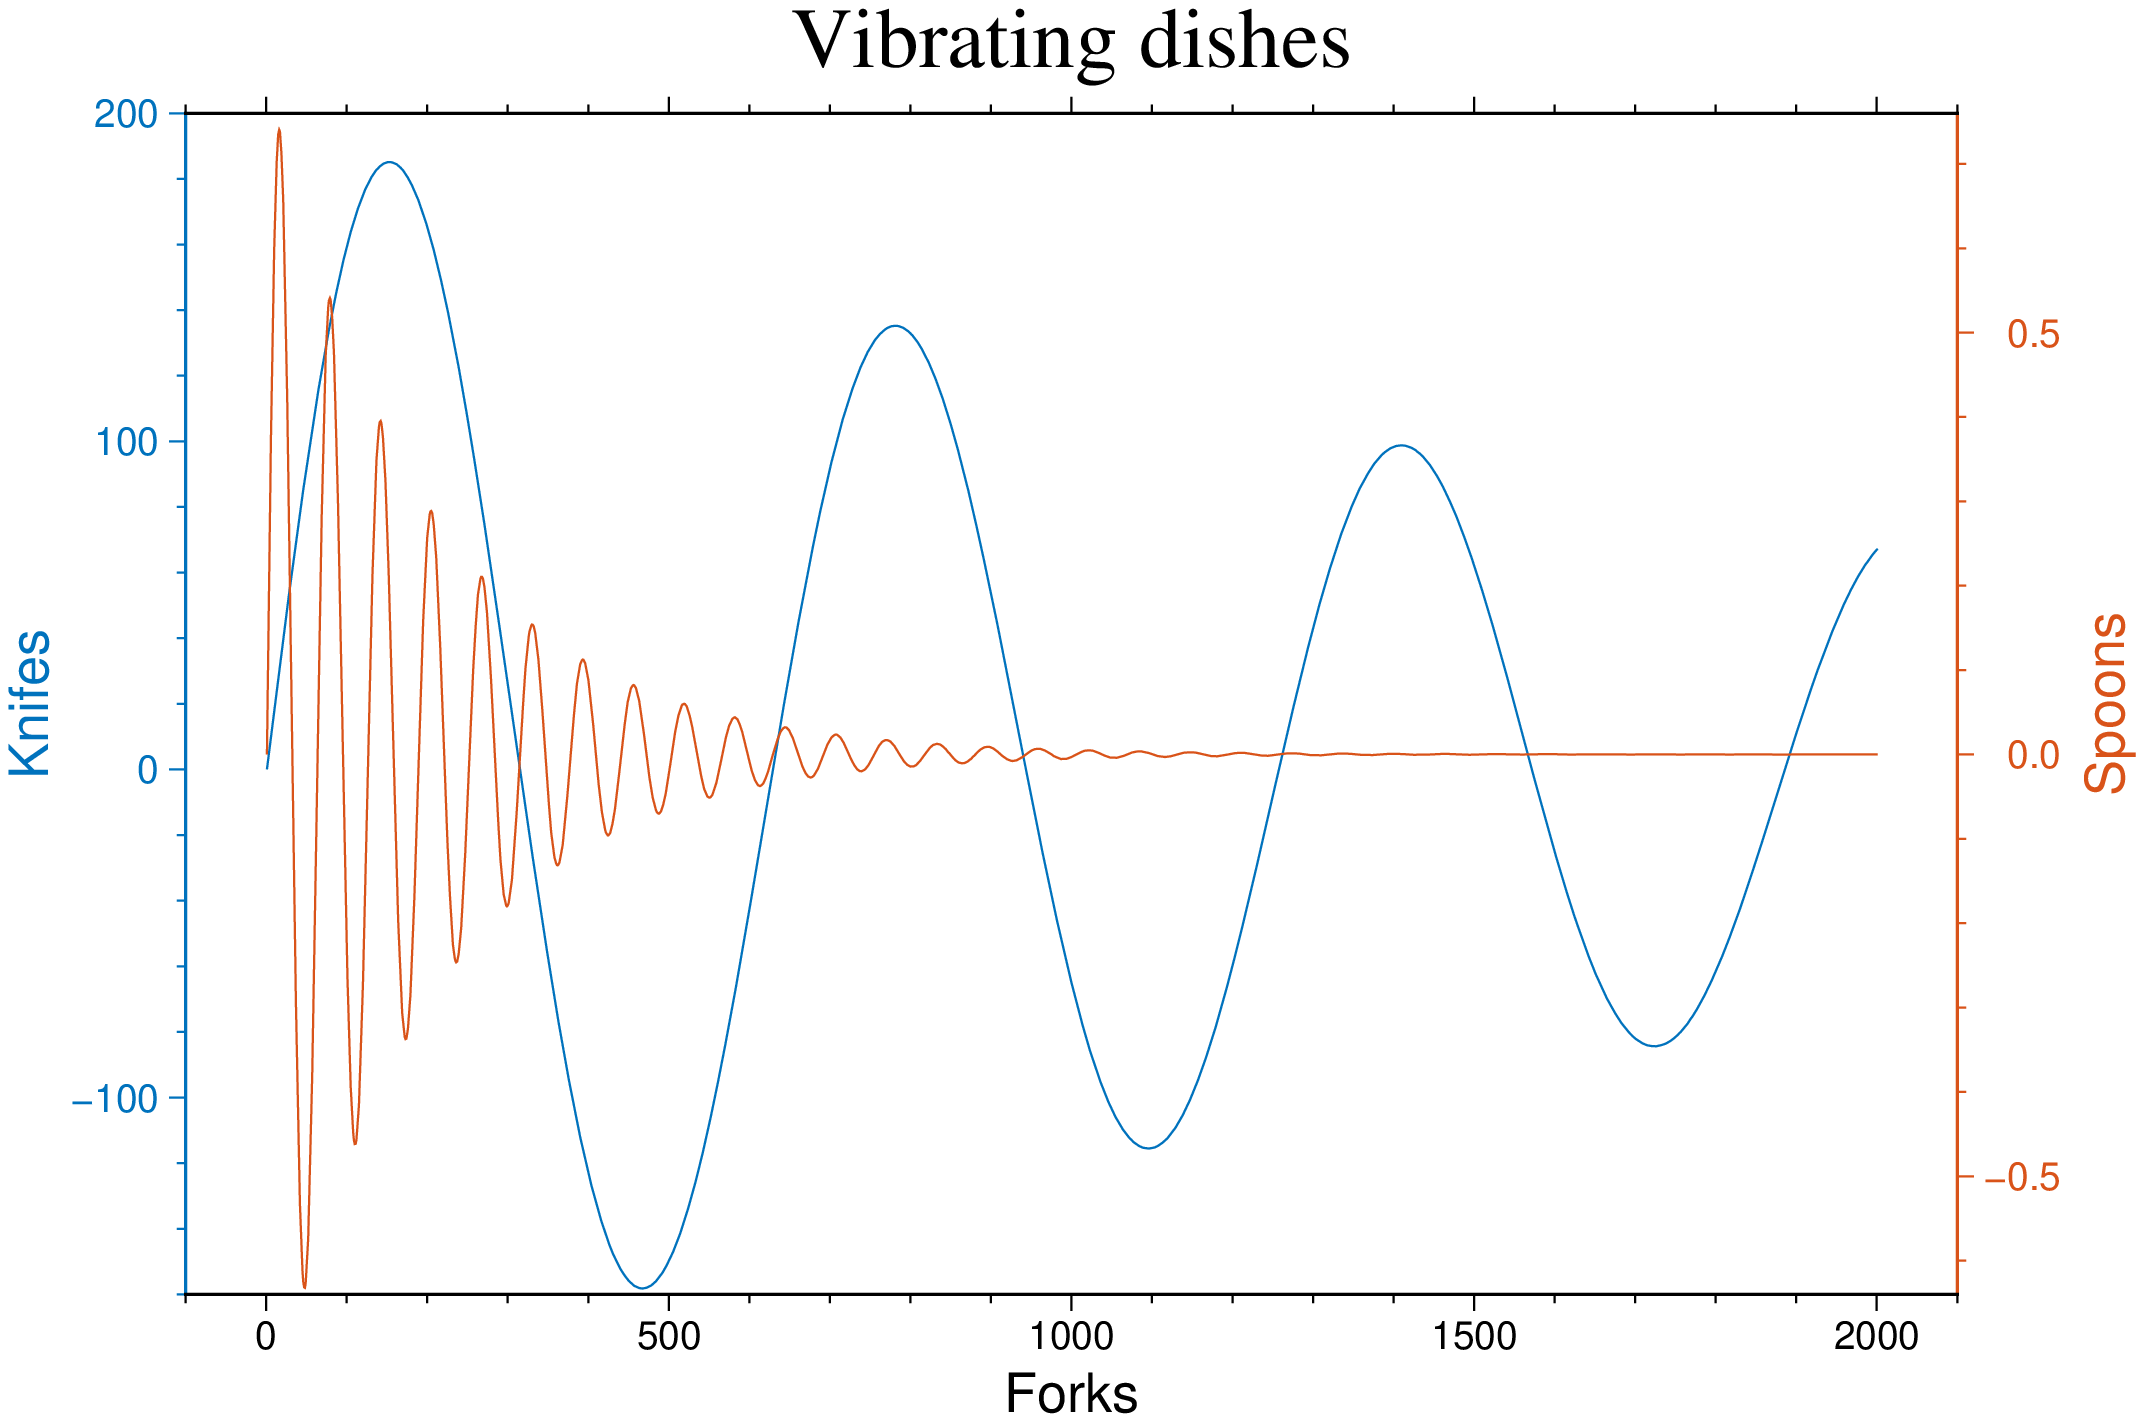
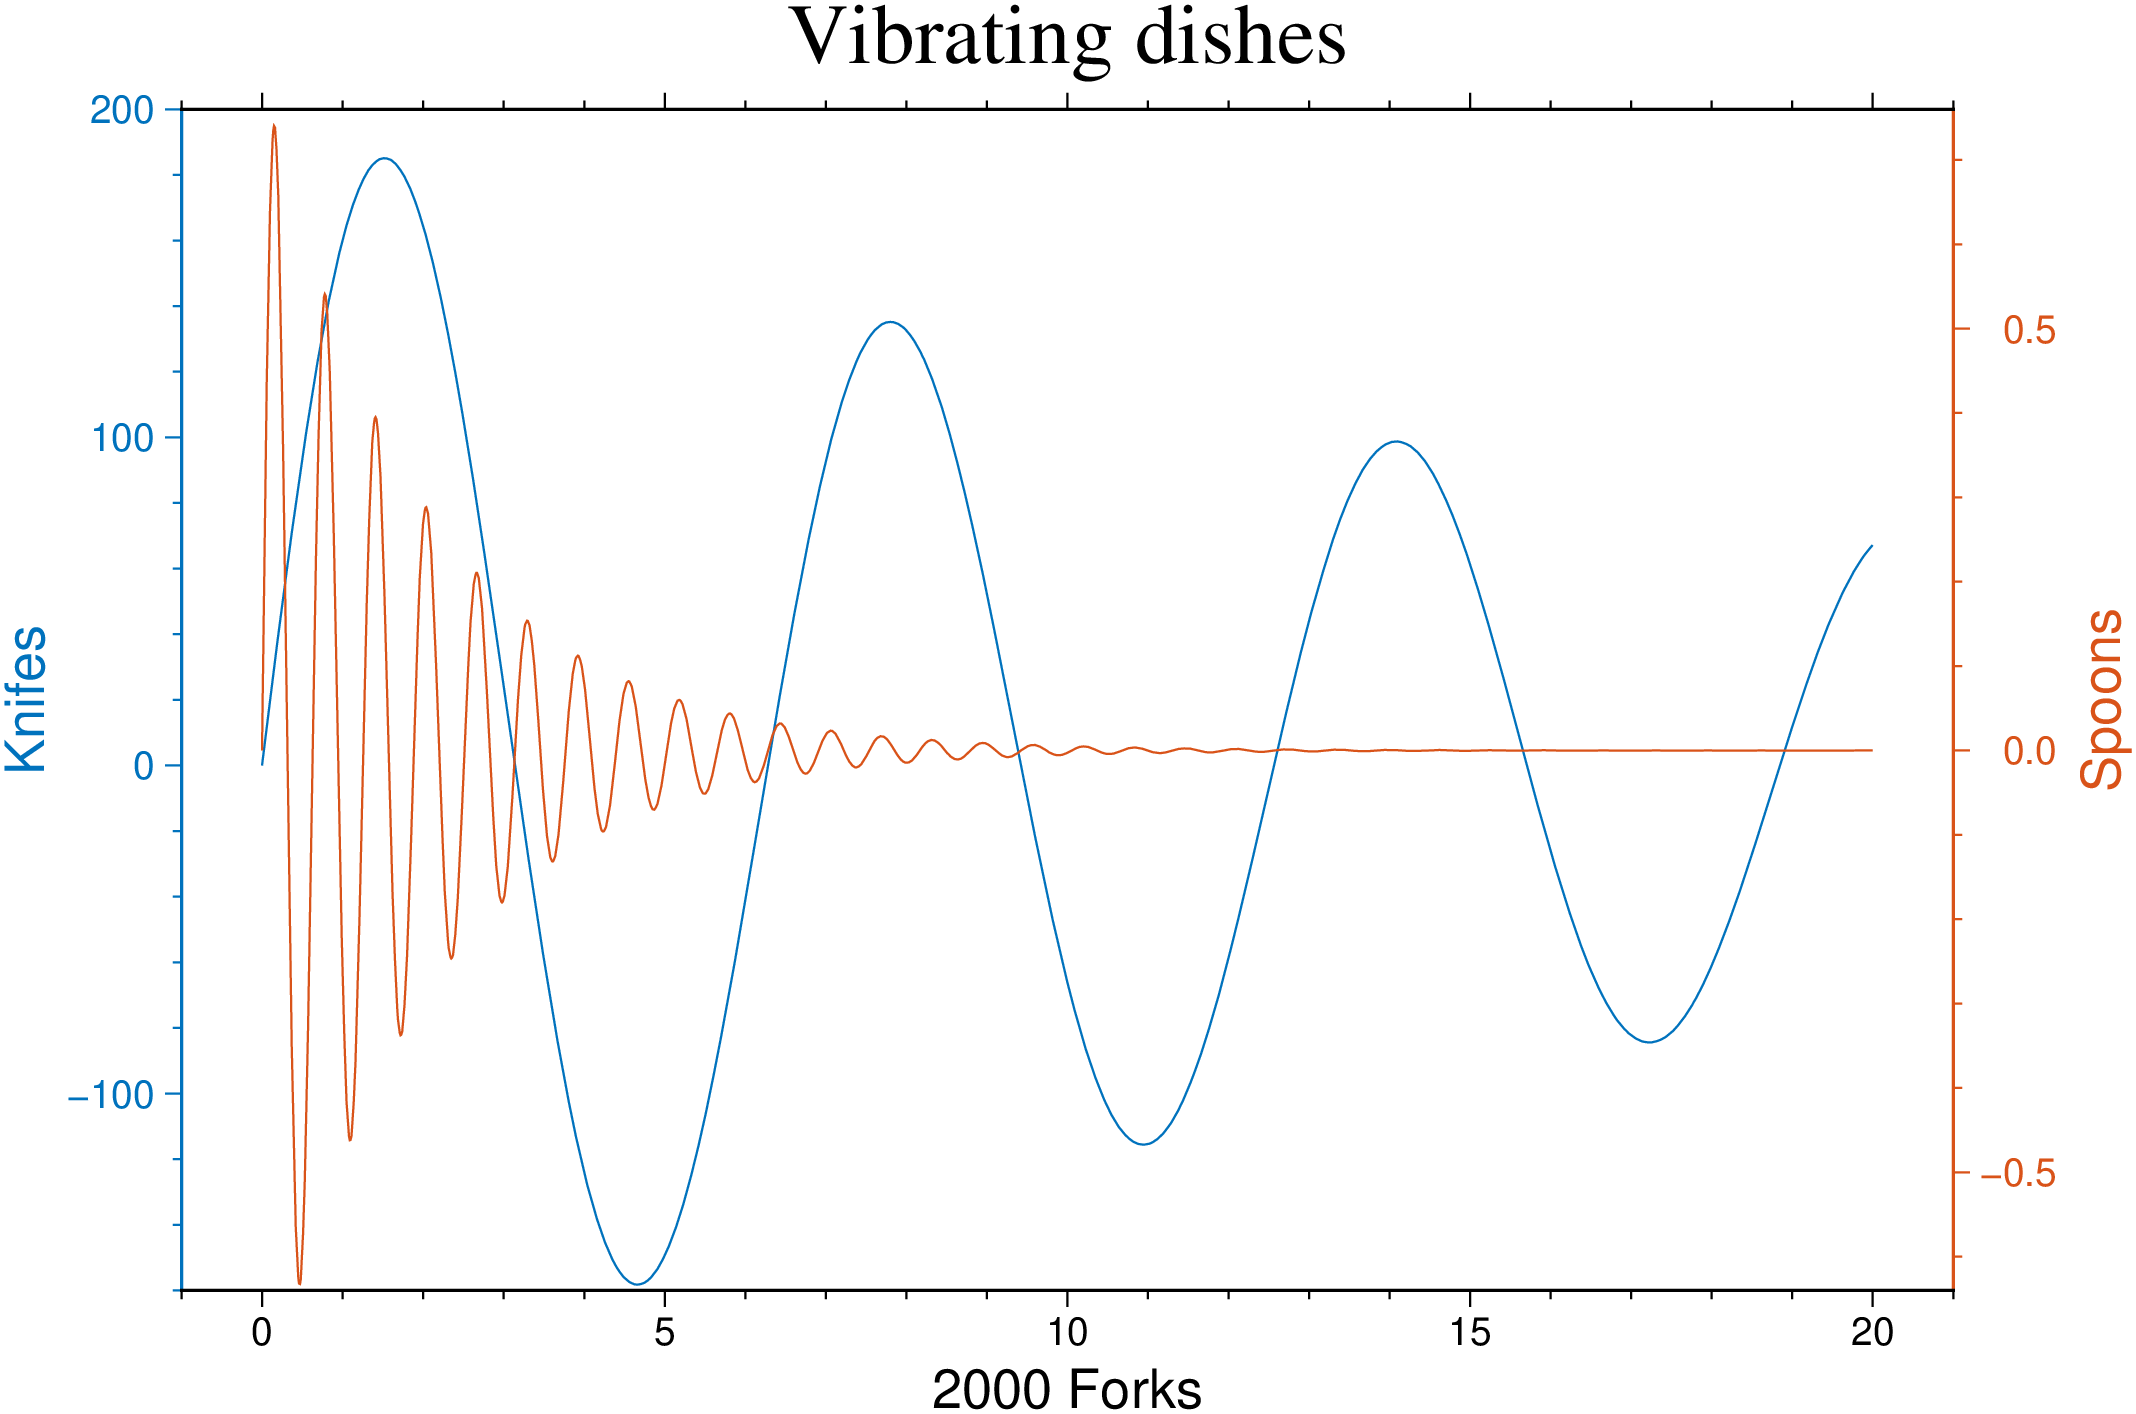
Likewise contourf GMT does not have a plotyy module. A plotyy plot is a one where we plot Y1 versus X1 with y-axis labeling on the left and plots Y2 versus X2 with y-axis labeling on the right. So it's basically a two plots overlain but the details to make it nice can be a bit boring and long.
using GMT
x = 0:0.01:20;
y1 = 200 * exp.(-0.05x) .* sin.(x);
y2 = 0.8 * exp.(-0.5x)  .* sin.(10x);
plotyy(y1, y2, title="Vibrating dishes", ylabel=:Knifes, xlabel=:Forks,
       seclabel=:Spoons, show=true)
Note that to make the command shorter and nicer to read we have used a less known option in GMT. The secondary label of an axes. In this example we also didn't set the xx coordinates so the program plotted from 1 to numbers of points.
In the general case the data has xx coordinates and they don't even need to be the same for Y1 and Y2 (but they need to have a shared interval). In that case we should set the plot limits because otherwise the guessing done from xx,Y1 risk to not capture the total Y1+Y2 extent.
using GMT
x = 0:0.01:20;
y1 = 200 * exp.(-0.05x) .* sin.(x);
y2 = 0.8 * exp.(-0.5x)  .* sin.(10x);
plotyy([x[:] y1[:]], [x[:] y2[:]], title="Vibrating dishes",
ylabel=:Knifes, xlabel="2000 Forks", seclabel=:Spoons, show=1)These docs were autogenerated using GMT: v1.30.0

