earthtide
earthtide(; kwargs...)Compute grids or time-series of solid Earth tides.
Description
Compute the three components of solid Earth tides as time-series or grids. Optionally compute also Sun and Moon position in (lon, lat). The output can be either in the form of a grid or as a table printed to standard output. The format of the table data is: time north east vertical in units of meters.
Arguments
G or grid or outgrid : – outgrid="name"
Write one or more tide component directly to grid files. If more than one component are specified via components then outgrid must contain the format flag %s so that we can embed the component code in the file names (n for north; e for east and v for vertical). If only one component is selected with components than no code is appended to grid name (and no need to set the format flag %s). The grid(s) are computed at the time set by range, if that option is used, or at the now time calculated in UTC from the computer clock. NOTE that when returning the grid(s) to the Julia workspace this option should not be used. It is enough to set variable names as left-hand-side arguments. The grid(s) will be returned as a GMTgrid object(s).S or sun_moon : – sun_moon=true
Output position of Sun and Moon in geographical coordinates plus distance in meters. Output is a Mx7 matrix where M is the number of times (set by range) and columns are time, sunlon, sunlat, sundist moonlon, moonlat, moondistL or location : – location=(lon,lat)
Geographical coordinate of the location where to compute a time-series. Coordinates are geodetic (ellipsoidal) latitude and longitude. GRS80 ellipsoid is used. (Which can be considered equivalent to the WGS84 ellipsoid at the sub-millimeter level.)C or components : – components="x|e,y|n,z|v"
Select which component(s) to compute in individual grid(s). When returning the grid to Julia workspace, only one component can be selected (e.g. component="e" to compute the East component). To save grids on files outgrid must be set. Append comma-separated codes for available components: x or e for the east component; y or n for the north component; and z or v for the vertical component. For example, C=e,v, will write 2 grids. One with east and other with the vertical components. If outgrid is set but not components then the default is to compute the vertical component.
I or inc or increment or spacing : – inc=x_inc | inc=(xinc, yinc) | inc="xinc[+e|n][/yinc[+e|n]]"
Specify the grid increments or the block sizes. More at spacing
R or region or limits : – limits=(xmin, xmax, ymin, ymax) | limits=(BB=(xmin, xmax, ymin, ymax),) | limits=(LLUR=(xmin, xmax, ymin, ymax),units="unit") | ...more
Specify the region of interest. More at limits. For perspective view view, optionally add zmin,zmax. This option may be used to indicate the range used for the 3-D axes. You may ask for a larger w/e/s/n region to have more room between the image and the axes.
T or range : – range=(min,max,inc[,"+n"]) | range=[list] | range=file
Make evenly spaced time-steps from min to max by inc. Append +n to indicate inc is the number of t-values to produce over the range instead. Append a valid time unit (d | h | m | s) to the increment. If only min is given then we use that date and time for the calculations. If no range is provided get current time in UTC from the computer clock. If nogrid(s)or sun_moon are provided then range is interpreted to mean compute a time-series at the location specified by location, thus then location becomes mandatory. Whengrid(s)and range, only first time T series is considered. Finally, dates may range from 1901 through 2099.
bo or binary_out : – binary_out=??
Select native binary format for table output. More at
o or outcol : – outcol=??
Select specific data columns for primary output, in arbitrary order. More at
// Couldn't find a file when trying to resolve an input request with relative path: `common_opts/opt_r`. //
U or time_stamp : – time_stamp=true | time_stamp=(just="code", pos=(dx,dy), label="label", com=true)
Draw GMT time stamp logo on plot. More at timestamp
V or verbose : – verbose=true | verbose=level
Select verbosity level. More at verbose
Examples
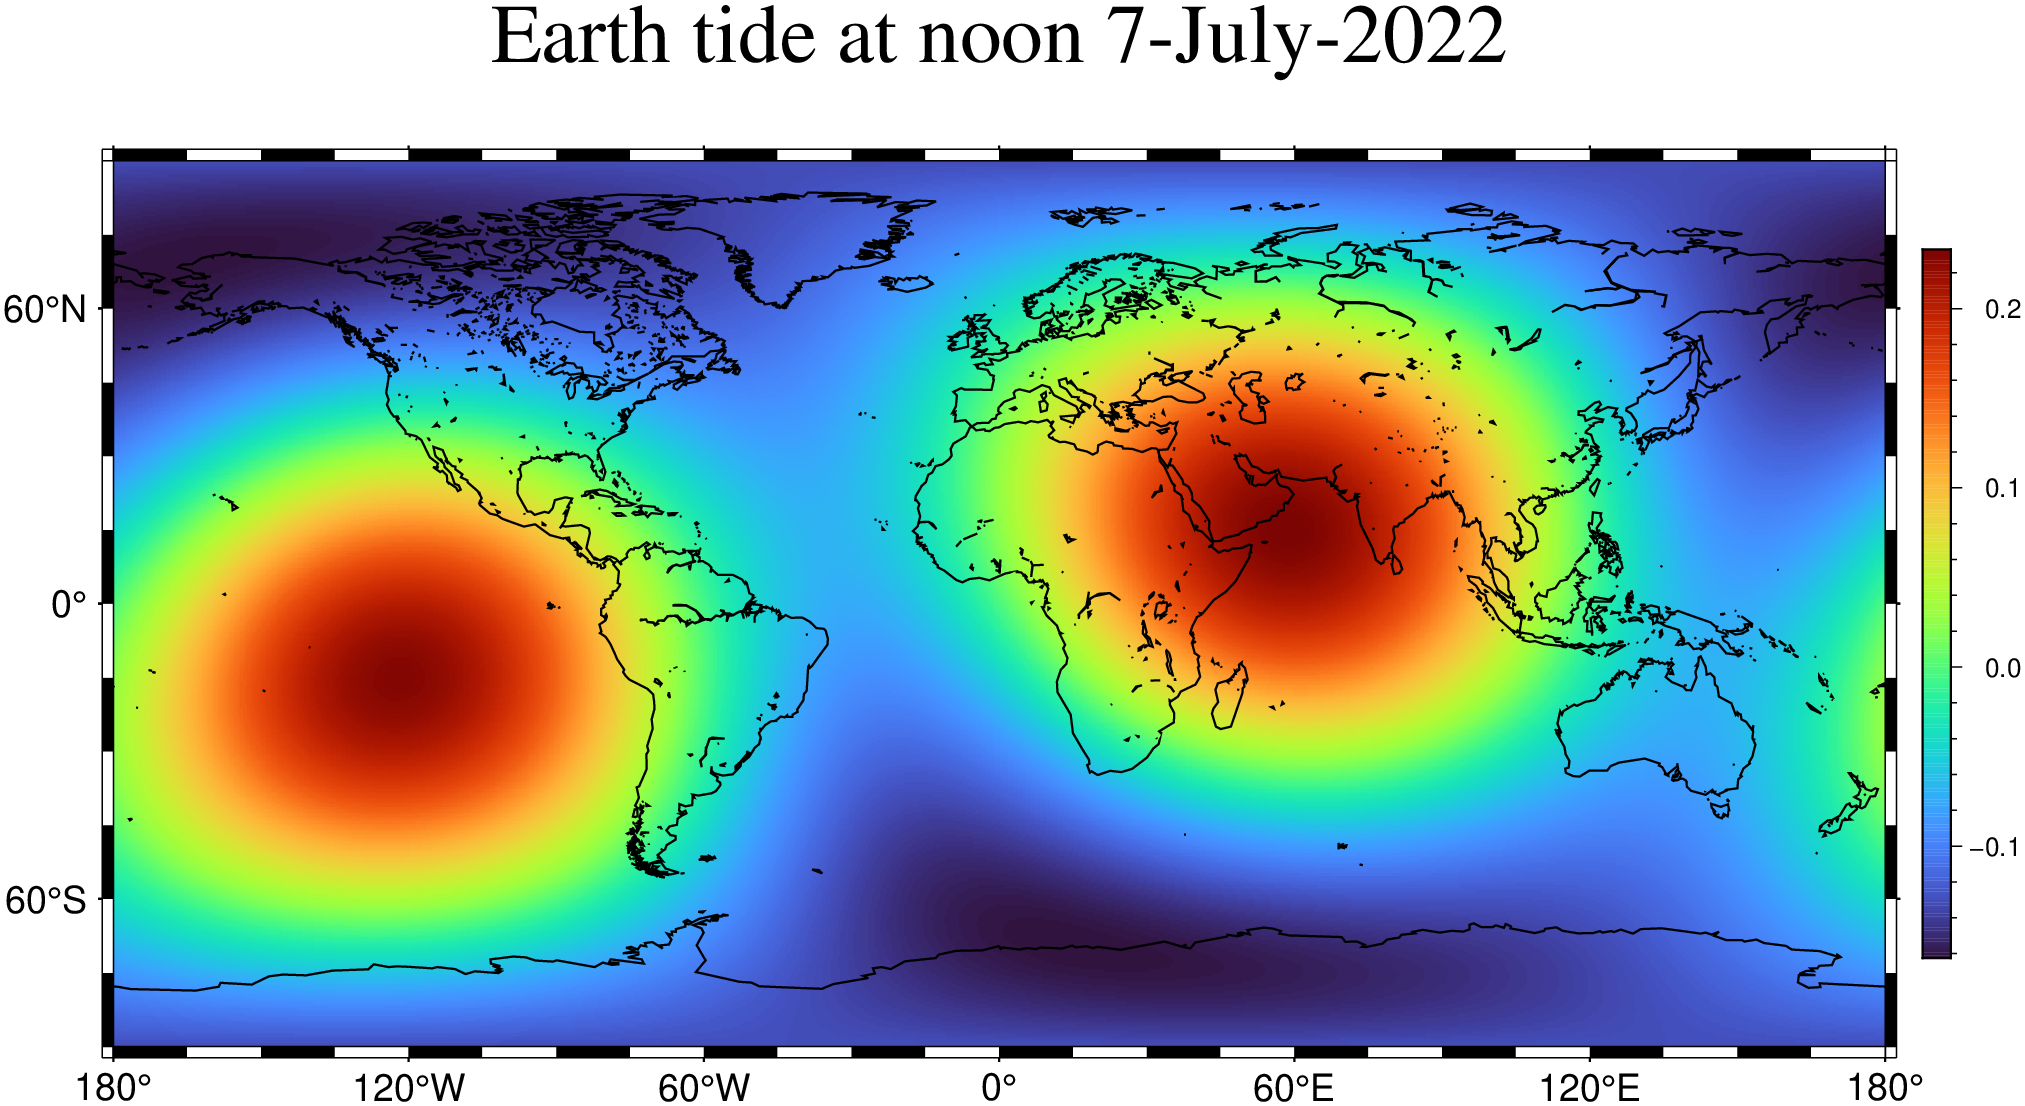
To compute a global grid of the vertical component with a grid step of 30m at noon of 18 Jun 2018, (note: we are using the defaults for region and inc) try
using GMT

G = earthtide(range="2018-06-18T12:00:00");
viz(G, coast=true, colorbar=true, title="Earth tide at noon 7-July-2022")
To obtain a one day long time-series, starting at same date, at the -7 W, 37 N and 1 minute interval, try
D_st = earthtide(range="2018-06-18T/2018-06-19T/1m", location=(-7,37));

Attribute table
┌─────────┐
│ Timecol │
├─────────┤
│       1 │
└─────────┘
BoundingBox: [1.52928e9, 1.5293664e9, -0.055276516851621674, -0.0036339665716482207, -0.045788605358317365, 0.04073662523448053, -0.12387708915816655, 0.17011740397714592]

1441×4 GMTdataset{Float64, 2}
 Row │                Time        East         North   Vertical
─────┼──────────────────────────────────────────────────────────
   1 │ 2018-06-18T00:00:00  -0.0220331   0.014779     -0.120817
   2 │ 2018-06-18T00:01:00  -0.0222226   0.0149741    -0.120428
   3 │ 2018-06-18T00:02:00  -0.0224126   0.0151673    -0.120035
...
The get the Sun and Moon position in geographical coordinates at the now time
D = earthtide(sun_moon=true);Notes
#. All times, both input and output, are in UTC.
References
http://geodesyworld.github.io/SOFTS/solid.htm
These docs were autogenerated using GMT: v1.33.1