Legends
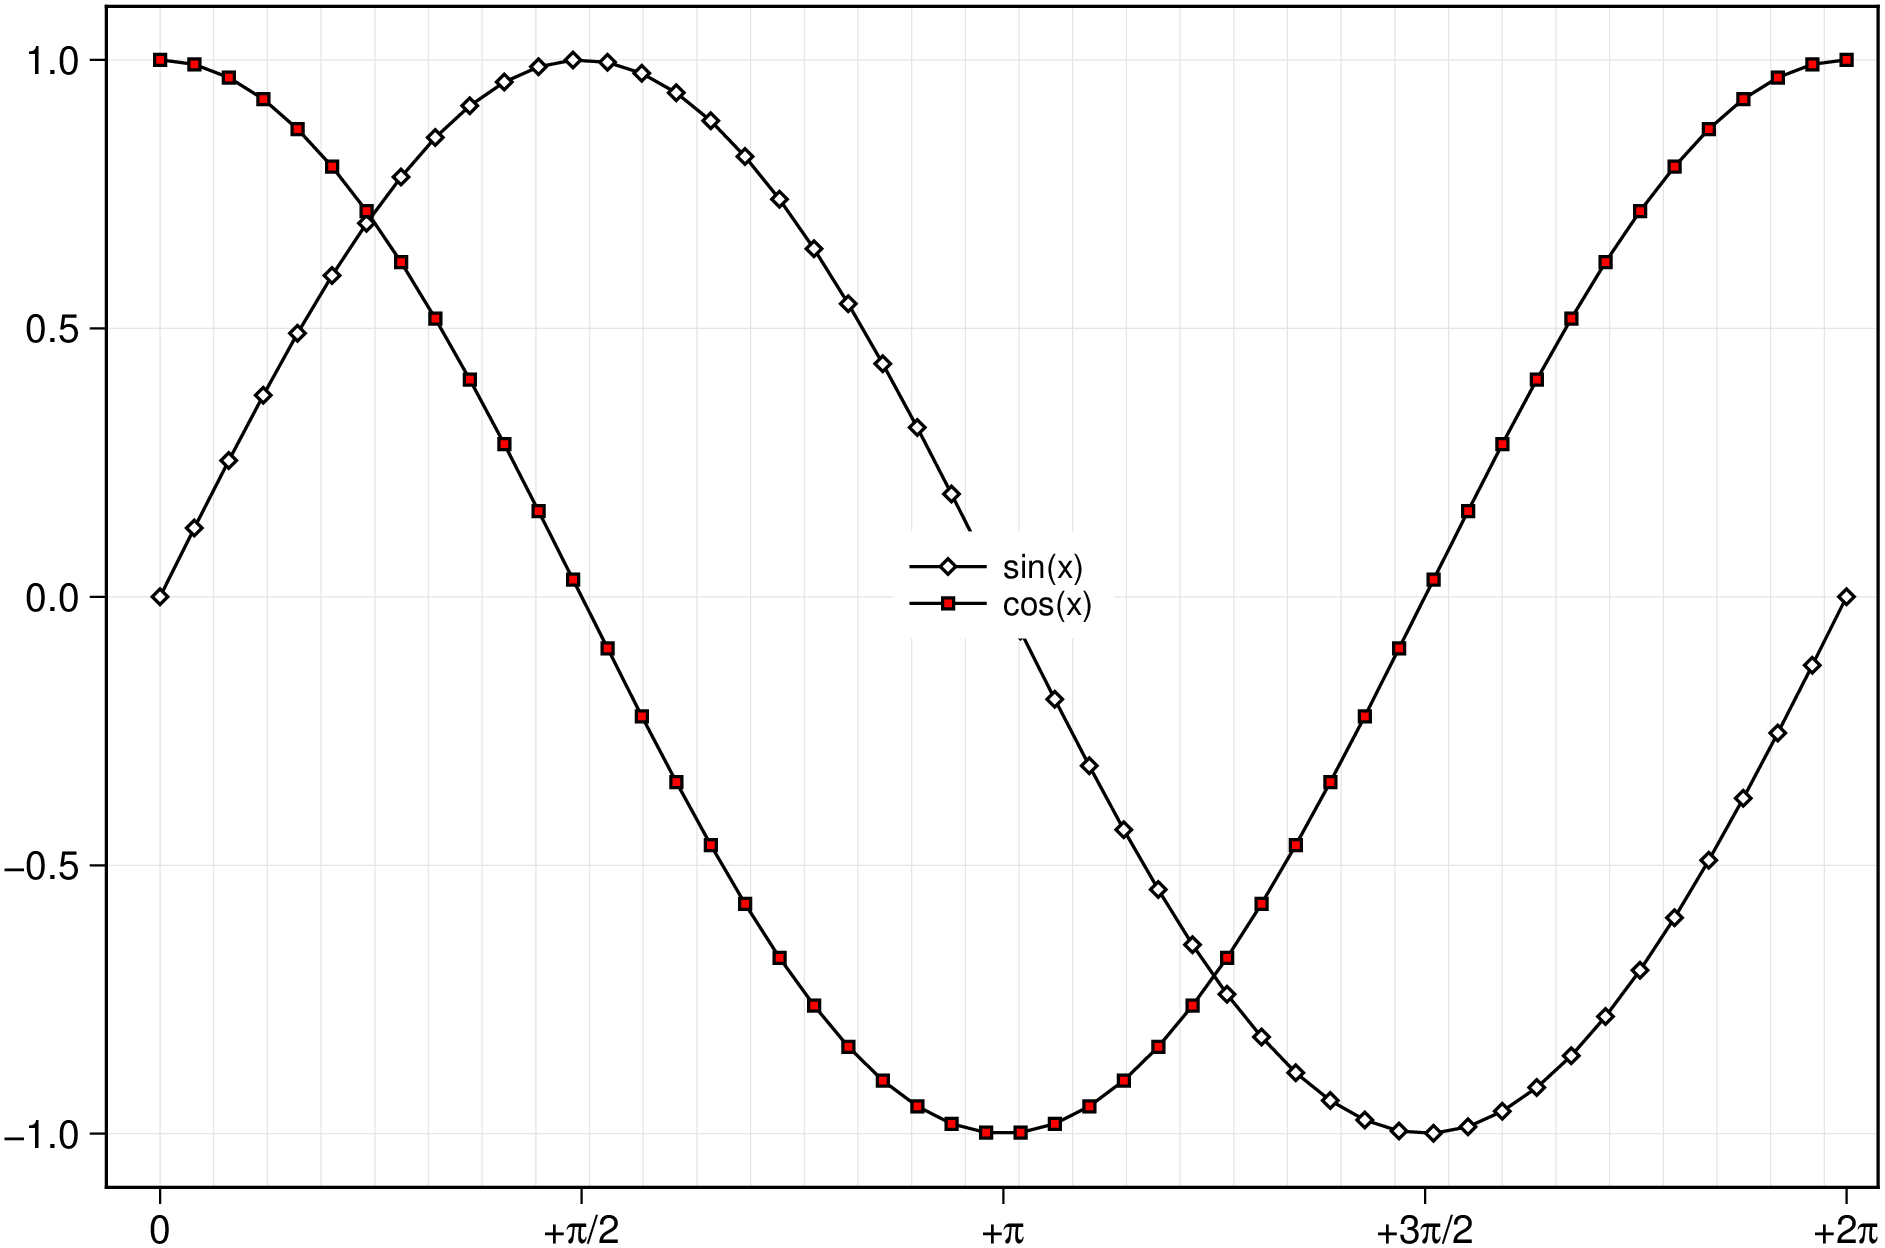
Legend example using the classic mode. In this example we show the two ways in which the legend option can be used. First one is only legend="Bla" and in the second one, argument as a NamedTuple, we set more detailed instructions about the legend.
using GMT
x = linspace(0,2π,50);
lines(x,  sin.(x), ls="lineDiamond", legend="sin(x)", grid=(pen="gray90",), theme=("A2"), xaxis=(annot="pi2",))
lines!(x, cos.(x), ls="linesquare",  legend=(label="cos(x)", pos=:MiddleCenter, box=:none), mc=:red, show=true)
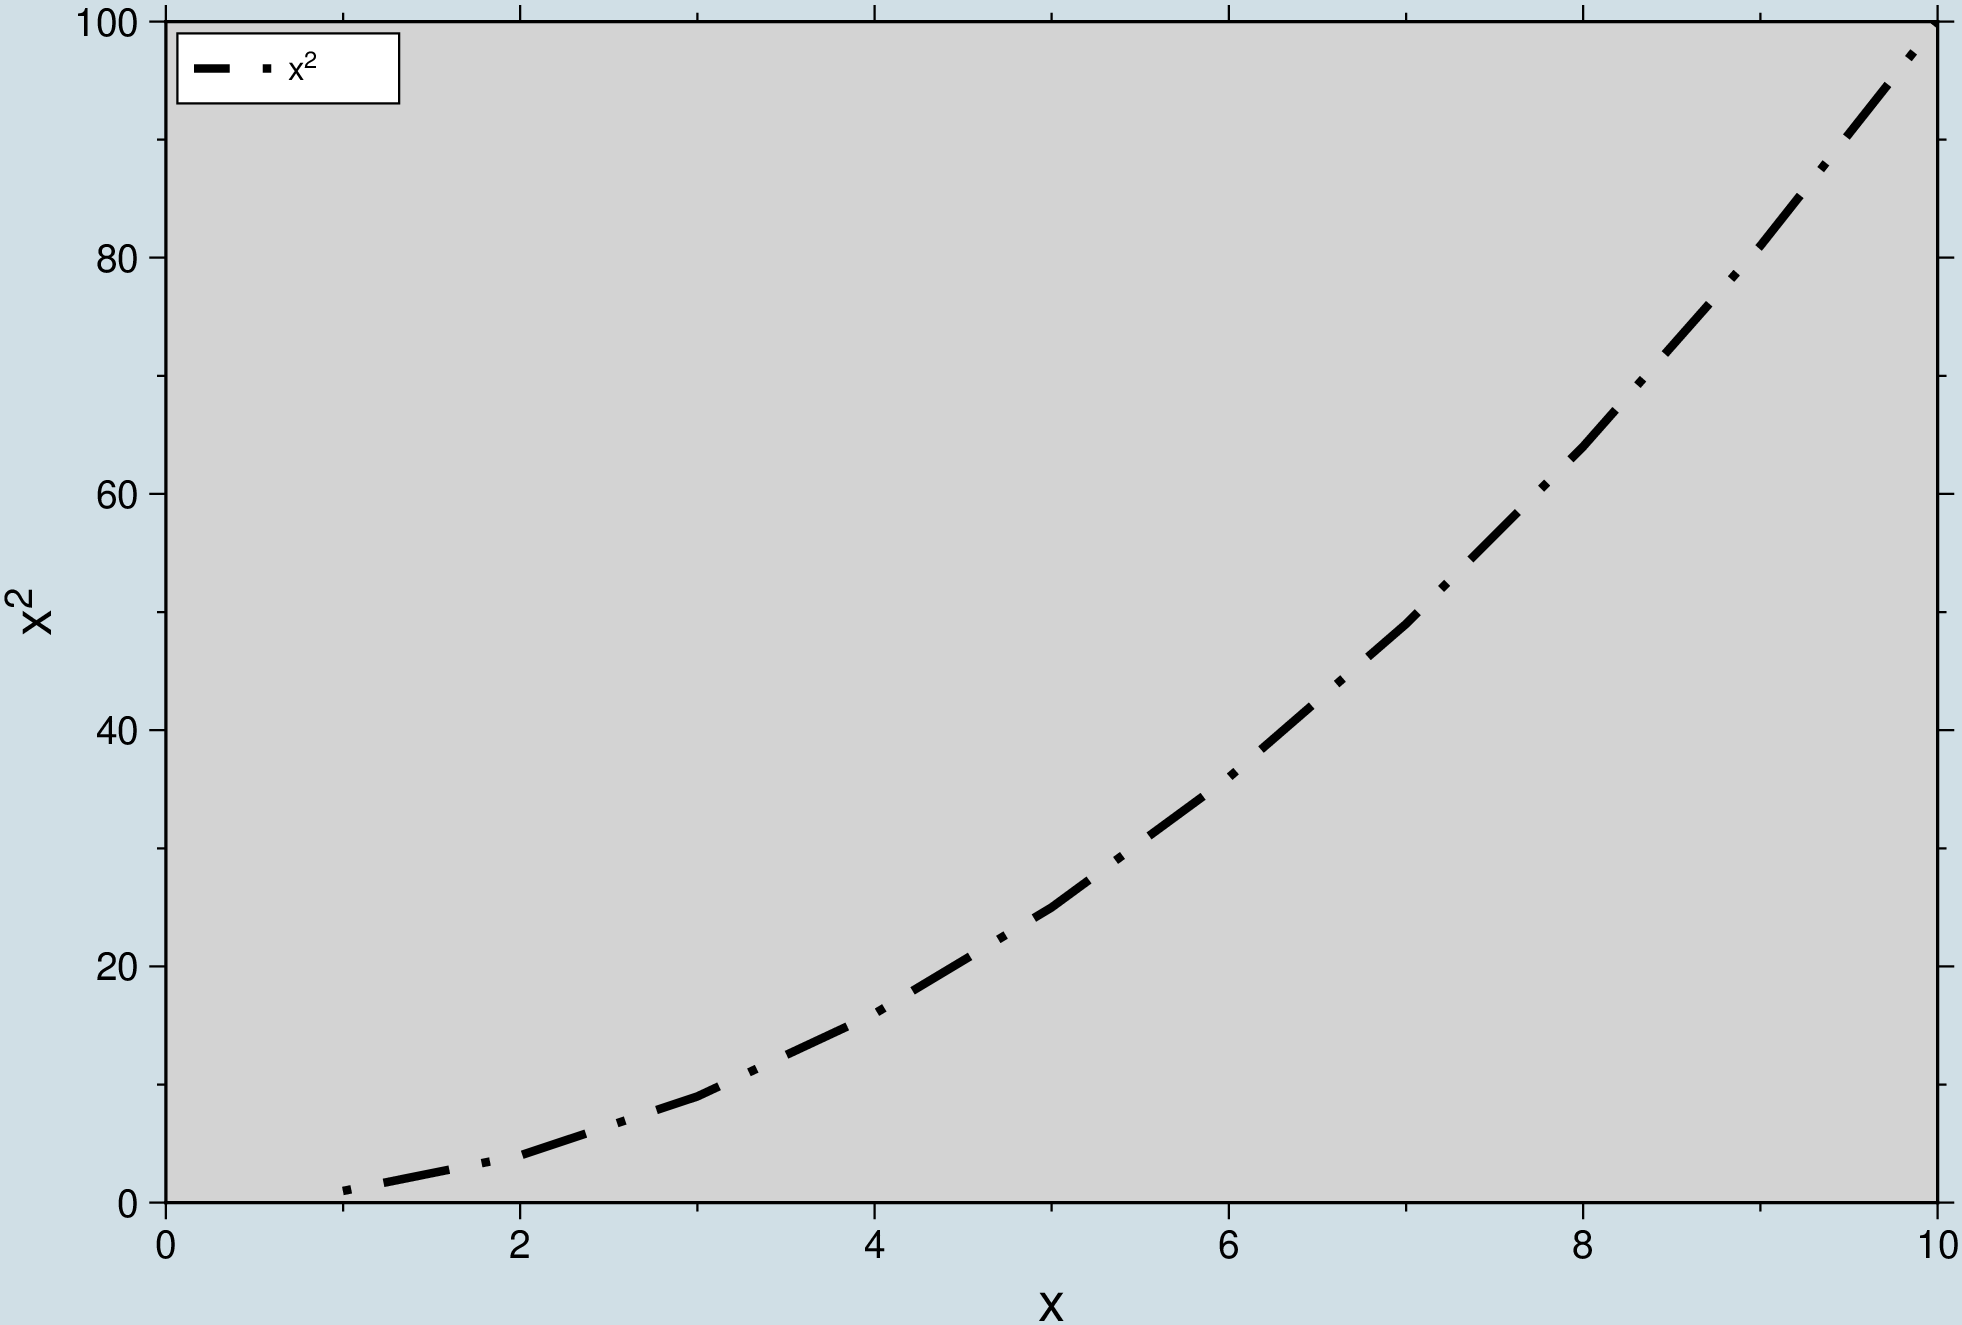
With different page and frame colors filling
We can set the frame filling color in any of the frame, xaxis or yaxis option, and the frame and page colors can be different. Use this fact to show a equation in a legend.
using GMT
x = 1:10
lines(x, x.^2, limits=(0,10,0,100), linewidth=2, linestyle=".-", pagecolor="#D0DFE6FF",
      xaxis=(xlabel="x", bgcolor=:lightgray), ylabel="x@+2@+", legend=(label="x@+2@+", pos=:LT), show=true)
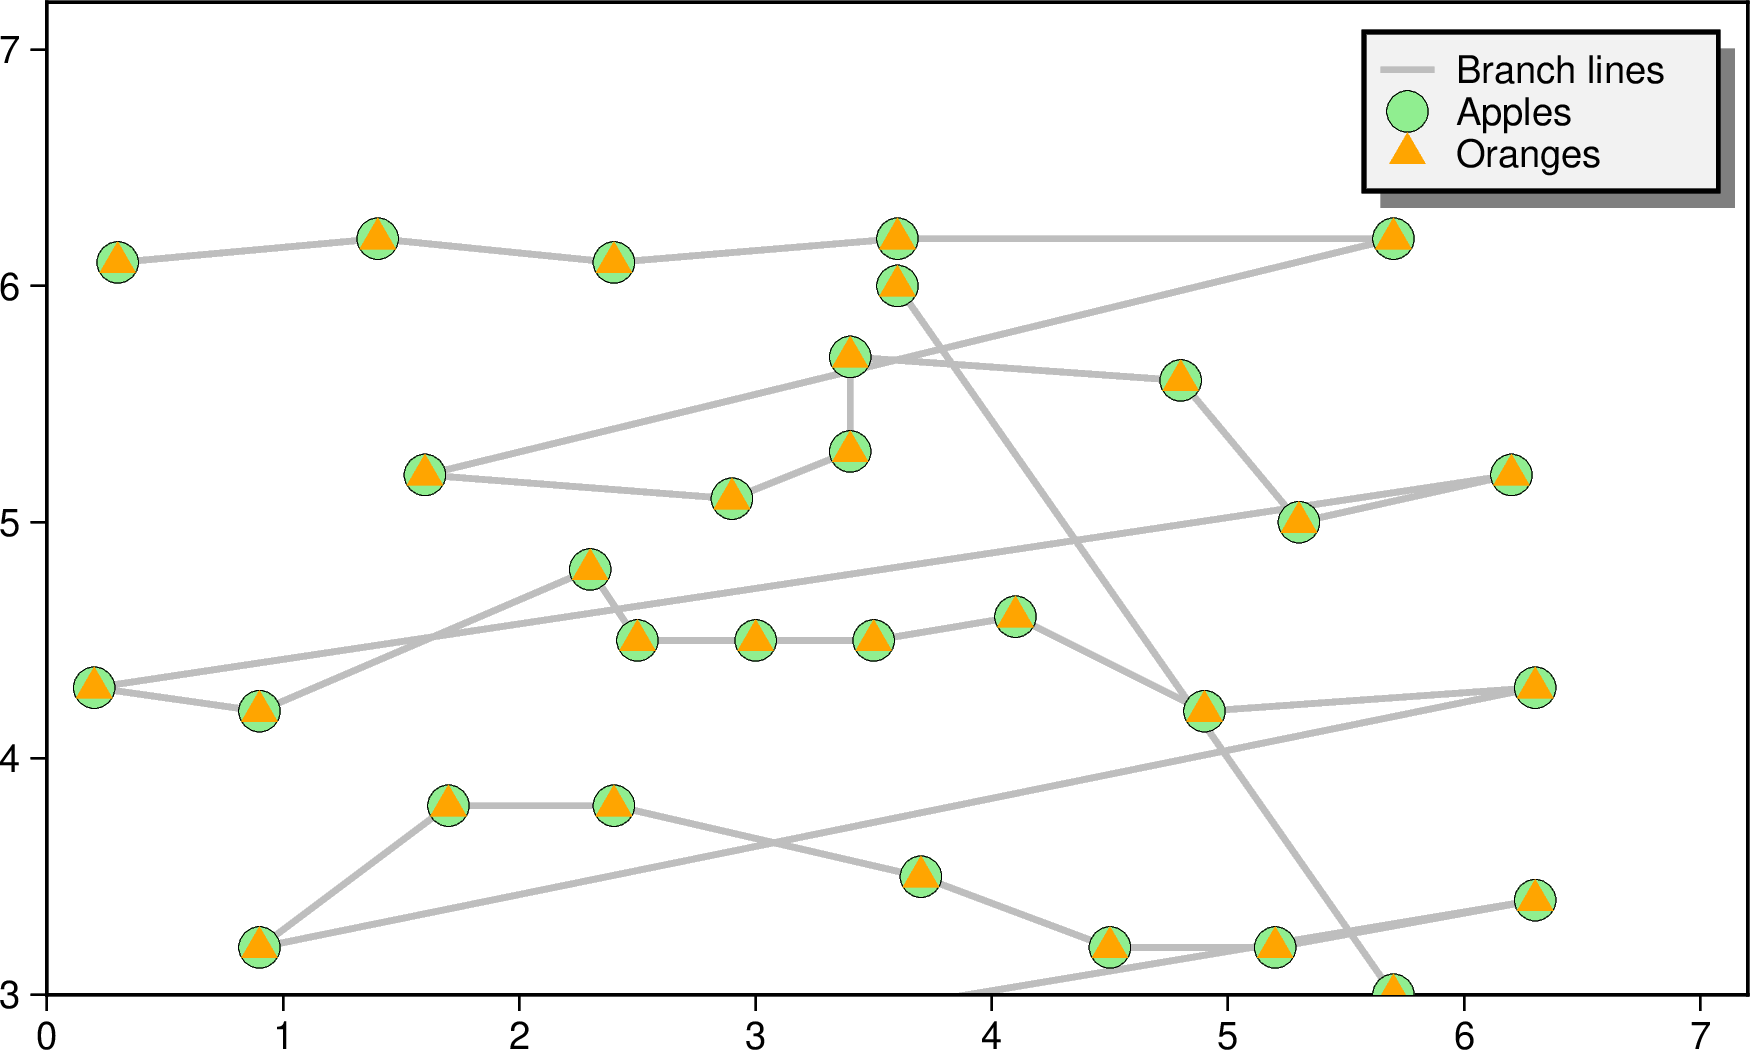
Apples & Oranges
The legend method can automatically create a legend for symbols plotted using plot. Legend entries are only created when the legend option is used (but see also the legend module.)
using GMT
gmtbegin()
	plot("@Table_5_11.txt", region=[0., 7.2, 3, 7.2], figscale=2, pen=(1.5, :gray),
	     legend="Branch lines", frame=:a)
	plot("@Table_5_11.txt", marker=:circle, markersize=0.35, markercolor="lightgreen",
	     markerline="faint", legend="Apples")
	plot("@Table_5_11.txt", marker=:triangle, ms=0.35, fill="orange", legend="Oranges")
	legend(position=(anchor=:TR, width=3, offset=0.25), box=(pen=1, fill="gray95", shaded=true))
gmtend(:show)
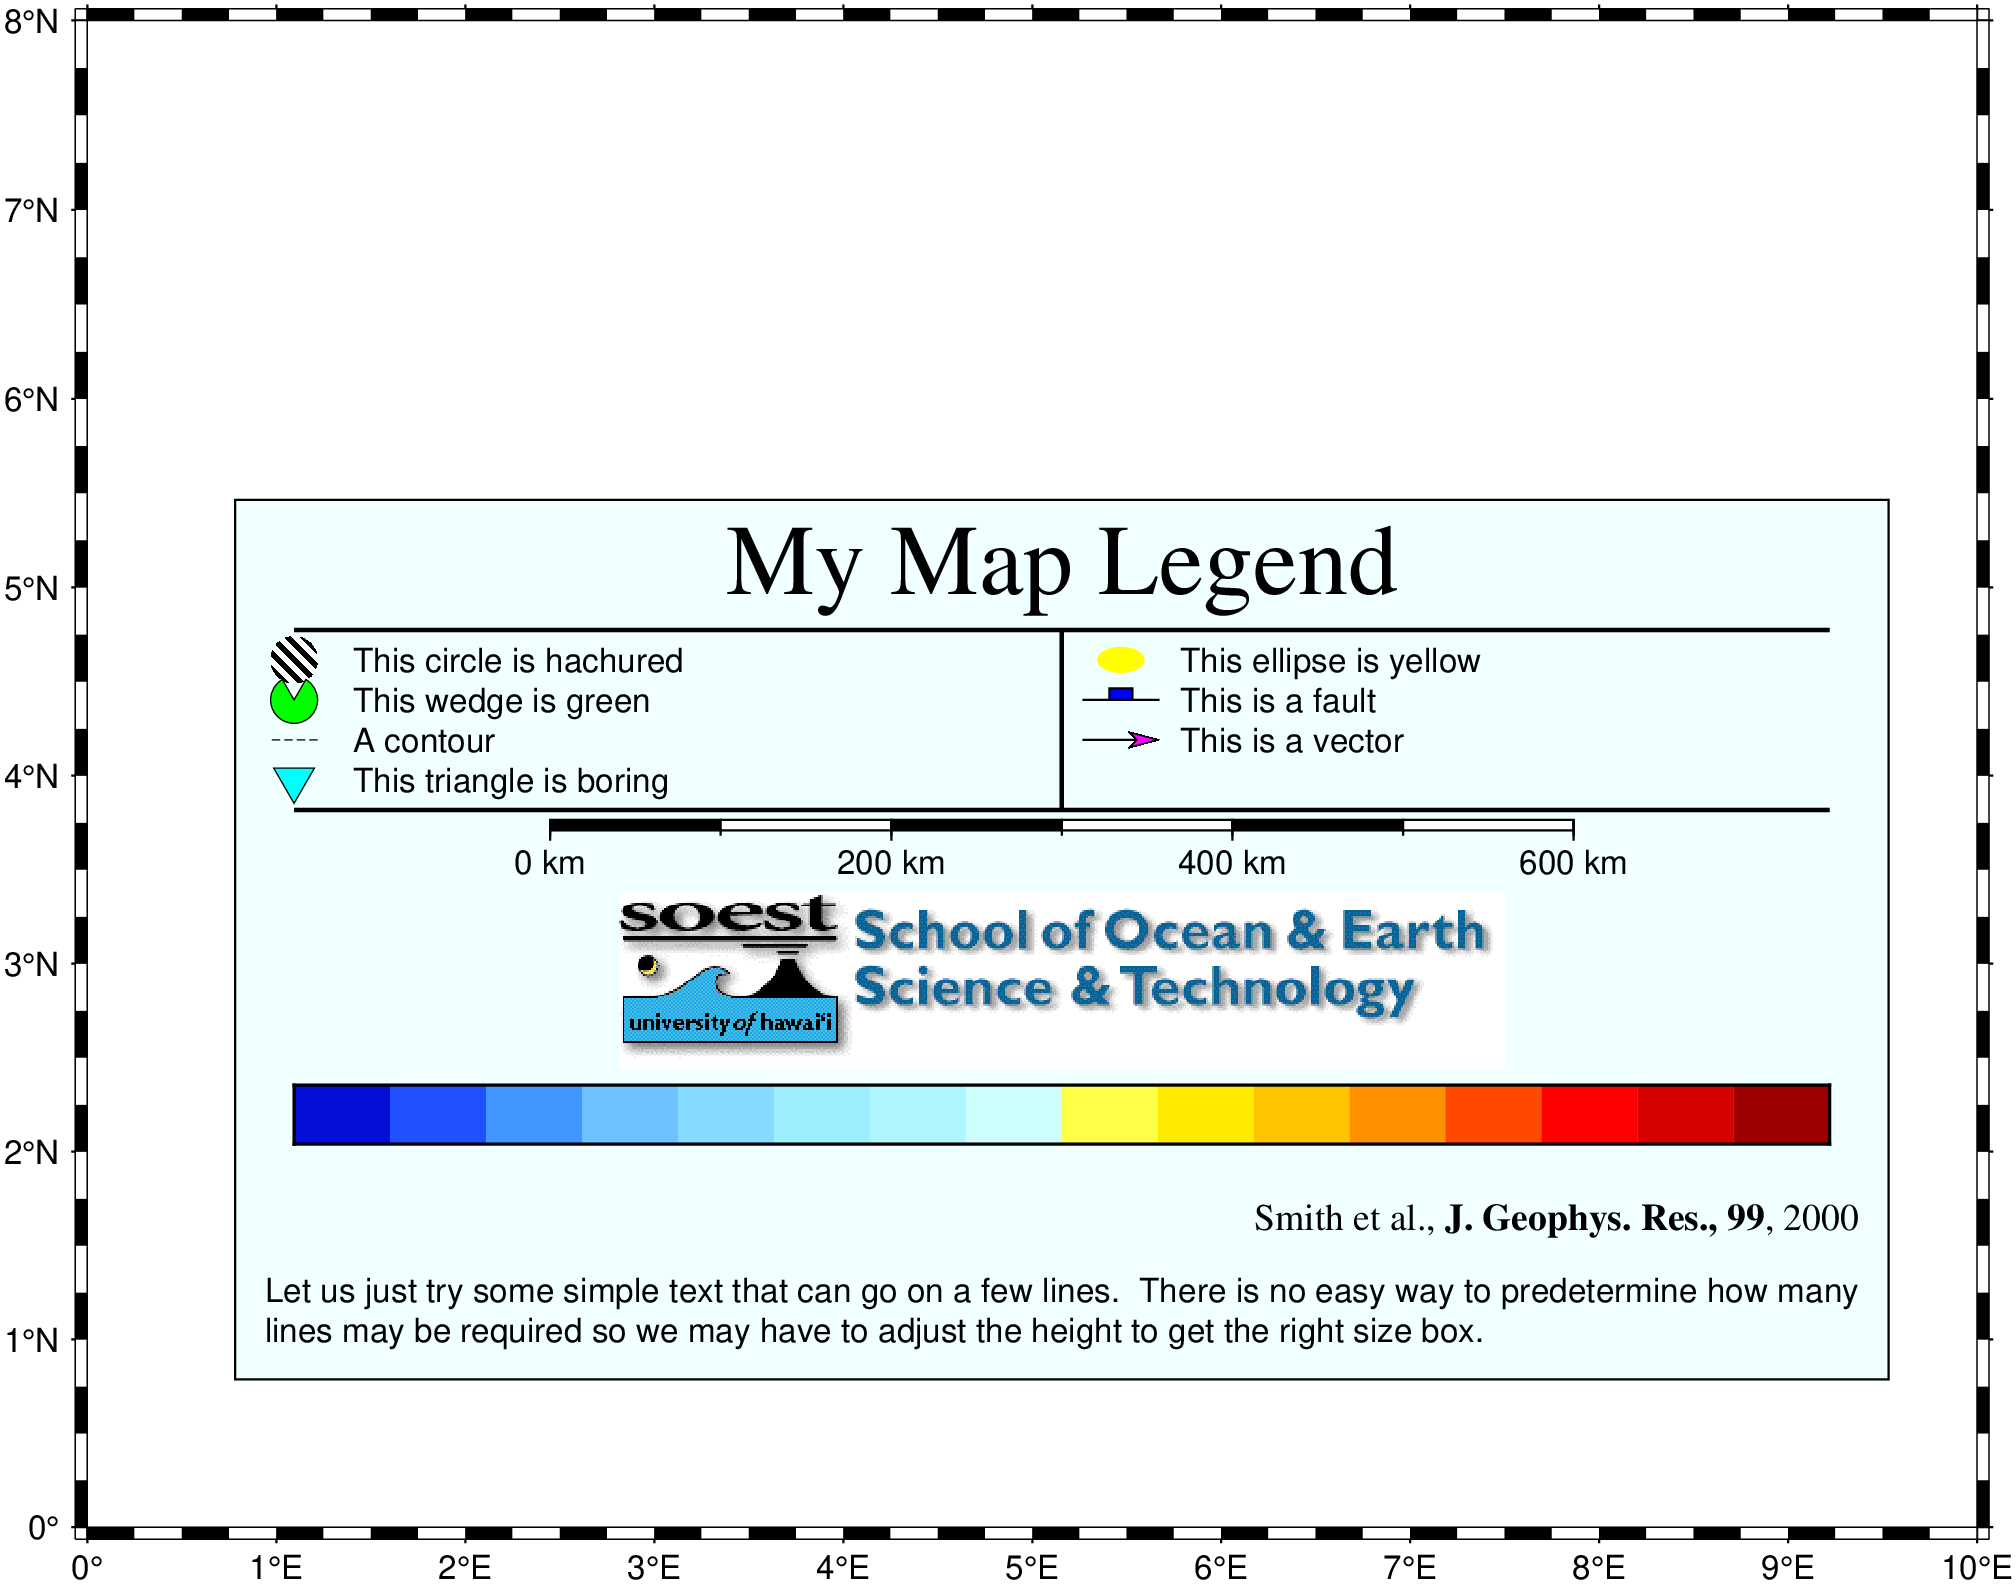
A more complex example using the legend module.
using GMT
makecpt("-Cpanoply -T-8/8 > tt.cpt")

legend((
        vspace=-0.25,
        header=(text="My Map Legend", font=(24,"Times-Roman")),
        hline=(pen=1, offset=0.5),
        ncolumns=2,
        vline=(pen=1, offset=0),
        symbol1=(marker=:circ,    size=0.4, dx_left=0.25, fill="p300/12", dx_right=0.75, text="This circle is hachured"),
        symbol2=(marker=:ellipse, size=0.4, dx_left=0.25, fill=:yellow,   dx_right=0.75, text="This ellipse is yellow"),
        symbol3=(marker=:wedge,   size=0.4, dx_left=0.25, fill=:green, pen=0.25, dx_right=0.75, text="This wedge is green"),
        symbol4=(marker=:fault,   size=0.65,dx_left=0.25, fill=:blue, dx_right=0.75, text="This is a fault"),
        symbol5=(marker="-",      size=0.4, dx_left=0.25, pen=(0.25,:dash), dx_right=0.75, text="A contour"),
        symbol6=(marker=:vector,  size=0.65,dx_left=0.25, fill=:magenta, pen=0.5, dx_right=0.75, text="This is a vector"),
        symbol7=(marker="i", size=0.4, dx_left=0.25, fill=:cyan, pen=0.25, dx_right=0.75, text="This triangle is boring"),
        hline2=(pen=1, offset=0.5),
        vline2=(pen=1, offset=0),
        ncolumns2=1,
        map_scale=(lon=5, lat=5, length="600+u+f"),
        vspace2=0.13,
        image=(width=7.5, fname="@SOEST_block4.png", justify=:CT),
        vspacep3=0.13,
        colorbar=(name="tt.cpt", offset=0.5, height=0.5, extra="-B0"),
        label=(txt="Smith et al., @%5%J. Geophys. Res., 99@%%, 2000", justify=:R, font=(9, "Times-Roman")),
        vspace4=0.25,
        text1="Let us just try some simple text that can go on a few lines. There is no easy way to predetermine",
        text2="how many lines may be required so we may have to adjust the height to get the right size box."
       ),
       region=(0,10,0,8), pos=(paper=(1.25,1.25), width=14, justify=:BL, spacing=1.2),
       clearance=(0.25,0.25), box=(pen=0.5, fill=:azure1),
       figsize=16, proj=:Mercator, show=true
      )
© GMT.jl. Last modified: July 26, 2024. Website built with Franklin.jl and the Julia programming language.
These docs were autogenerated using GMT: v1.16.0