Subplots
See subplot docs
Background images
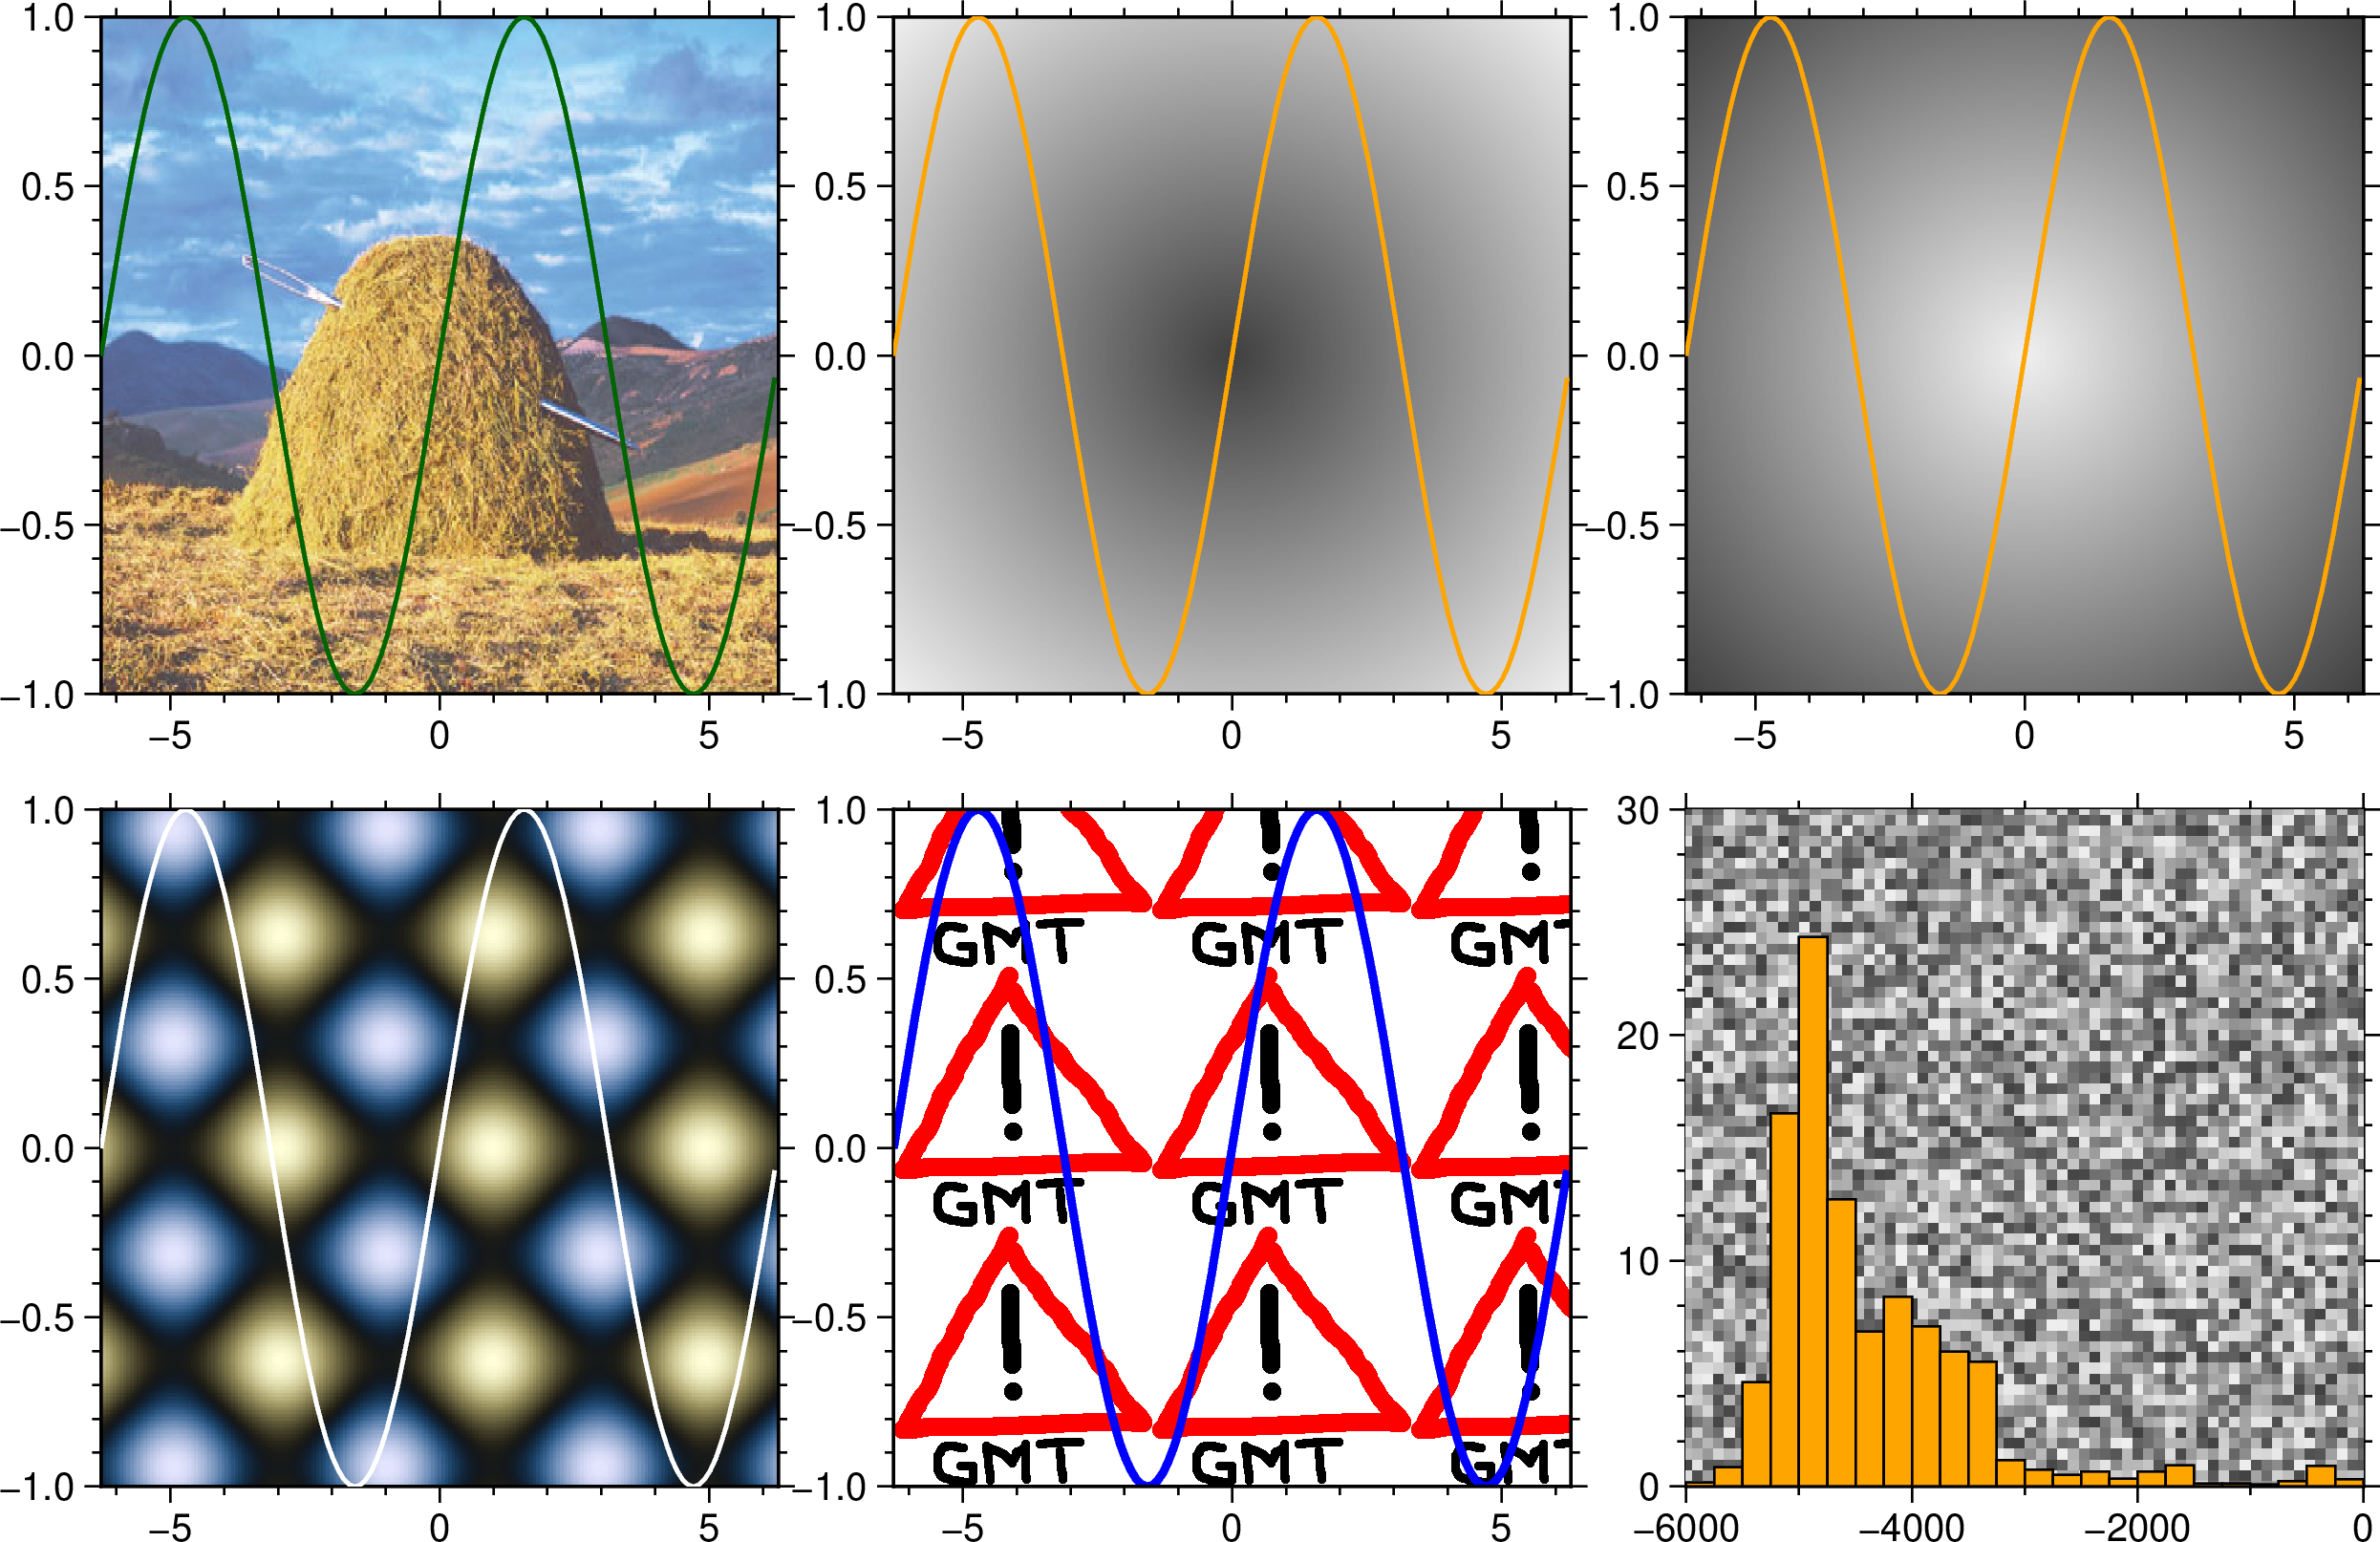
The examples in the panels of this subplot are intended to demonstrate the background option that paints the canvas with either an external figure or one created internally, and which is described in the plot manual. Note that in panel (2,2) we are painting with the frame option bg, which does the fill with a pattern repetition instead of filling with a single image.
using GMT
x = -2π:0.1:2π
subplot(grid="2x3", panels_size=6, region=(-2π, 2π, -1, 1), frame=:WSen, margins=0.2)
	plot(x, sin.(x), lw=1, lc=:darkgreen, bg="@needle.jpg")
	plot(x, sin.(x), lw=1, lc=:orange,    bg=:circ, panel=(1,2))
	plot(x, sin.(x), lw=1, lc=:orange,    bg="-circ", panel=(1,3))
	plot(x, sin.(x), lw=1, lc=:white,     bg=(:eggs, :lisbon), panel=(2,1))
	plot(x, sin.(x), lw=2, lc=:blue,      frame=(bg=(pattern="@warning.png",),), panel=(2,2))
	basemap(region=(-6000,0,0,30), panel=(2,3))
	histogram("@v3206_06.txt", fill=:orange, pen=0.5, kind=(freq=true,), bin=250, bg=mat2grid(rand(64,64)))
subplot(:show)
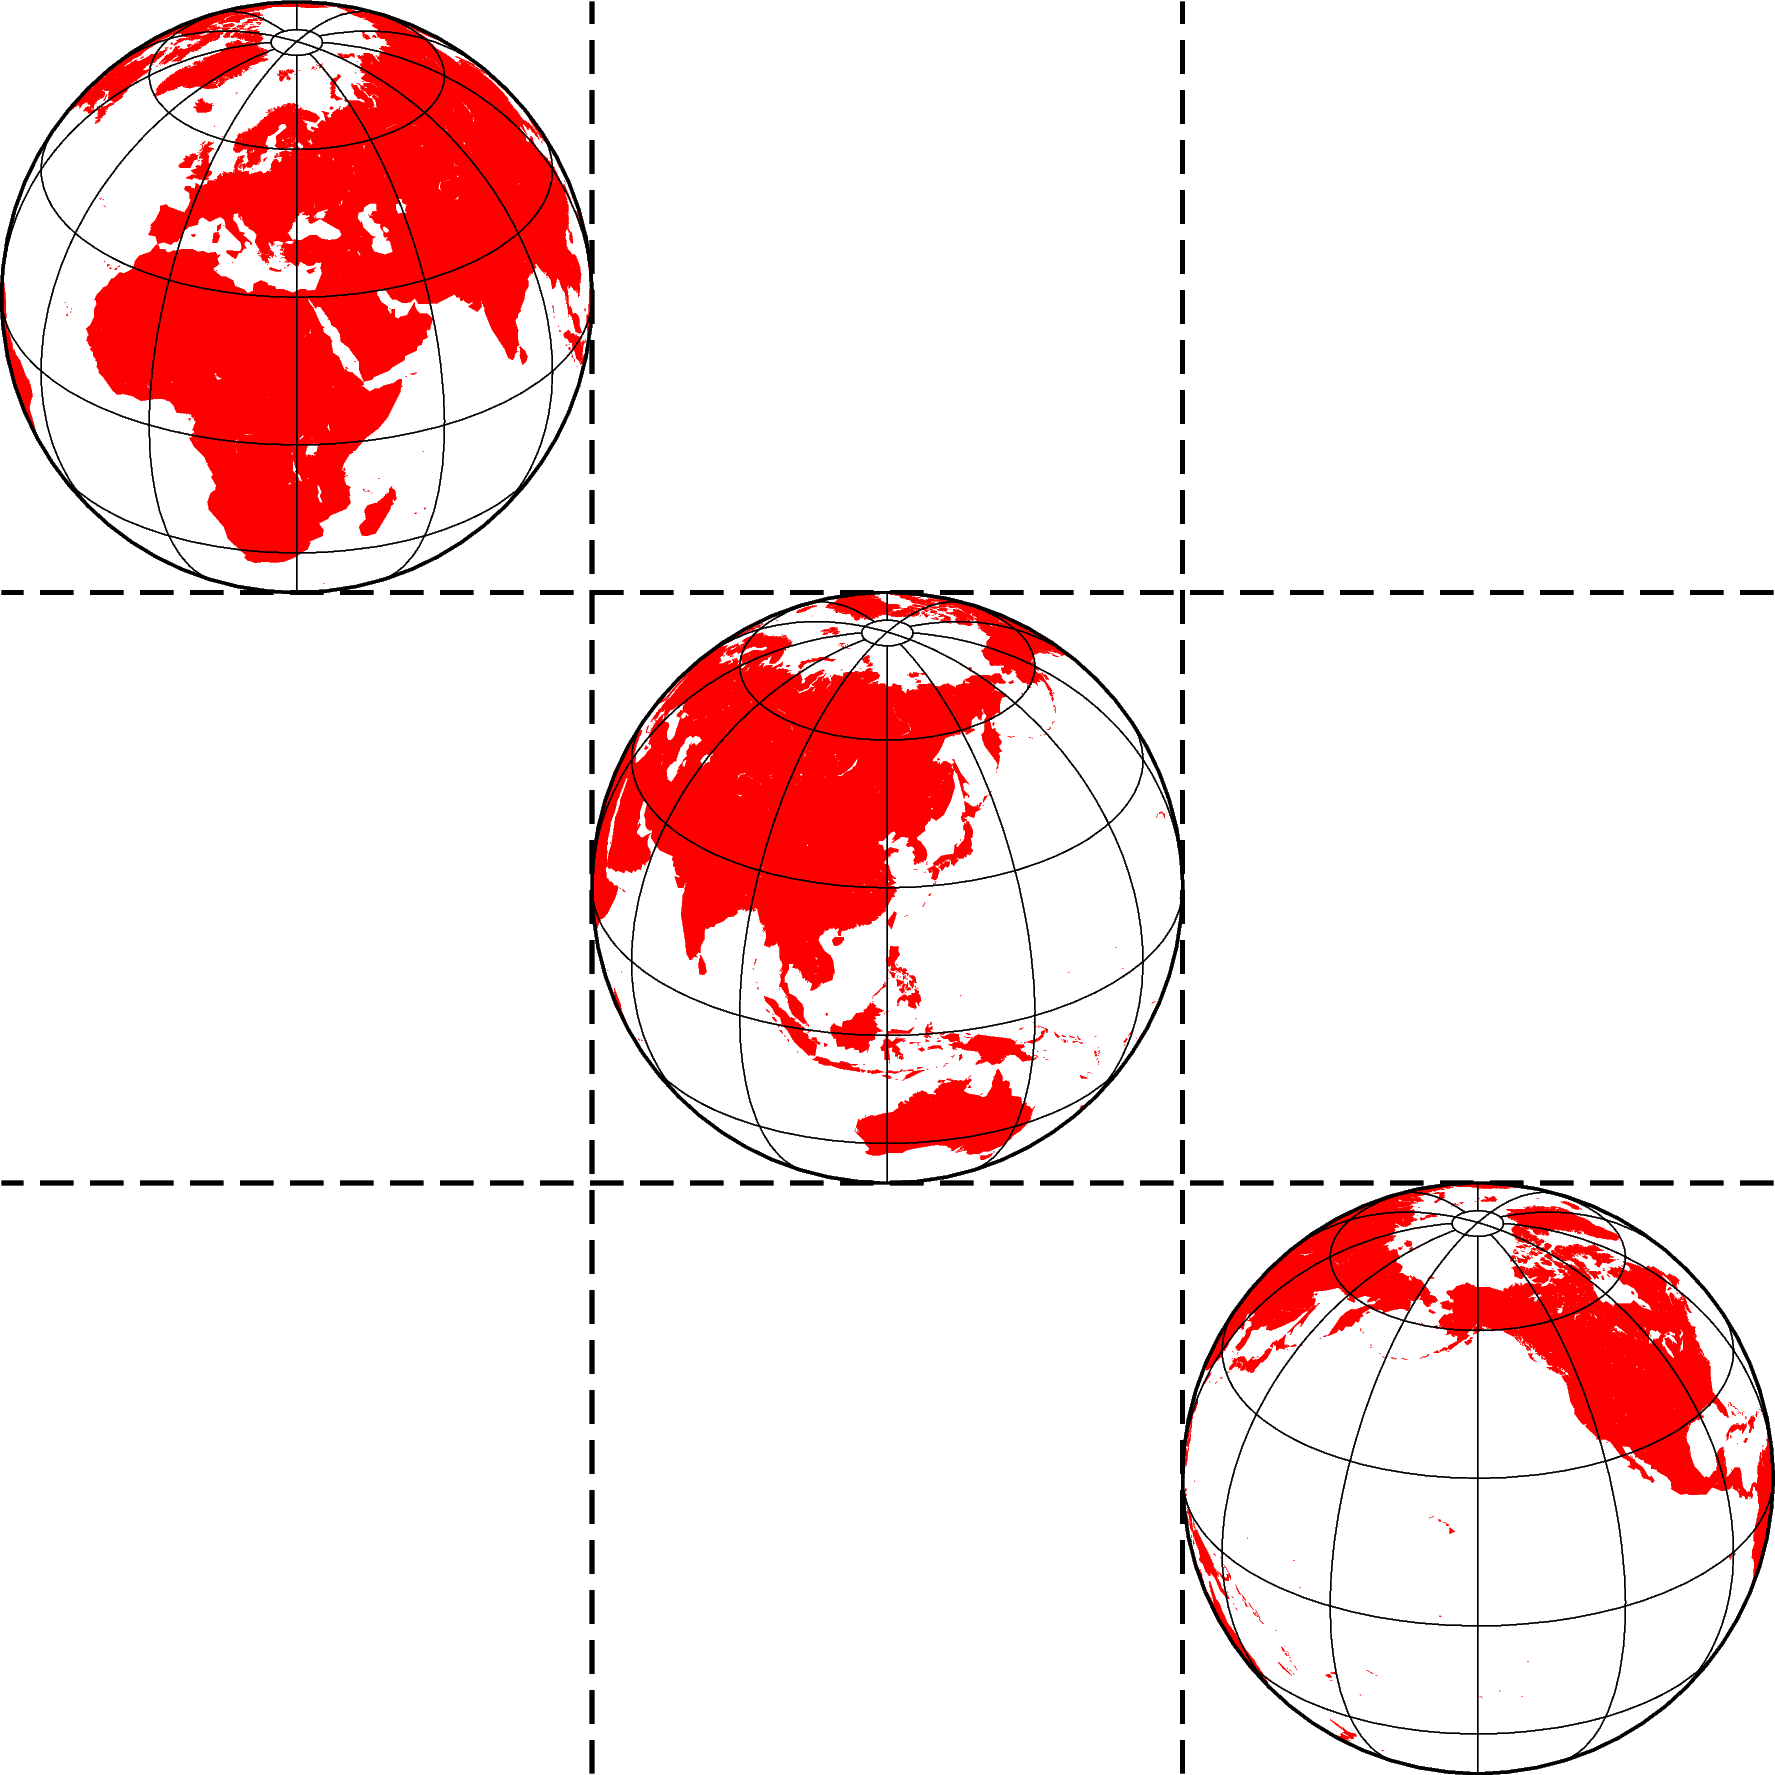
Geo Tic-Tac-Toe
using GMT
subplot(grid="3x3", dims=(panels=(5,),divlines=(1,:dashed)), axes=(axes=:lrbt,), margins=0);
    coast(region=:global, proj=(name=:Ortho, center=(30 ,30)), land=:red, B=:g, panel=(1,1));
    coast(region=:global, proj=(name=:Ortho, center=(120,30)), land=:red, B=:g, panel=(2,2));
    coast(region=:global, proj=(name=:Ortho, center=(210,30)), land=:red, B=:g, panel=(3,3));
subplot(:show)
Side histograms
using GMT
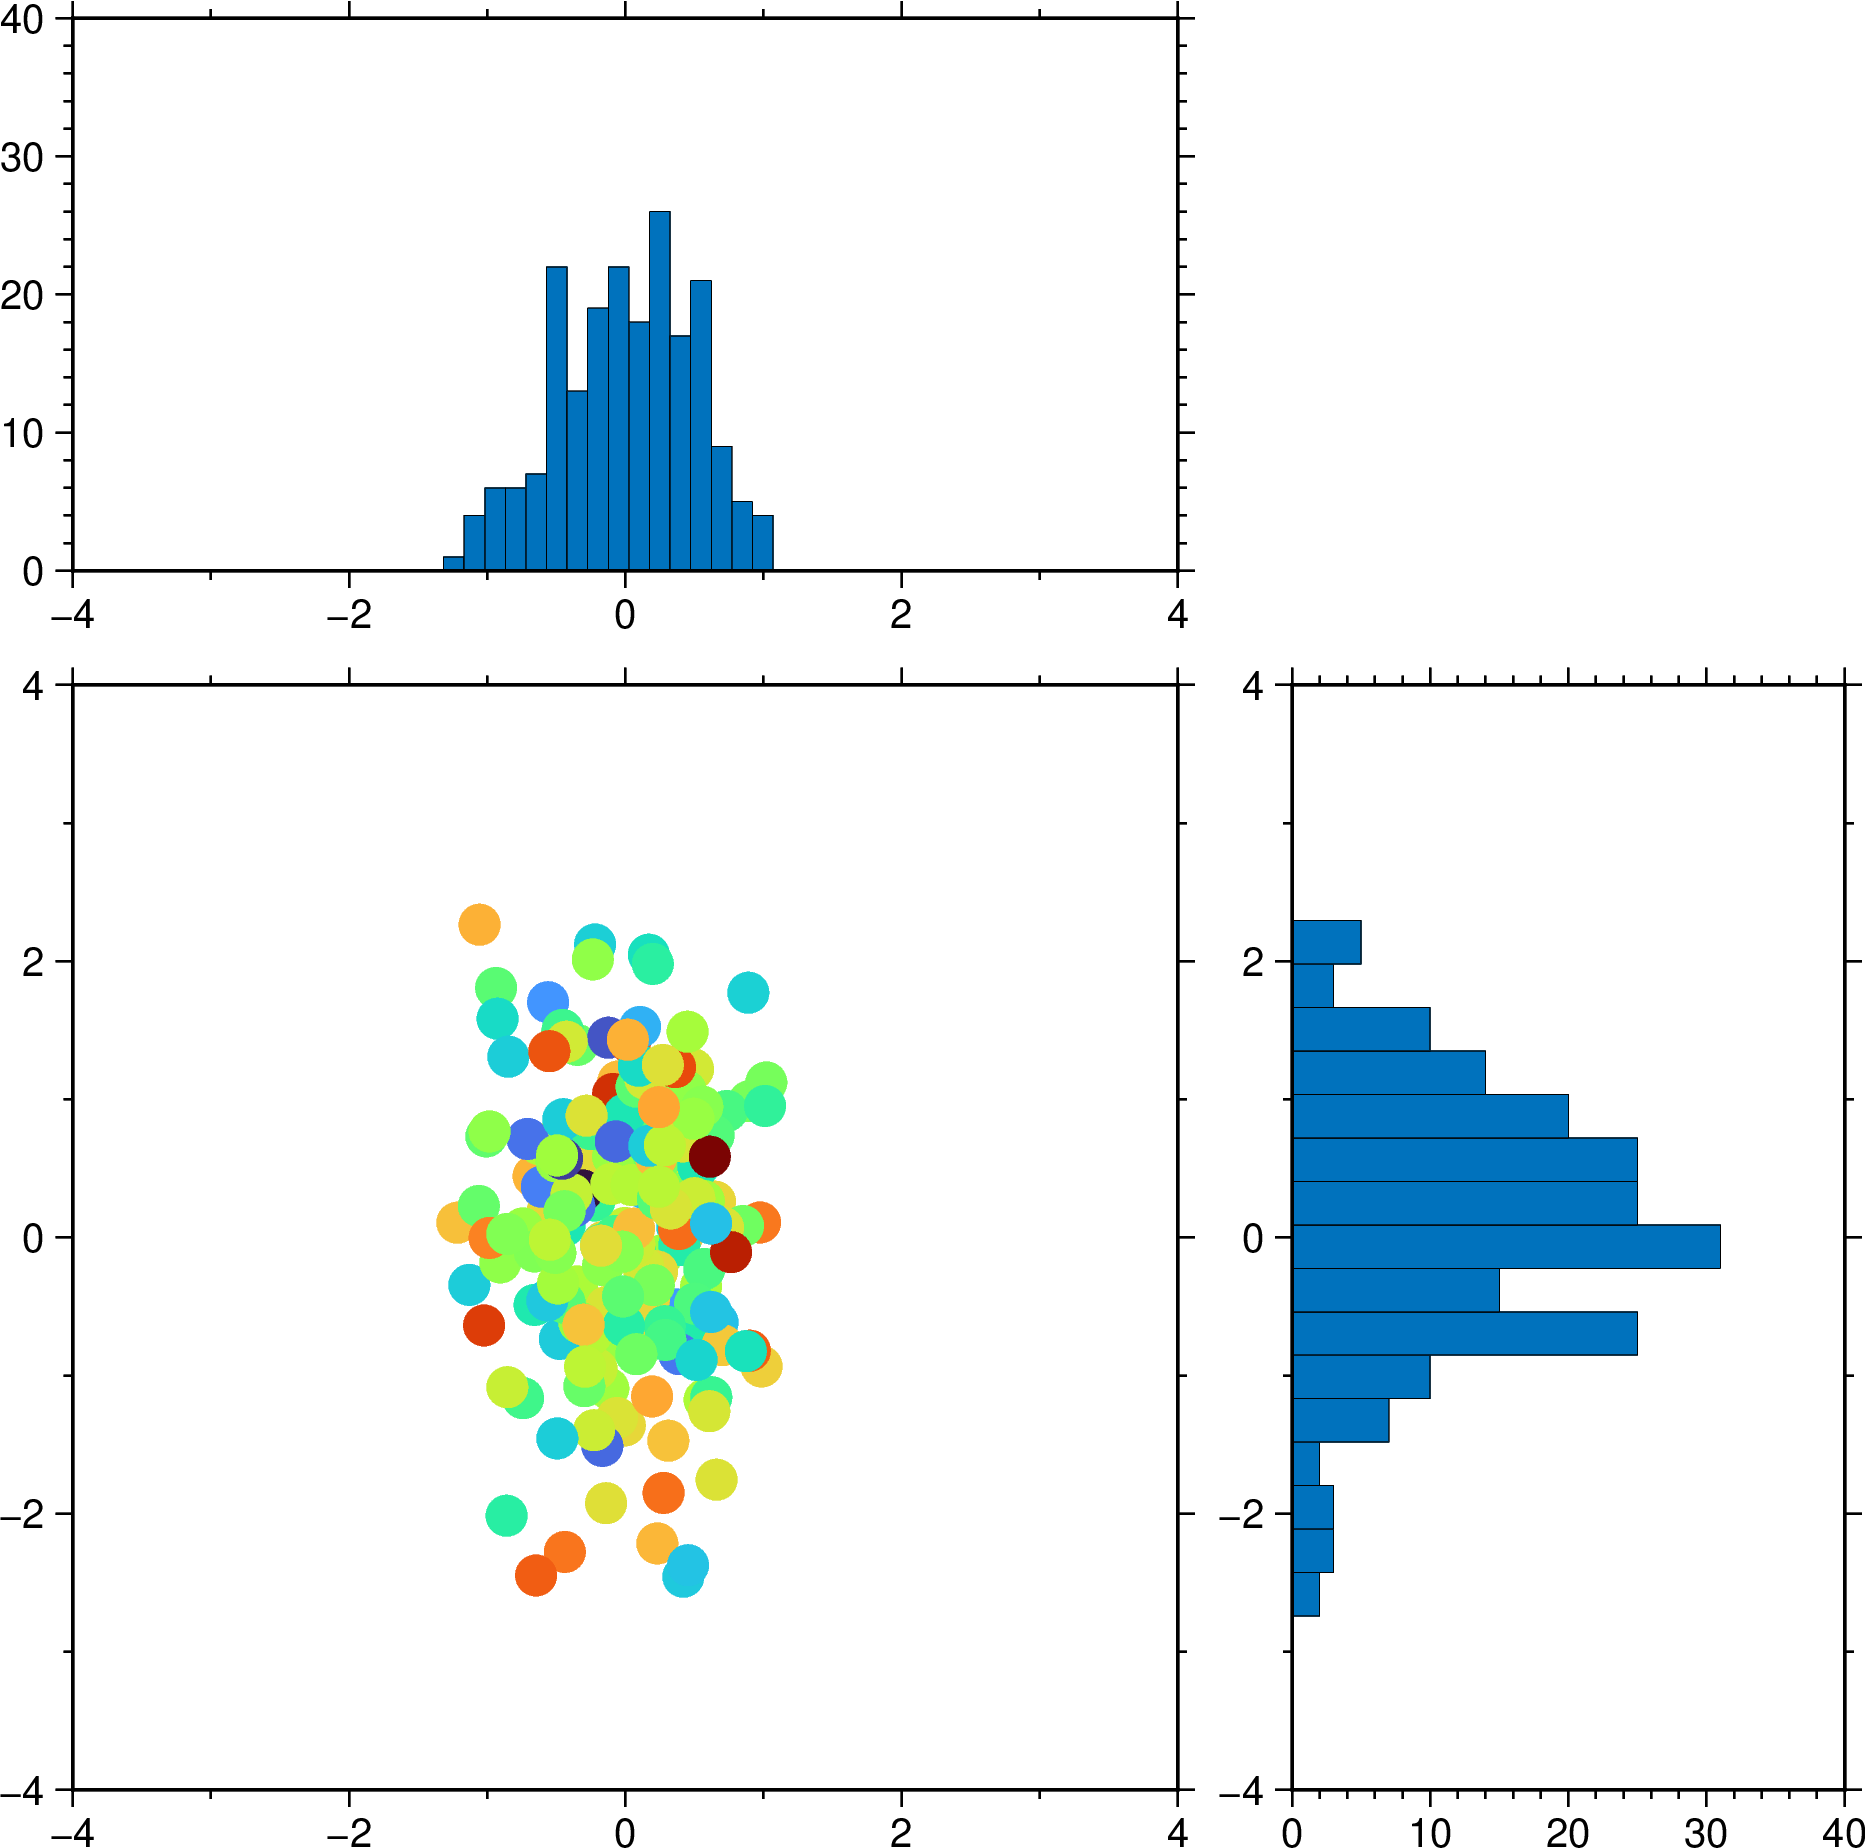
subplot(grid="2x2", dims=(size=(15,15), frac=((10,5),(5,10))),
        col_axes=true, row_axes=true)
    n = 200;
    x, y, color = randn(n)/2, randn(n), randn(n);
    histogram(x, limits=(-4,4,0,40), binmethod="sqrt", panel=(1,1));
    scatter(x,y, limits=(-4,4,-4,4), marker=:circ, ms="10p", zcolor=color, panel=(2,1));
    histogram(y, limits=(-4,4,0,40), horizontal=true, binmethod="sqrt", panel=(2,2));
subplot(:show)
© GMT.jl. Last modified: July 26, 2024. Website built with Franklin.jl and the Julia programming language.
These docs were autogenerated using GMT: v1.16.0


