using GMT
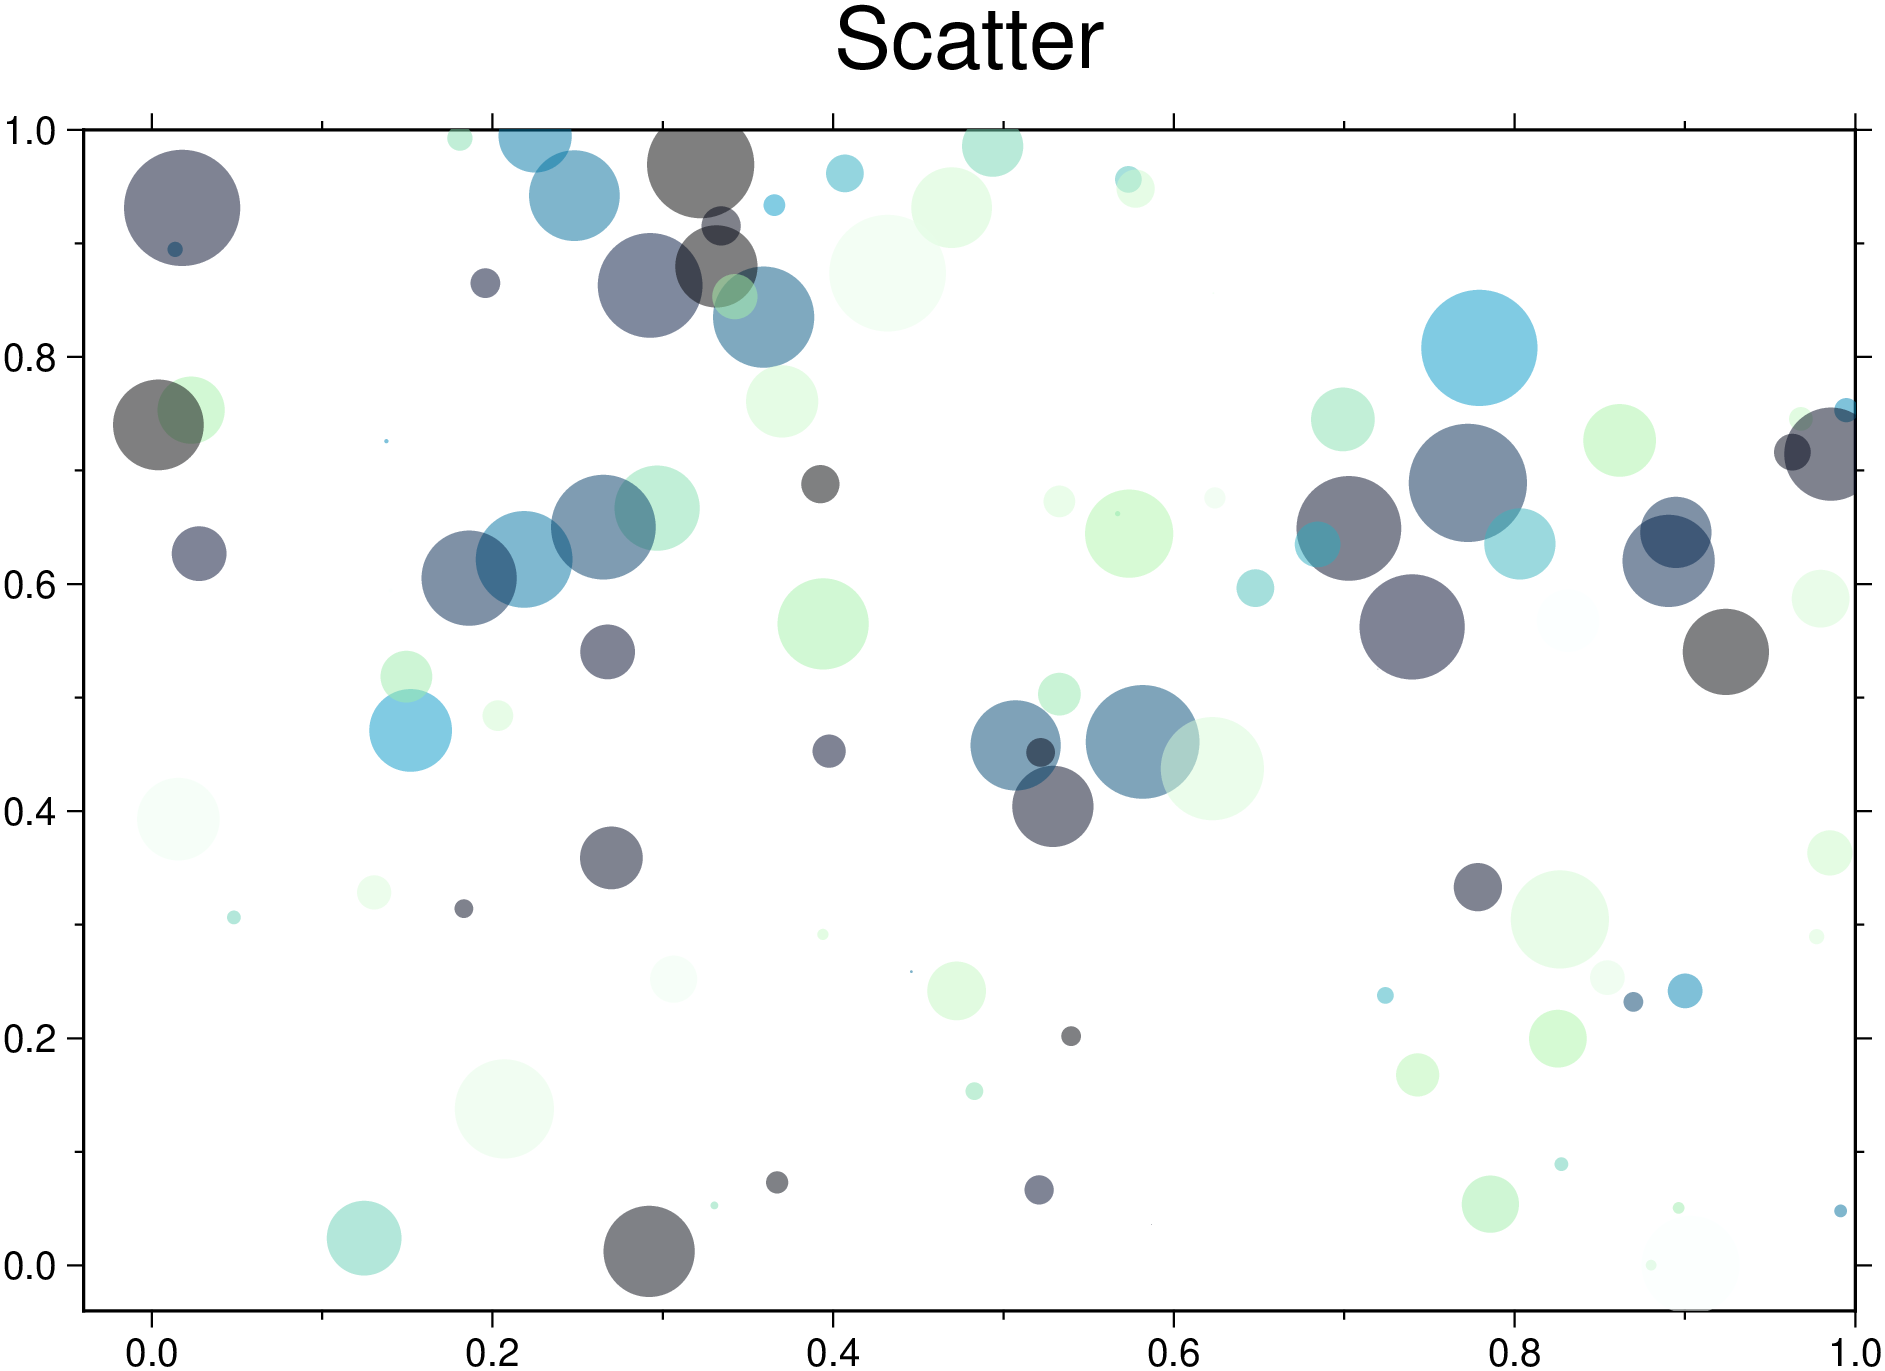
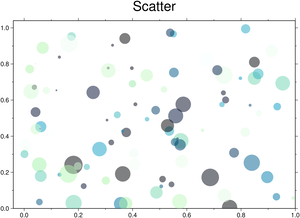
scatter(rand(100),rand(100), # Generate data
markersize=rand(100), # Symbol sizes
marker=:c, # Plot circles
color=:ocean, # Color scale
zcolor=rand(100), # Assign color to each symbol
alpha=50, # Set transparency to 50%
title="Scatter", # Fig title
show=true) # Display the figure