using GMT
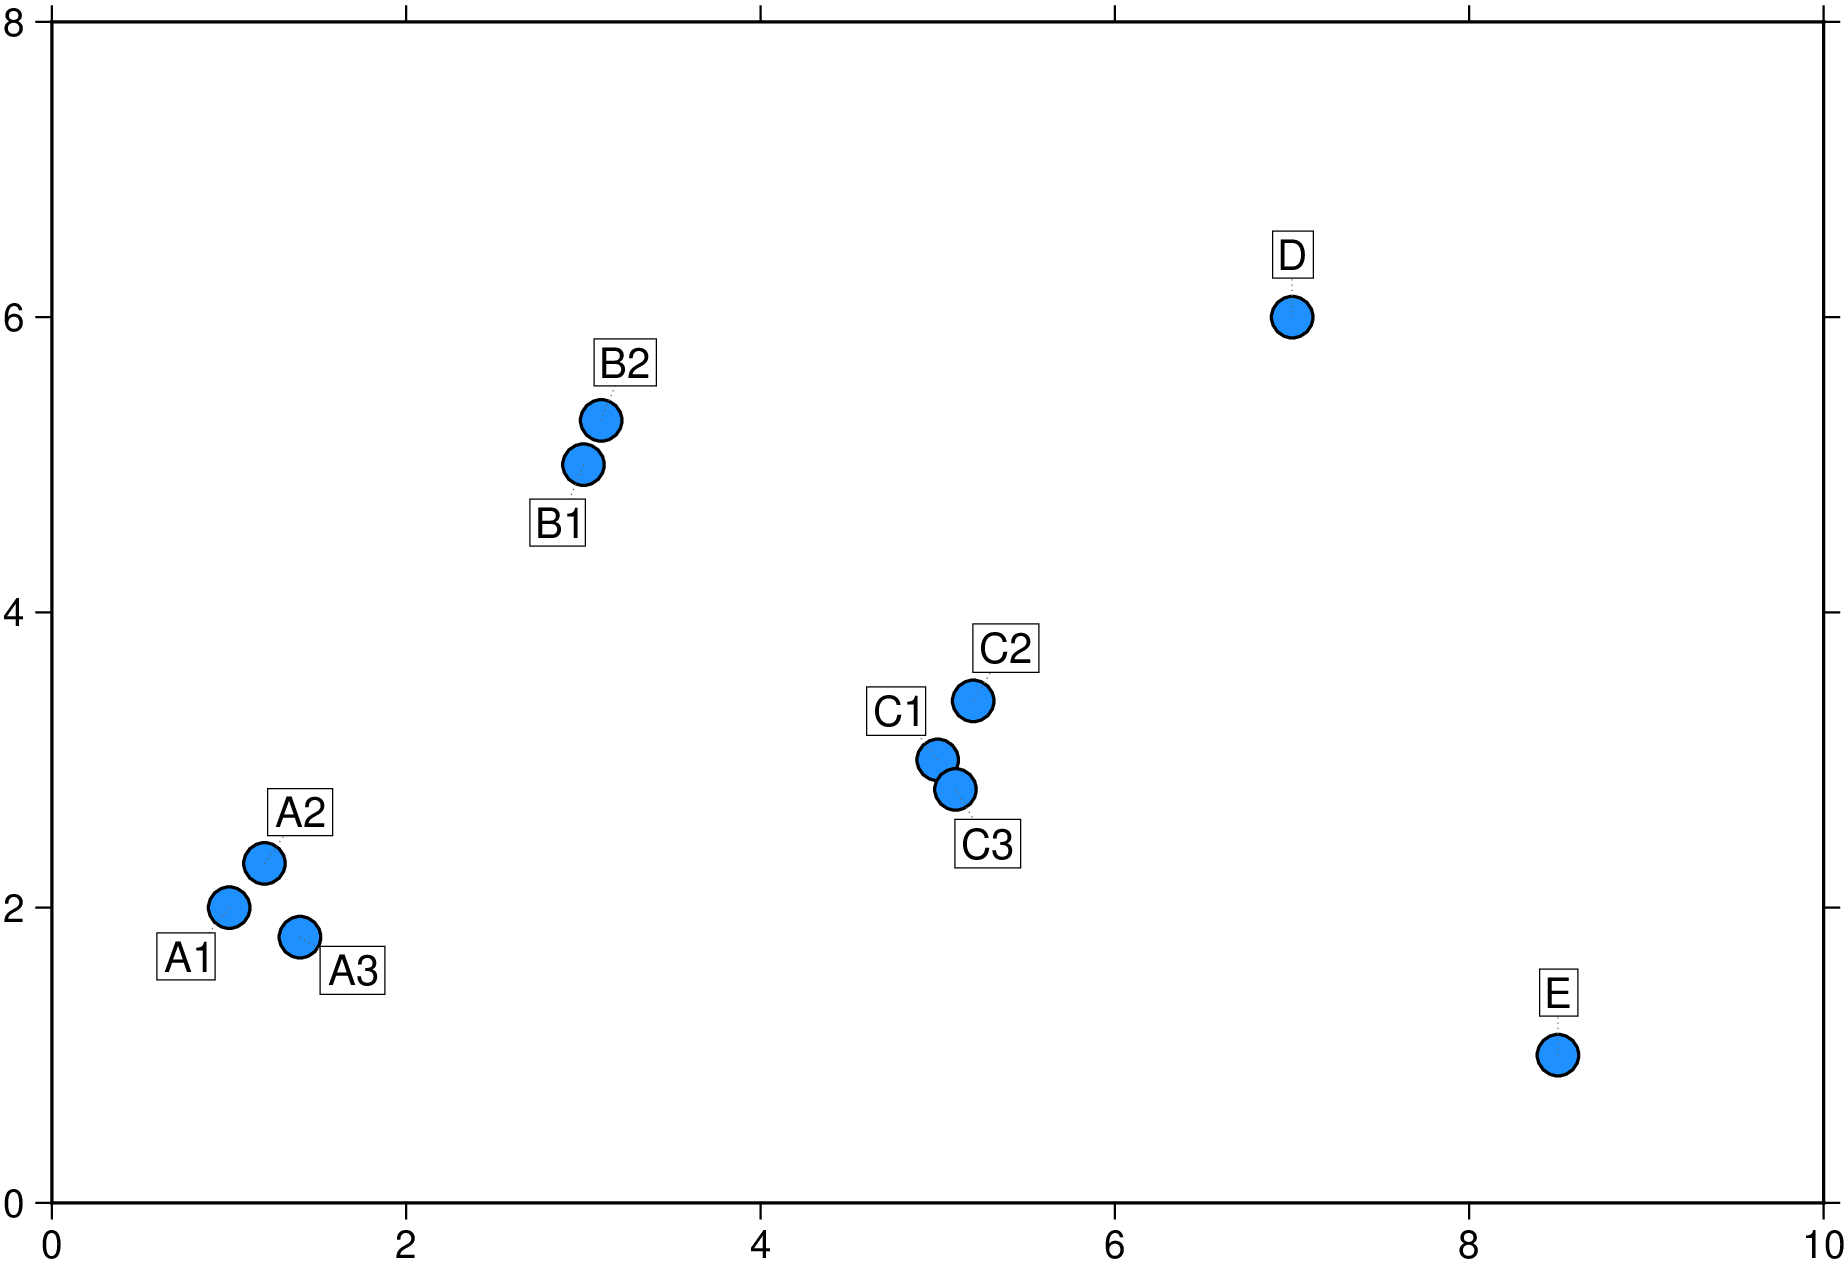
x = [1.0, 1.2, 1.4, 3.0, 3.1, 5.0, 5.2, 5.1, 7.0, 8.5]
y = [2.0, 2.3, 1.8, 5.0, 5.3, 3.0, 3.4, 2.8, 6.0, 1.0]
labels = ["A1", "A2", "A3", "B1", "B2", "C1", "C2", "C3", "D", "E"]
pts = hcat(x, y)
scatter(pts, region=[0, 10, 0, 8],
marker=:circle, ms="10p", fill=:dodgerblue, ml=:thin,
xaxis=(annot=2,), yaxis=(annot=2,), frame=:WSen)
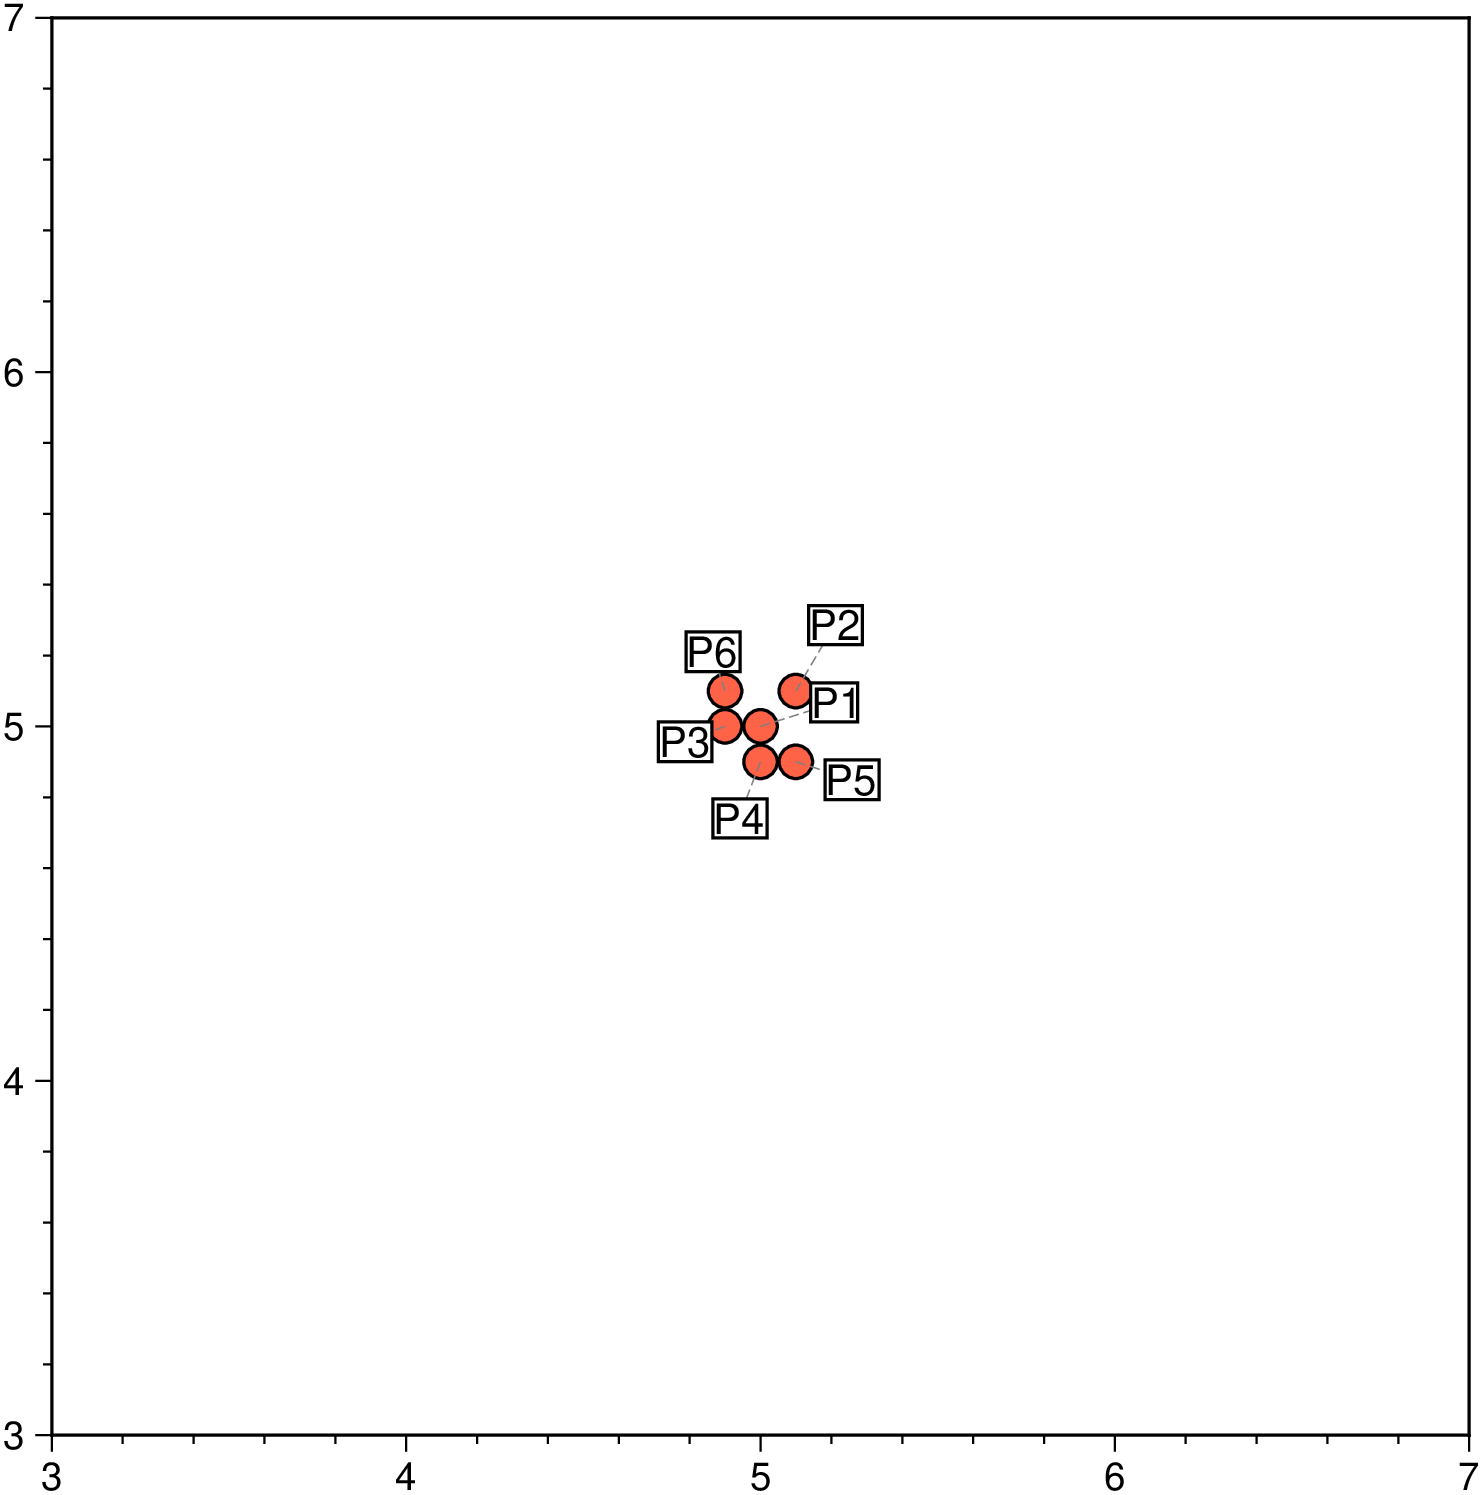
# Compute adjusted positions
pos = GMT.textrepel(pts, labels, fontsize=10, offset=15)
# Leader lines + labels
lines = [mat2ds([pts[k,1] pts[k,2]; pos[k,1] pos[k,2]]) for k in 1:length(labels)]
plot!(lines, pen="0.25p,gray40,.")
text!(mat2ds(pos, text=labels), font=(10,:Helvetica,:black),
justify=:CM, fill=:white, pen="0.25p", clearance="2p")
showfig()