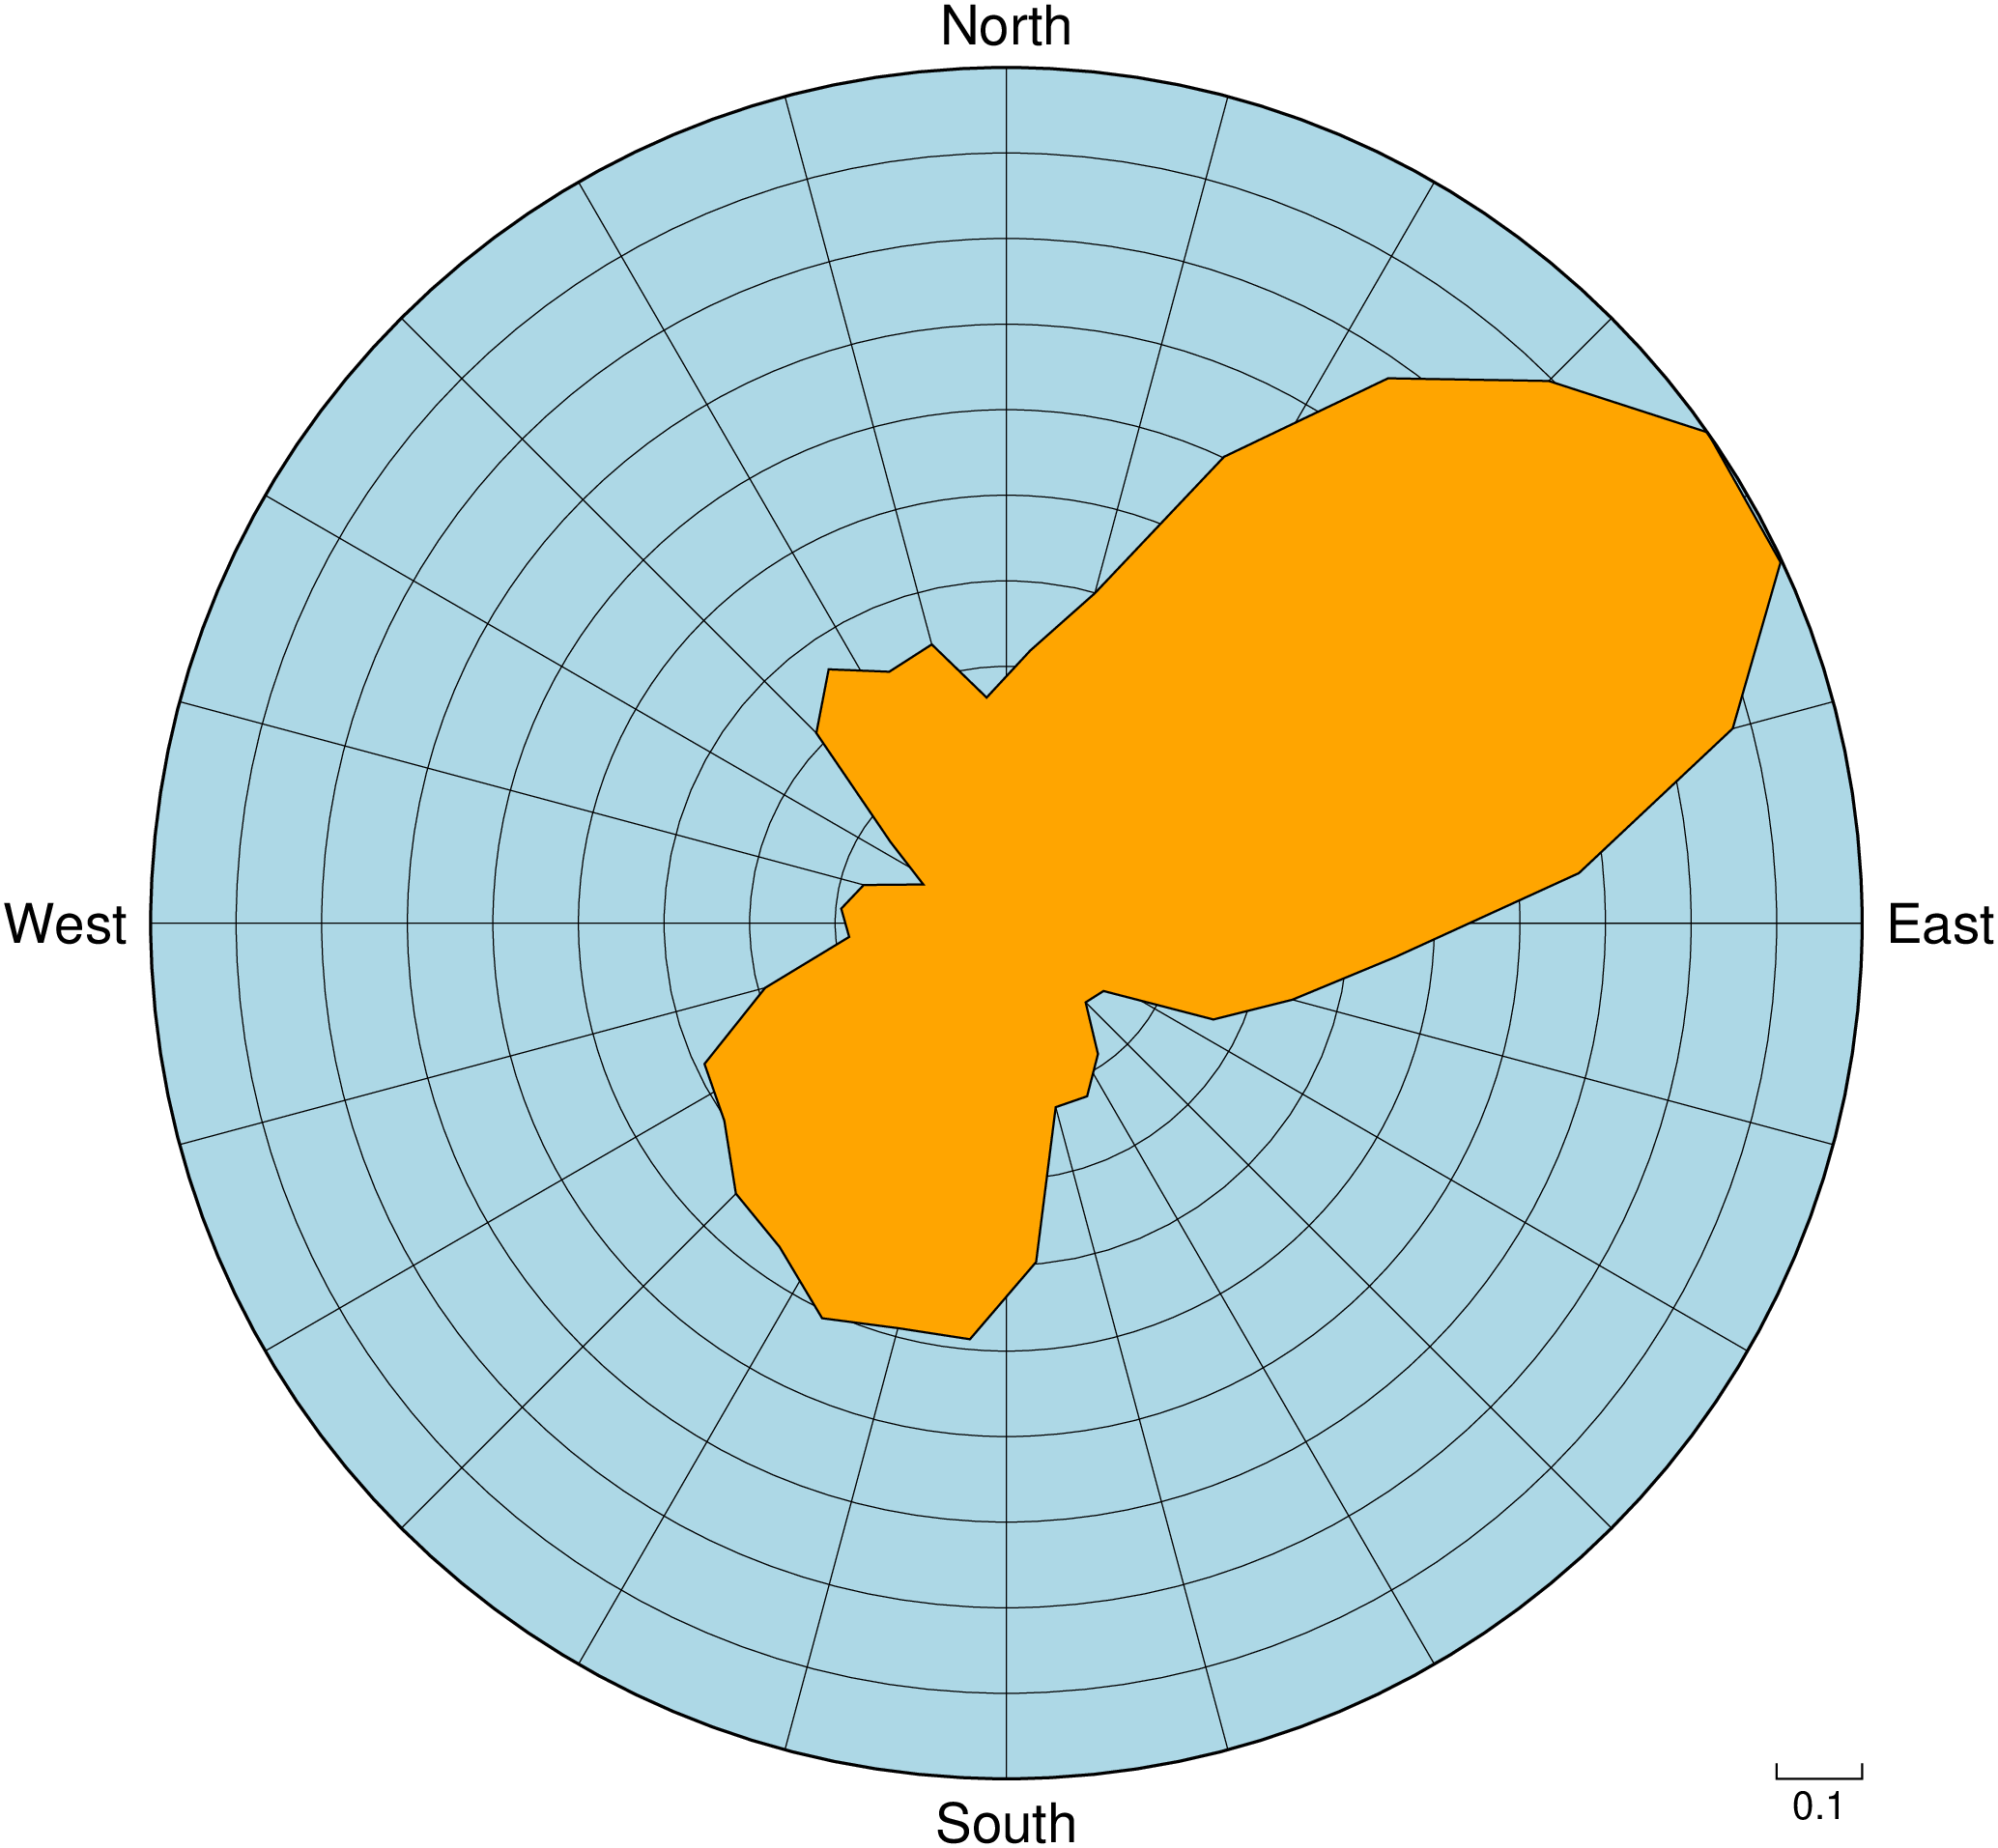
The remote file fractures_06.txt contains a compilation of fracture lengths and directions as digitized from geological maps. We will use it to create a rose diagram.
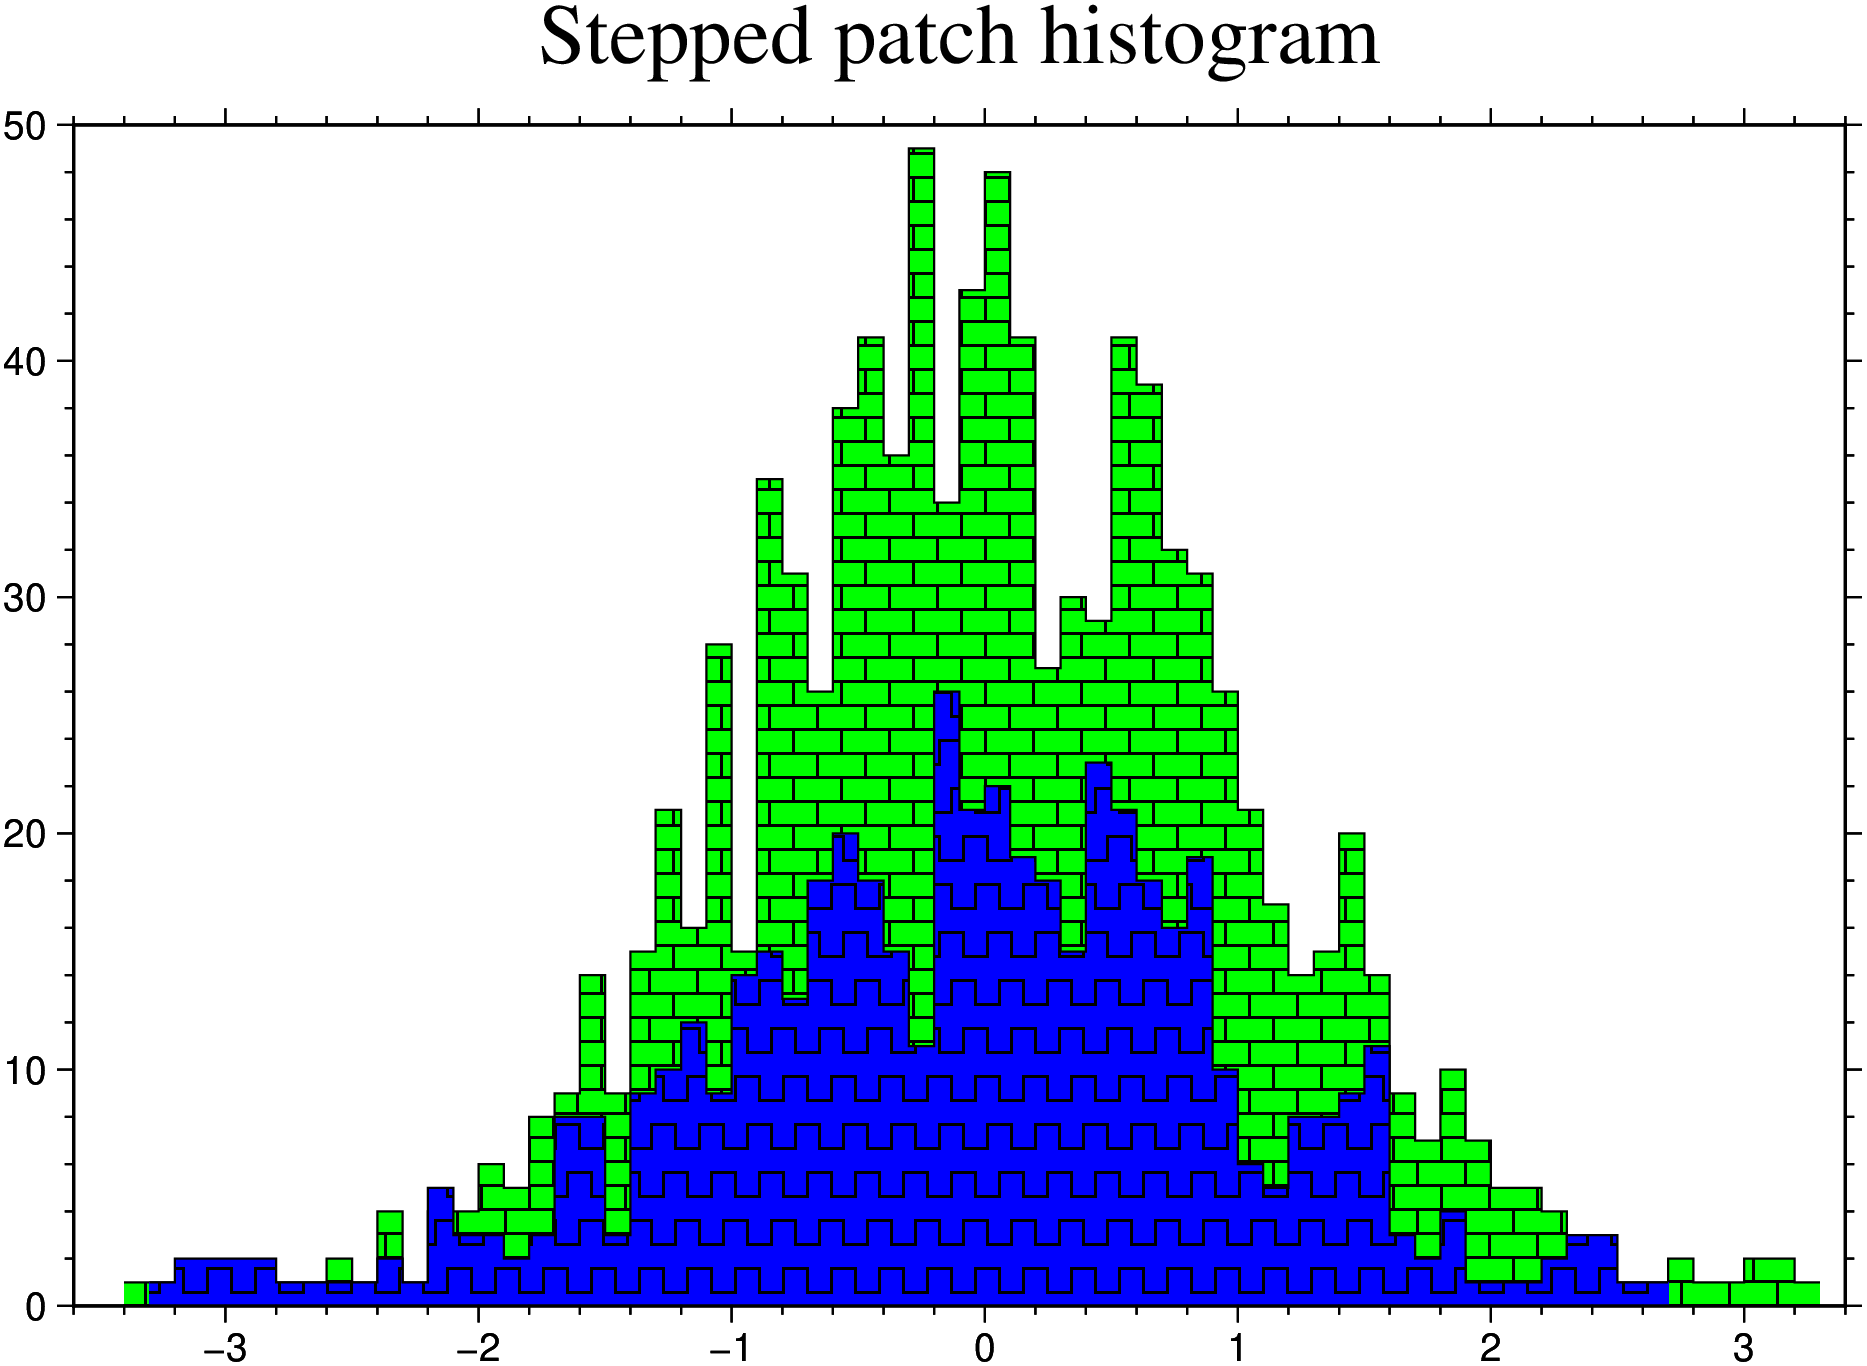
usingGMTD1 =histogram(randn(1000), I=:o, bin=0.1); # Create histogrammed data with bin = 0.1 (I=:o to create the dataset)D2 =histogram(randn(500), I=:o, bin=0.1);lines(D1, # The data steps=(x=true,), # Make steps a xx close=(bot="",), # Close polygon at the bottom fill=(pattern=20, bg=:green, dpi=200), # Set the pattern code, the background color and dpi figsize=(15,10)) # Set fig size of 15x10 cmlines!(D2, # Second dataset steps=(x=true,), close=(bot="",), fill=(pattern=82,bg=:blue,dpi=100), title="Stepped patch histogram", show=true)