using GMT

biplot(TESTSDIR * "iris.dat", show=true)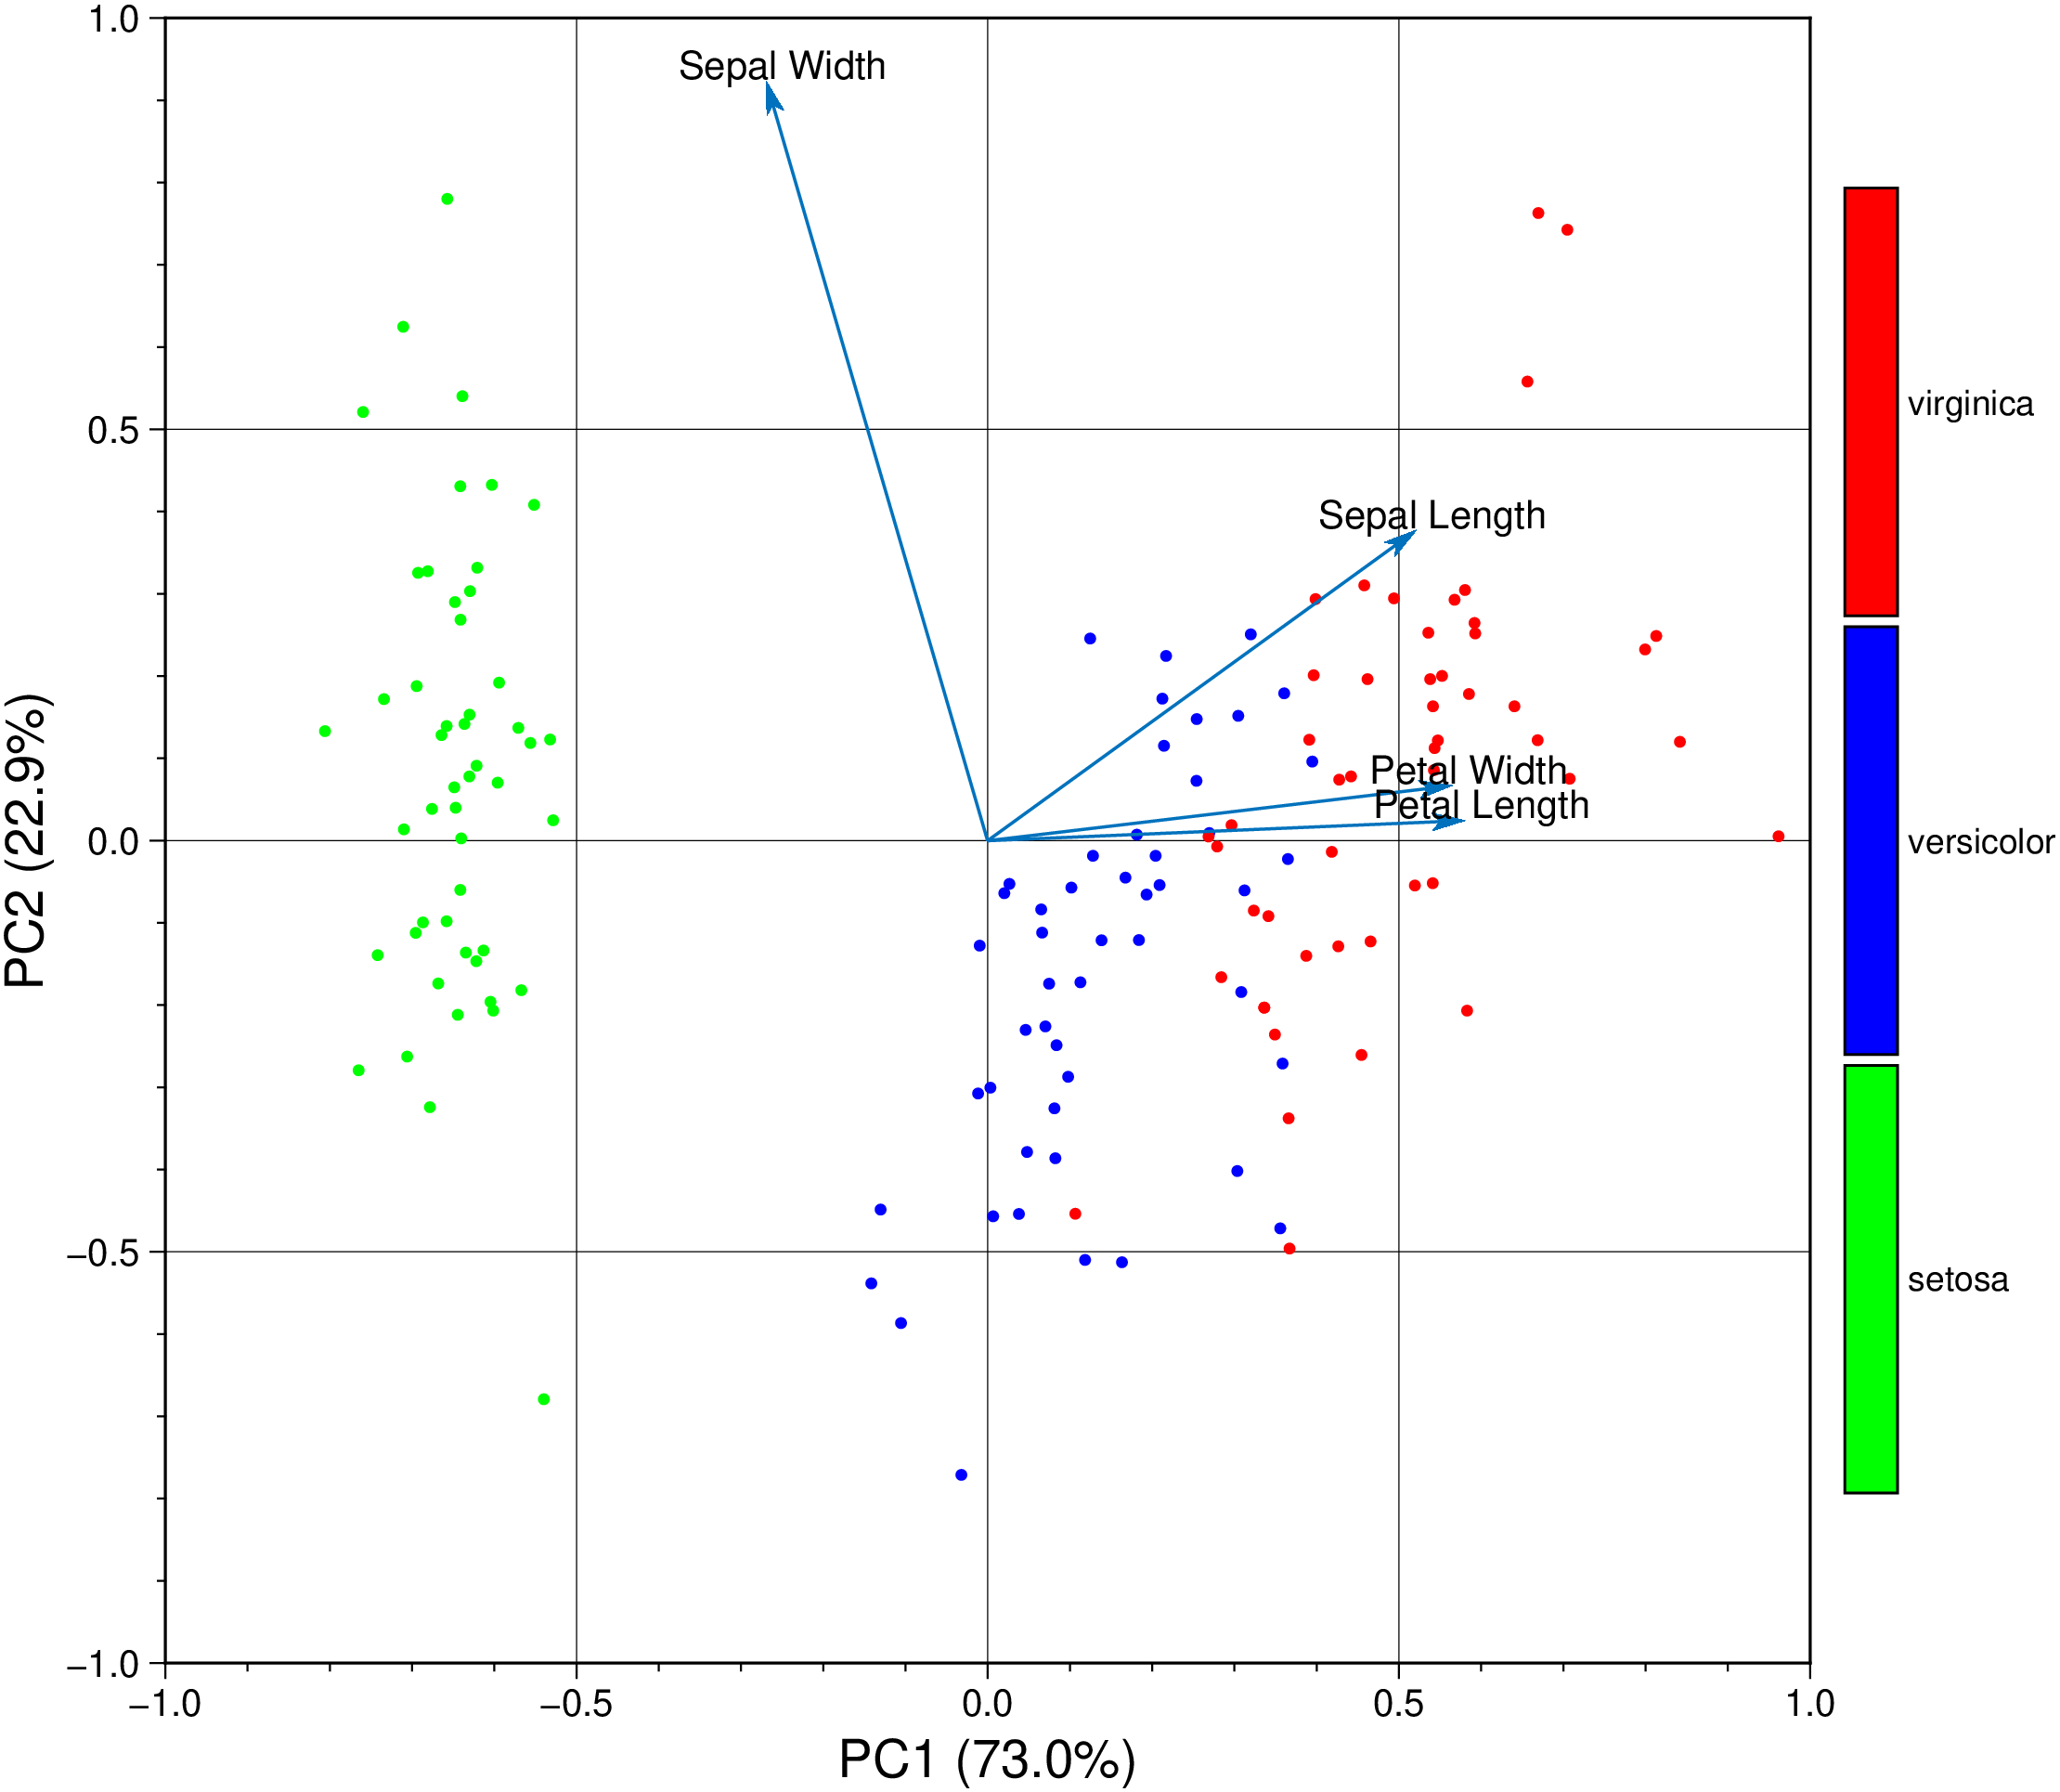
The classic analysis of the Iris dataset.
using GMT
biplot(TESTSDIR * "iris.dat", show=true)
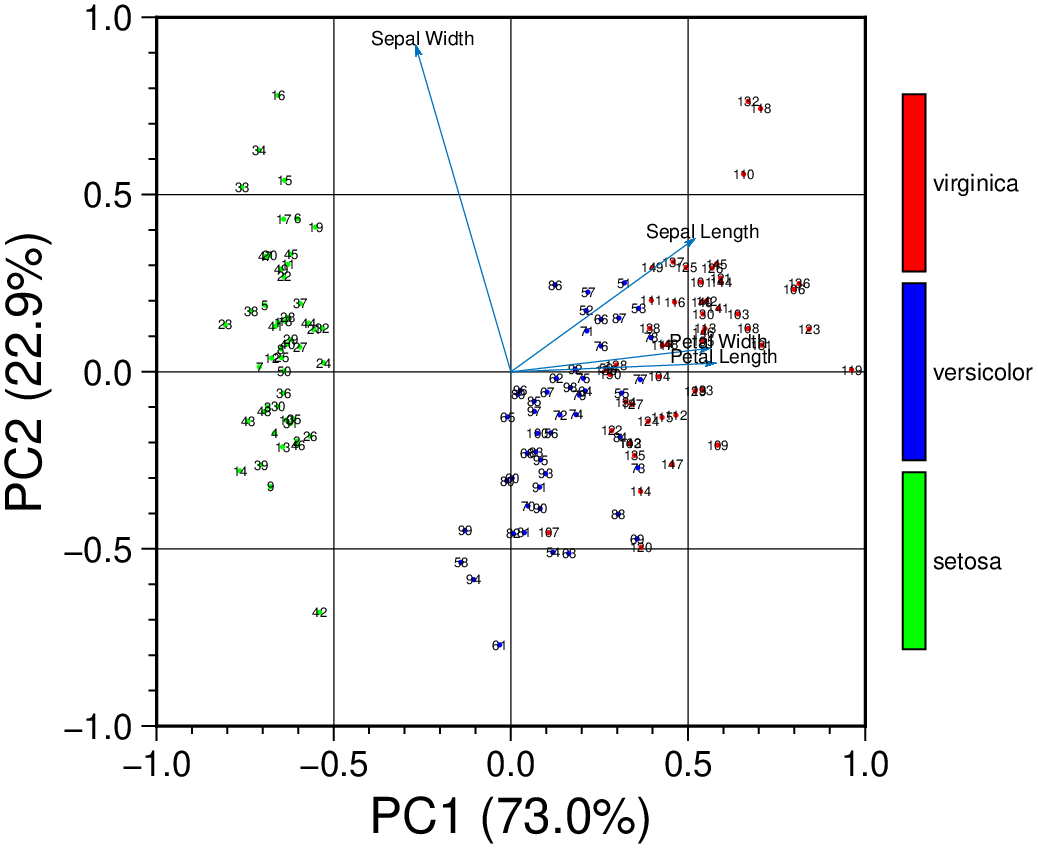
Plot a 6 cm fig with included observarion numbers.
using GMT

biplot(TESTSDIR * "iris.dat", figsize=6, obsnumbers=true, show=true)