using GMT
radar([0.5 0.5 0.6 0.9 0.77; 0.6 0.5 0.8 0.2 0.9], marker=:circ, fill=true, show=true)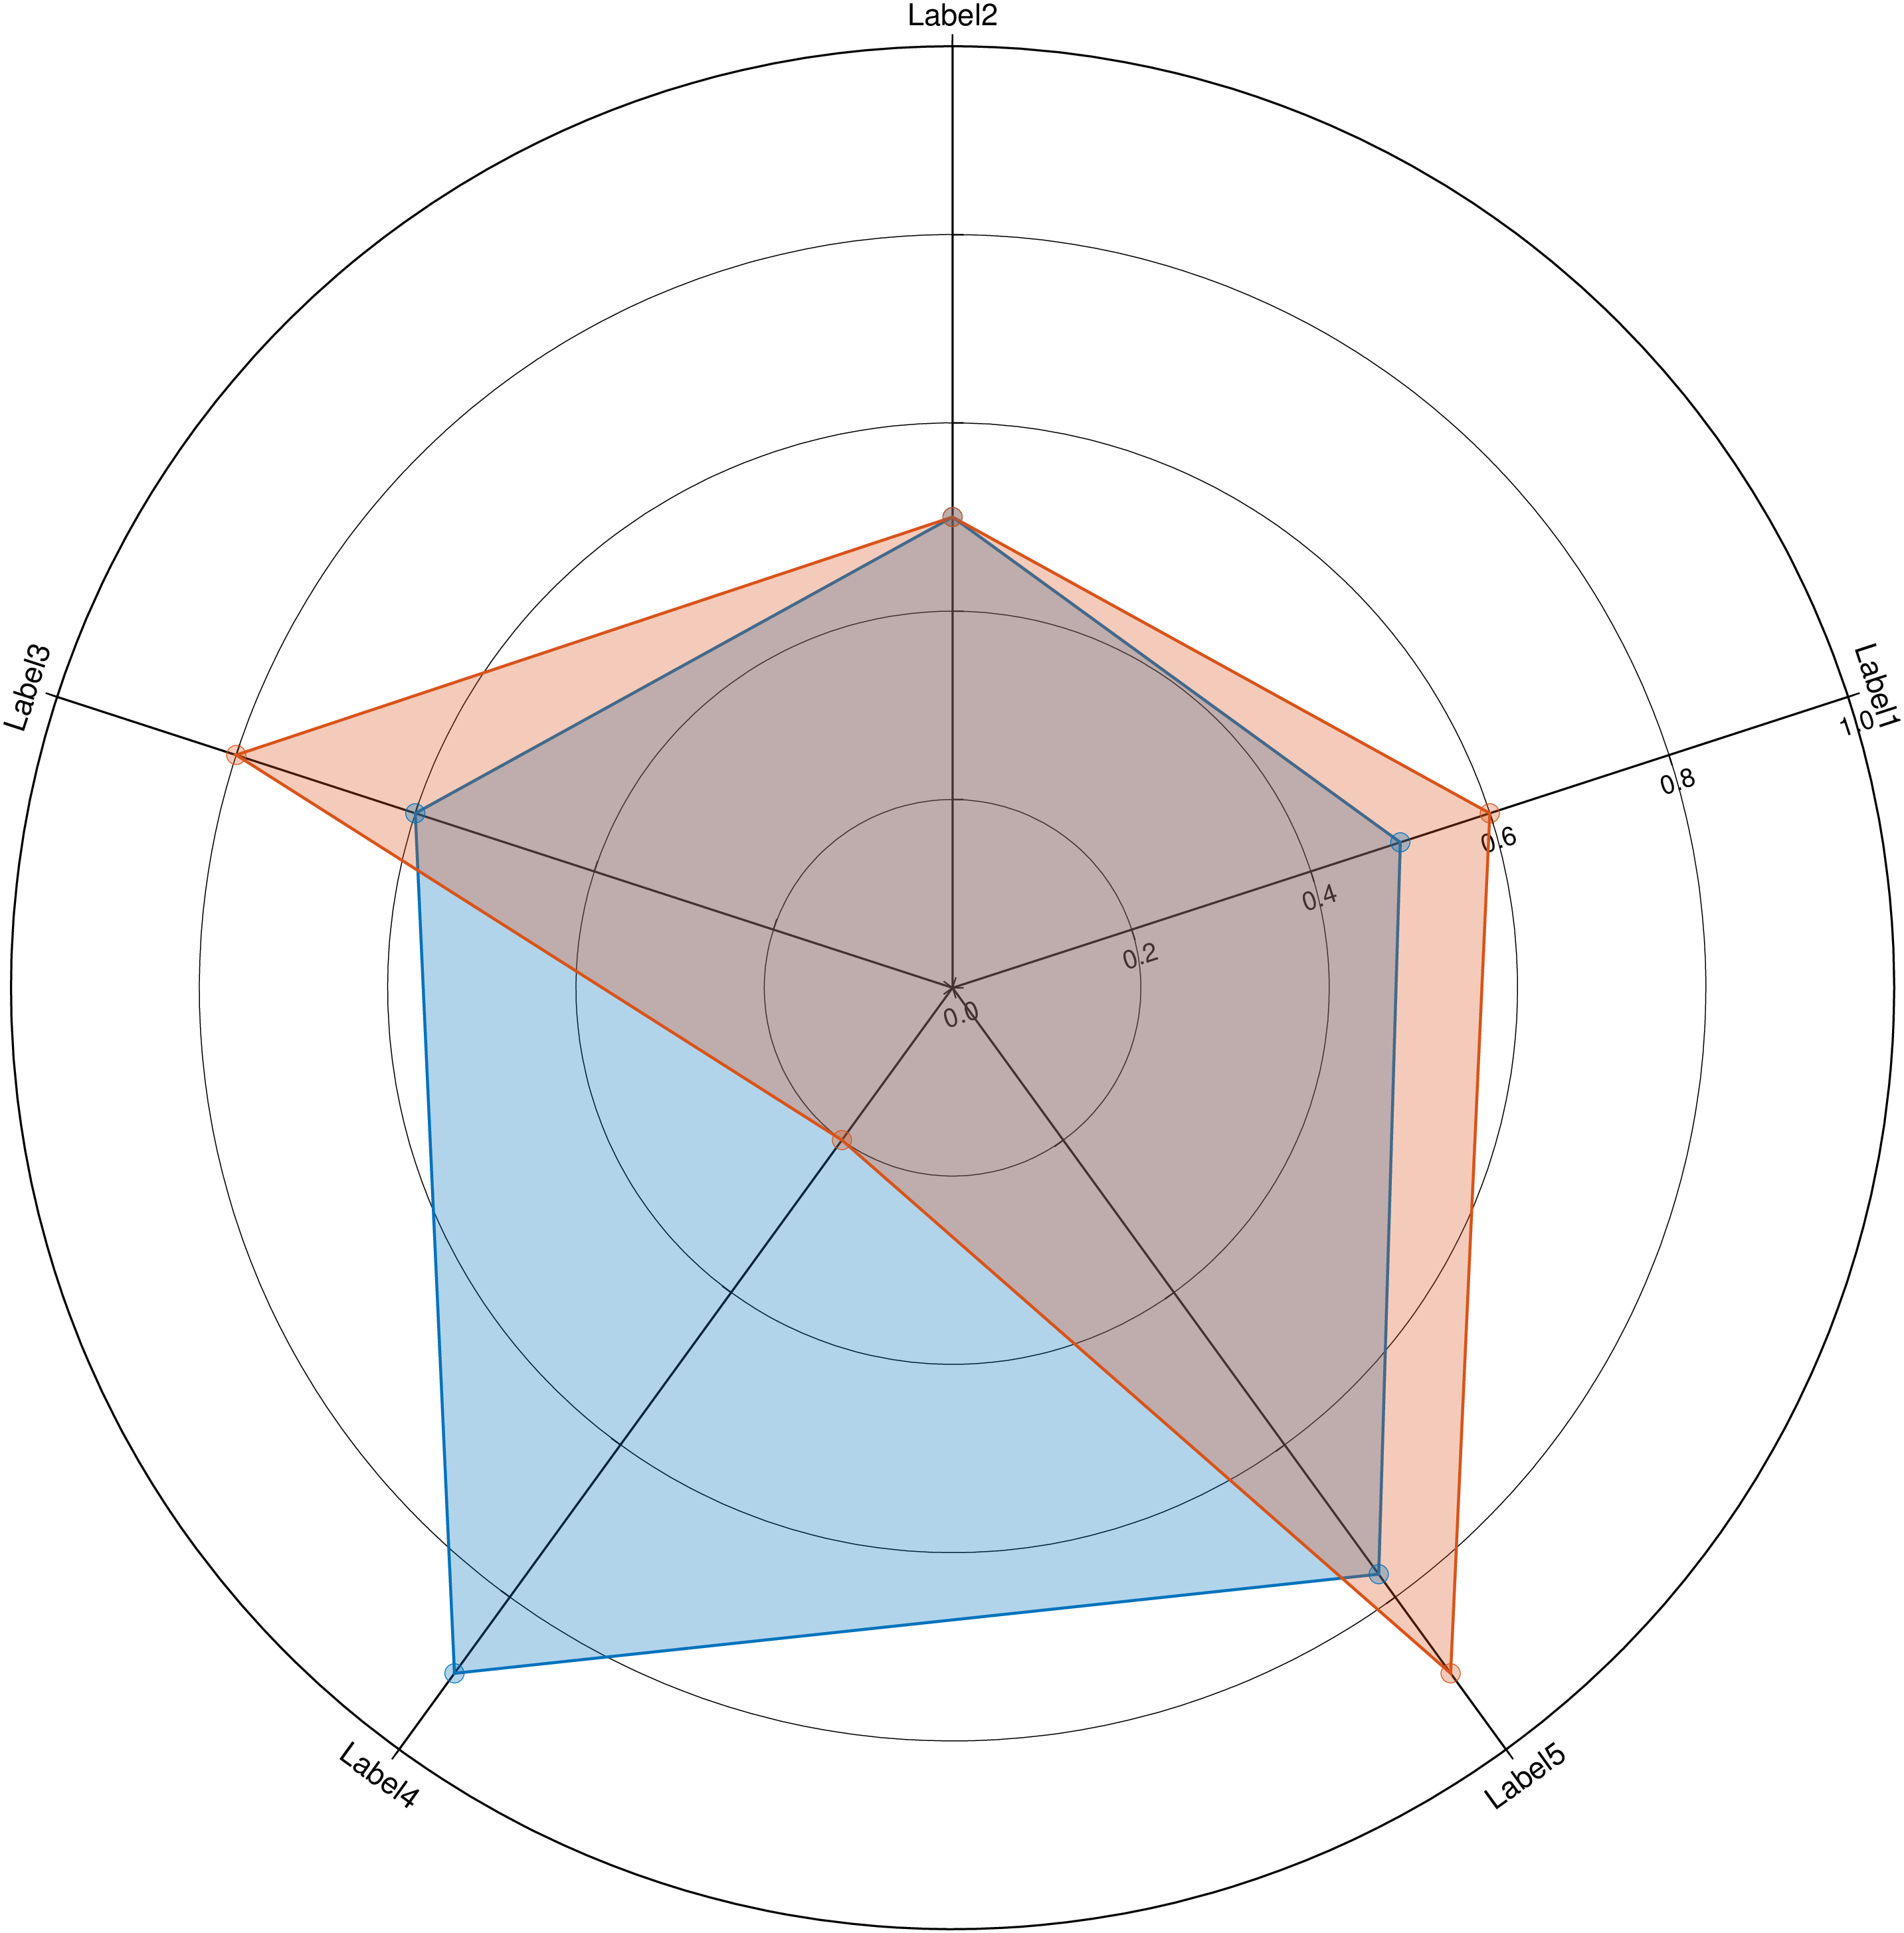
A radar plot with two datasets (a polygon for each). This example uses normalized coordinates so it shows the coordinates of only one axis.
using GMT
radar([0.5 0.5 0.6 0.9 0.77; 0.6 0.5 0.8 0.2 0.9], marker=:circ, fill=true, show=true)
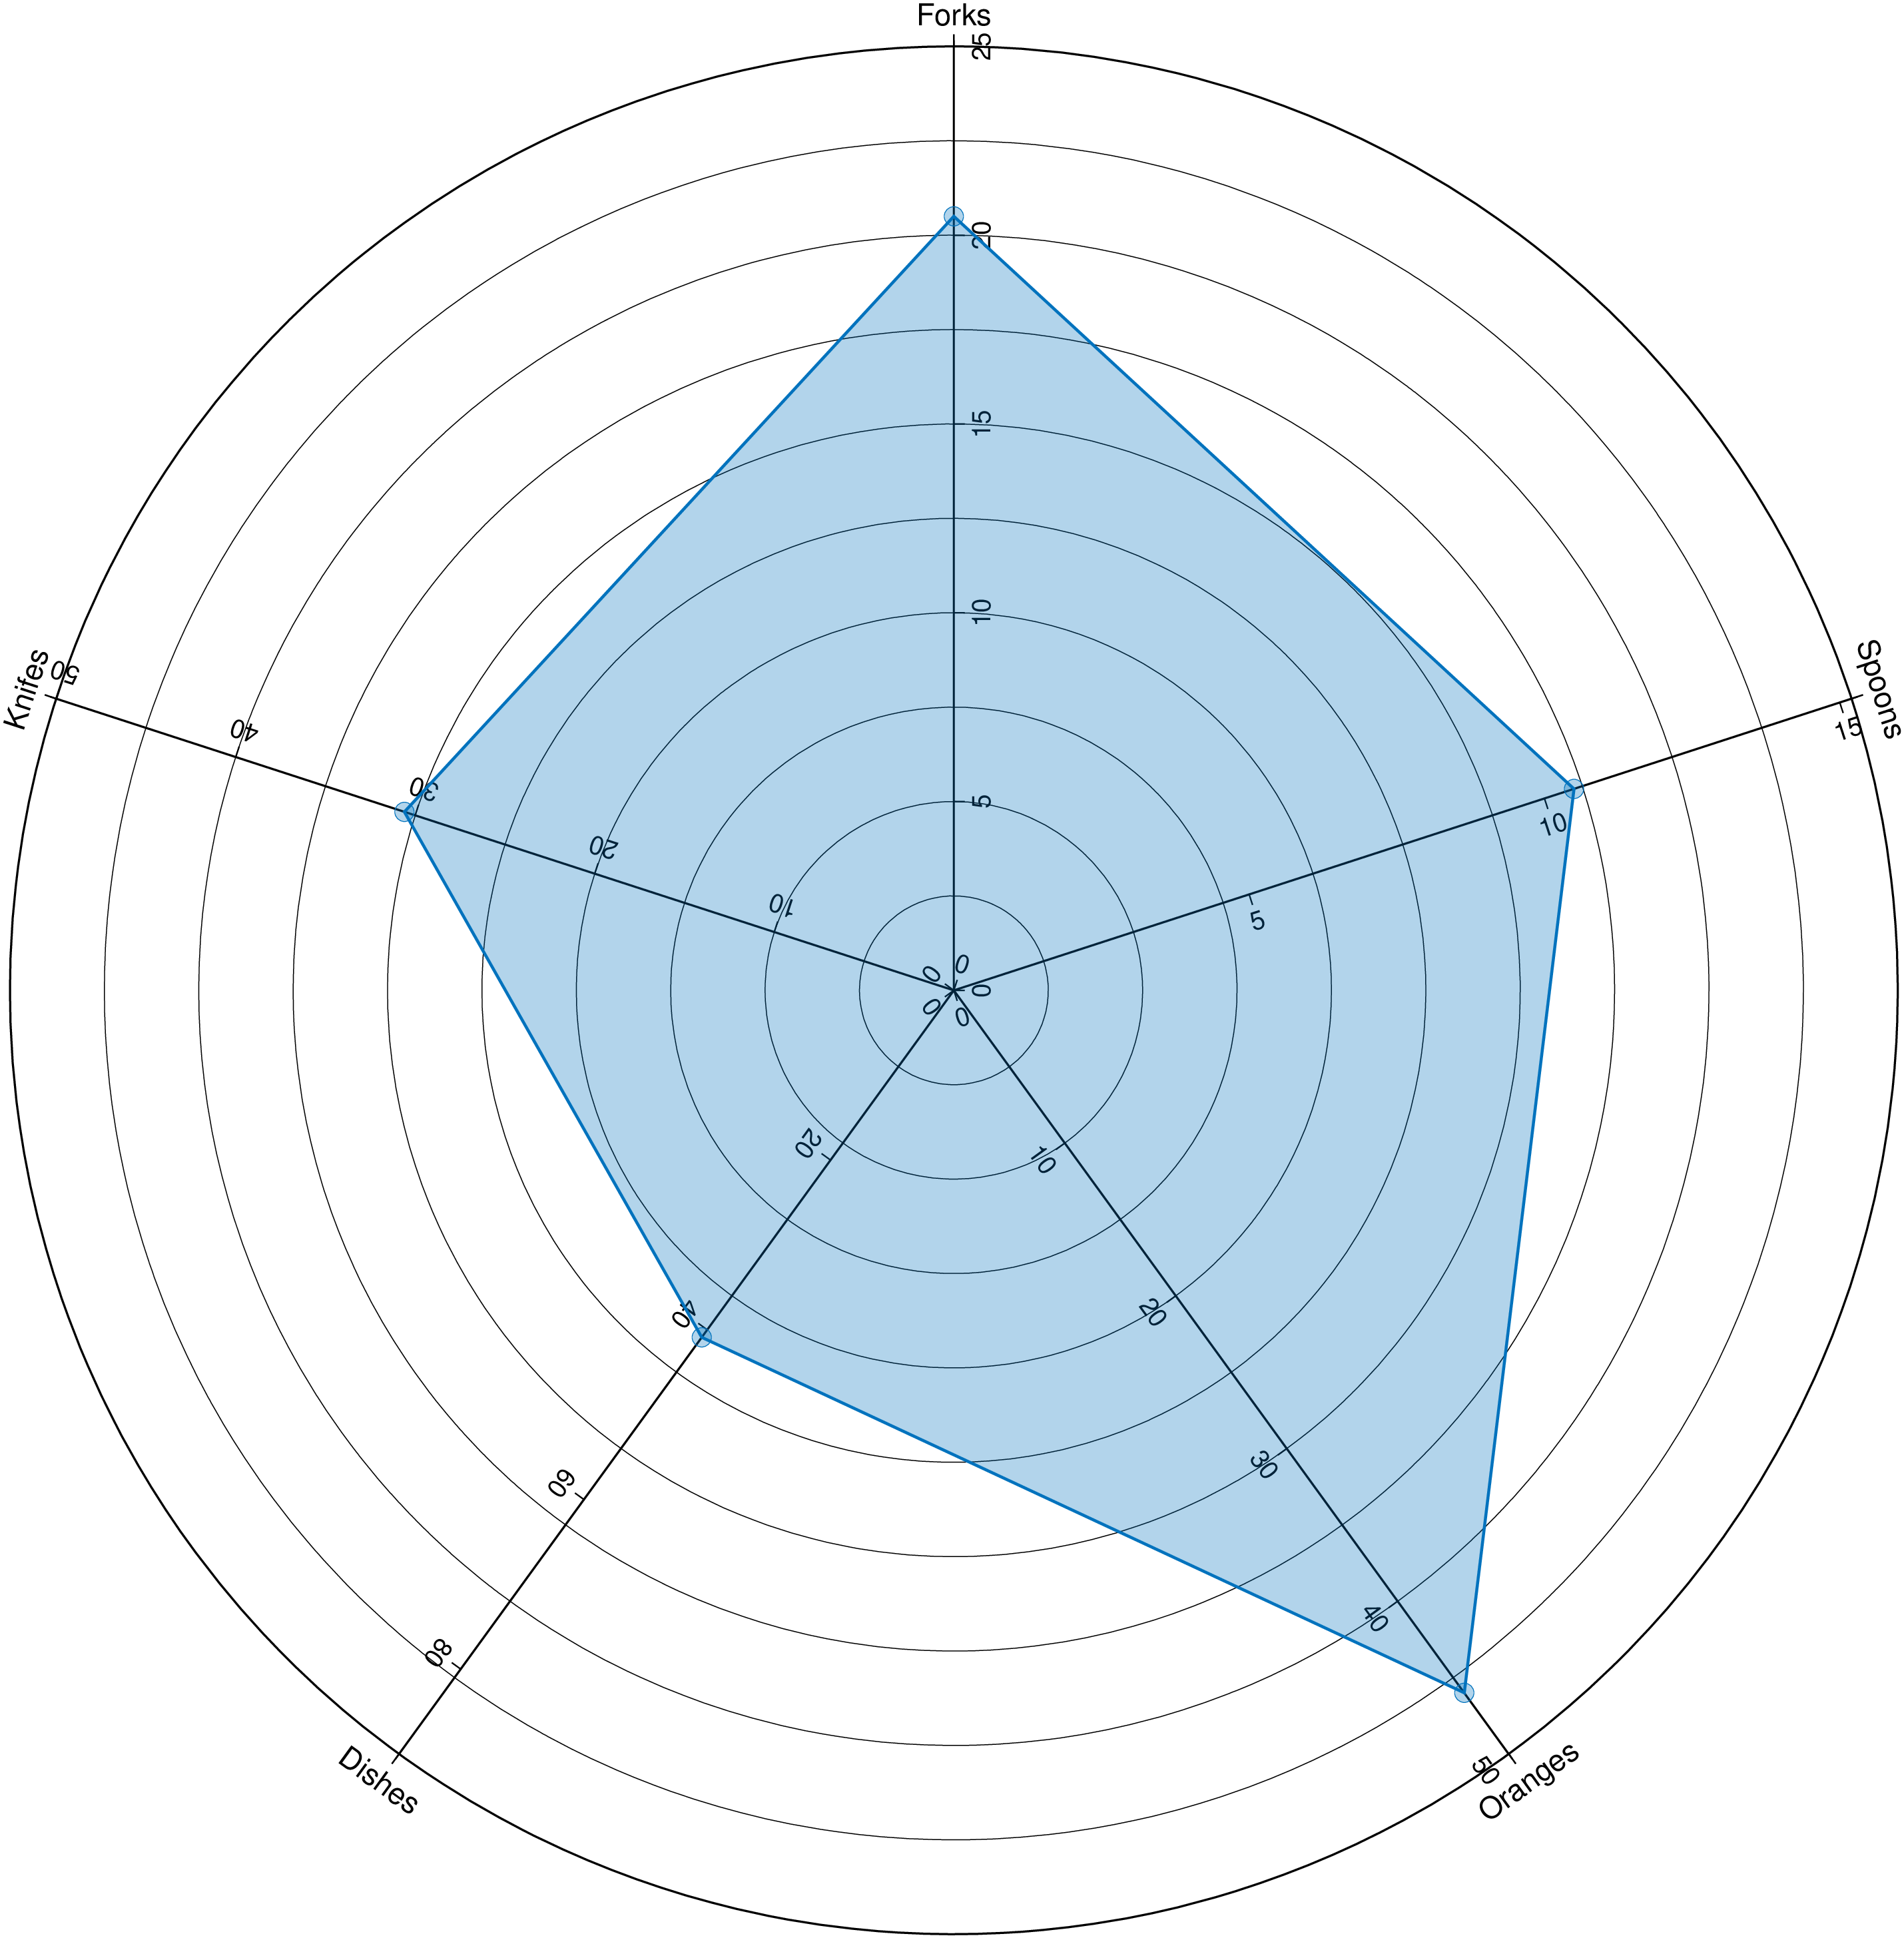
A single dataset with different coordinates for each axis.
using GMT
radar([10.5 20.5 30.6 40.9 46], axeslimts=[15, 25, 50, 90, 50],
      labels=["Spoons","Forks","Knifes","Dishes","Oranges"],
      annotall=true, marker=:circ, fill=true, show=true)