using GMT
Y = linspace(-2*pi,2*pi,50);
stem(Y, show=true)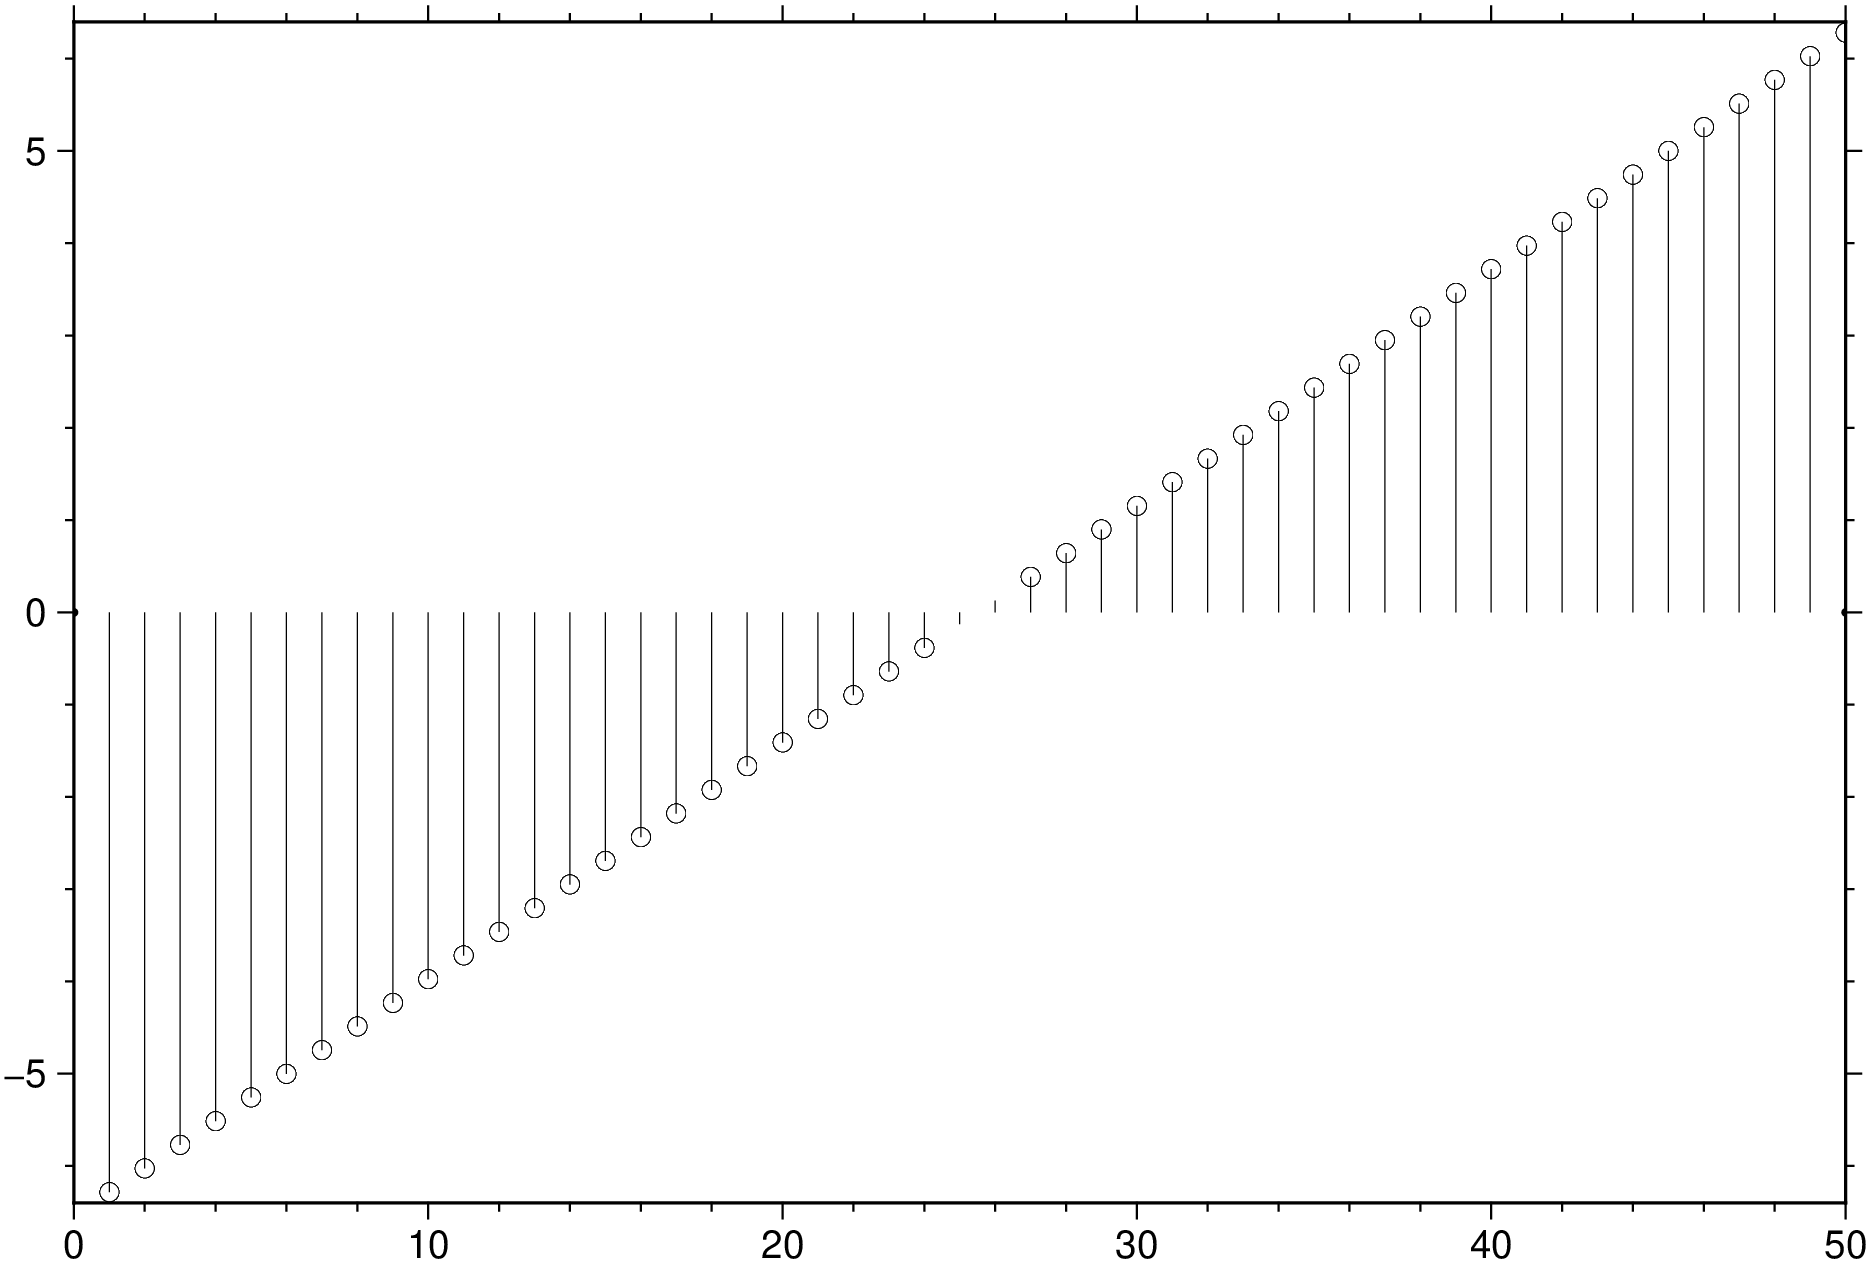
Create a stem plot of 50 data values between −2π and 2π.
using GMT
Y = linspace(-2*pi,2*pi,50);
stem(Y, show=true)
The same but now specify the set of x values for the stem plot.
using GMT
Y = linspace(-2*pi,2*pi,50);
stem([Y Y], show=true)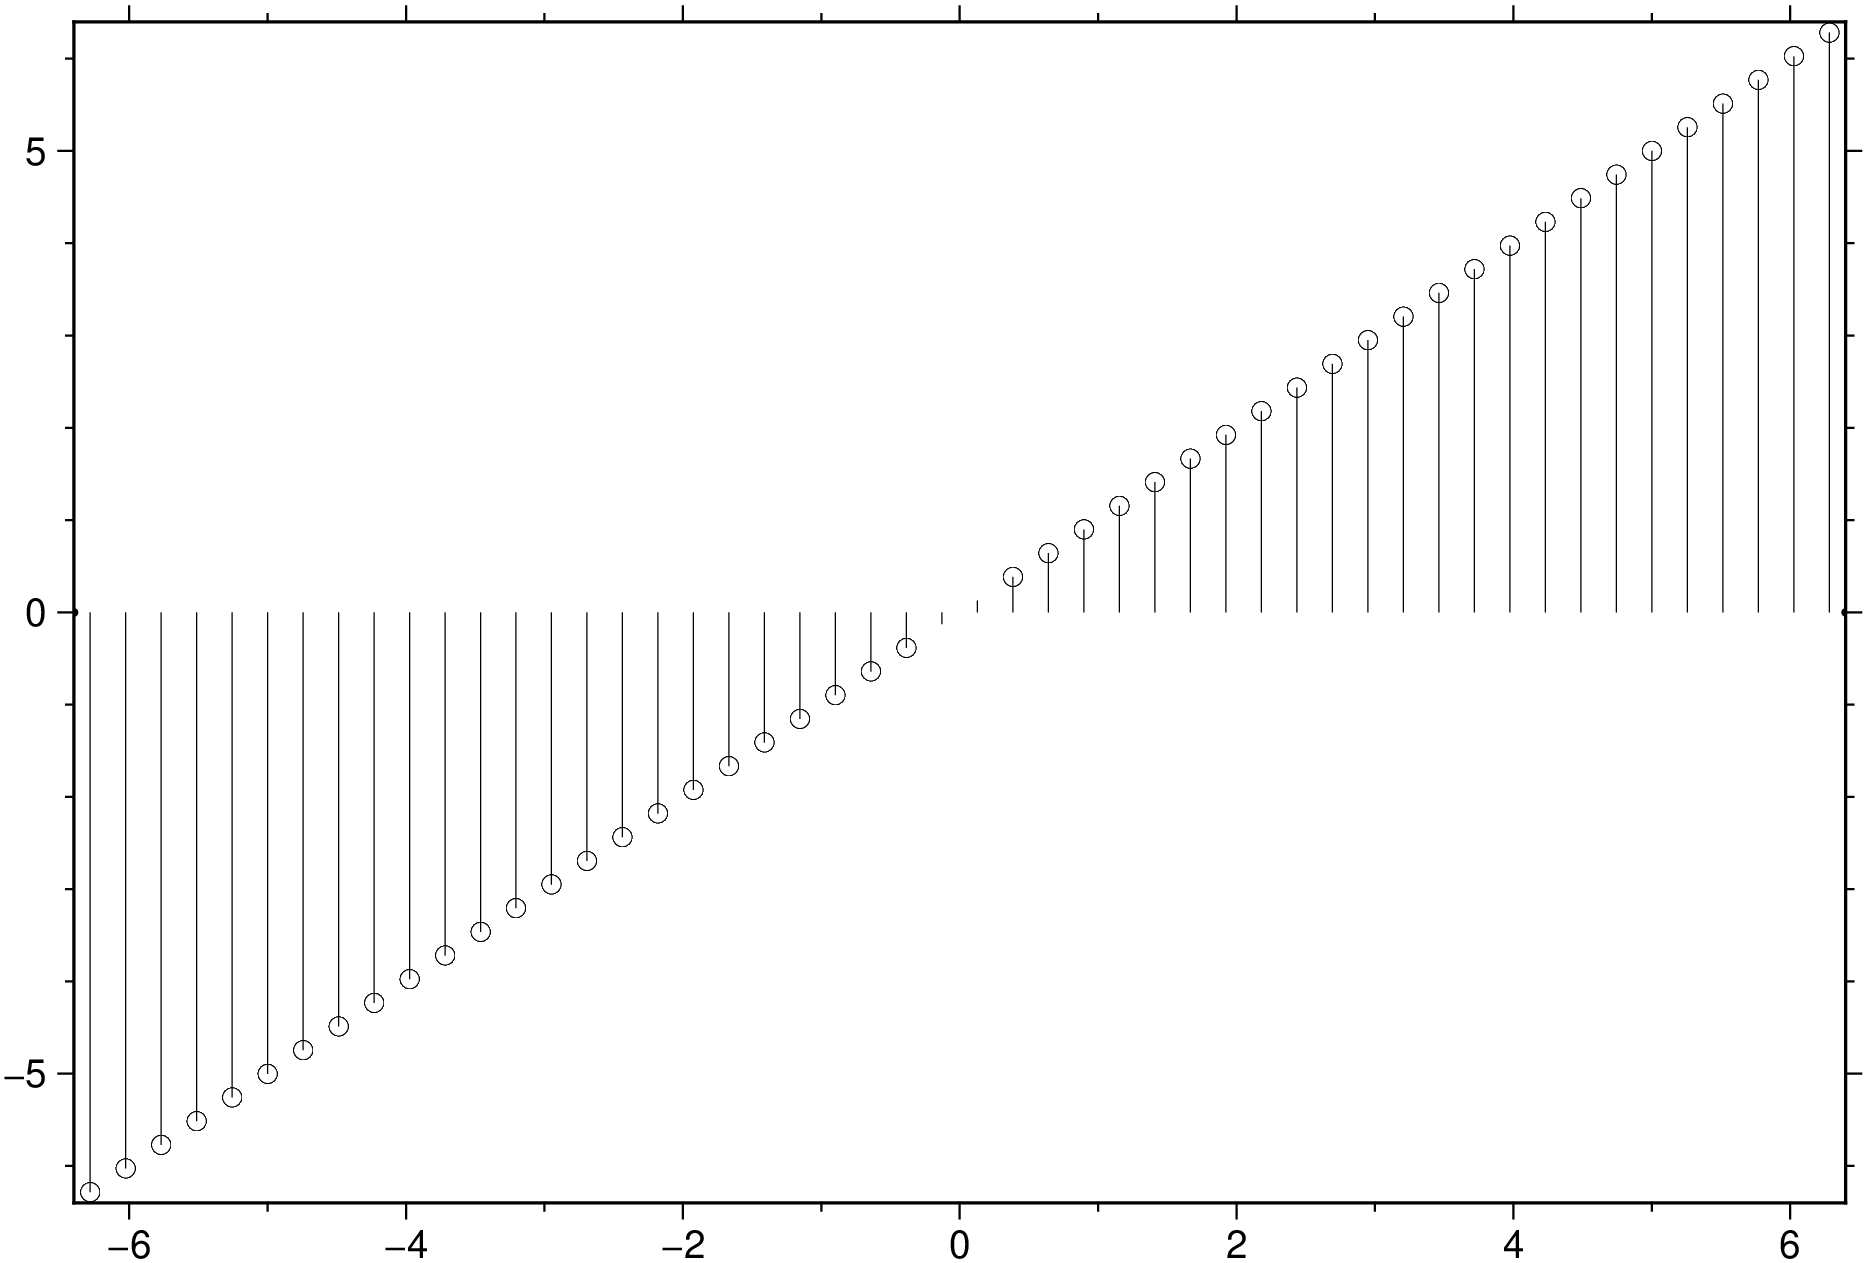
Two of them and with some variations.
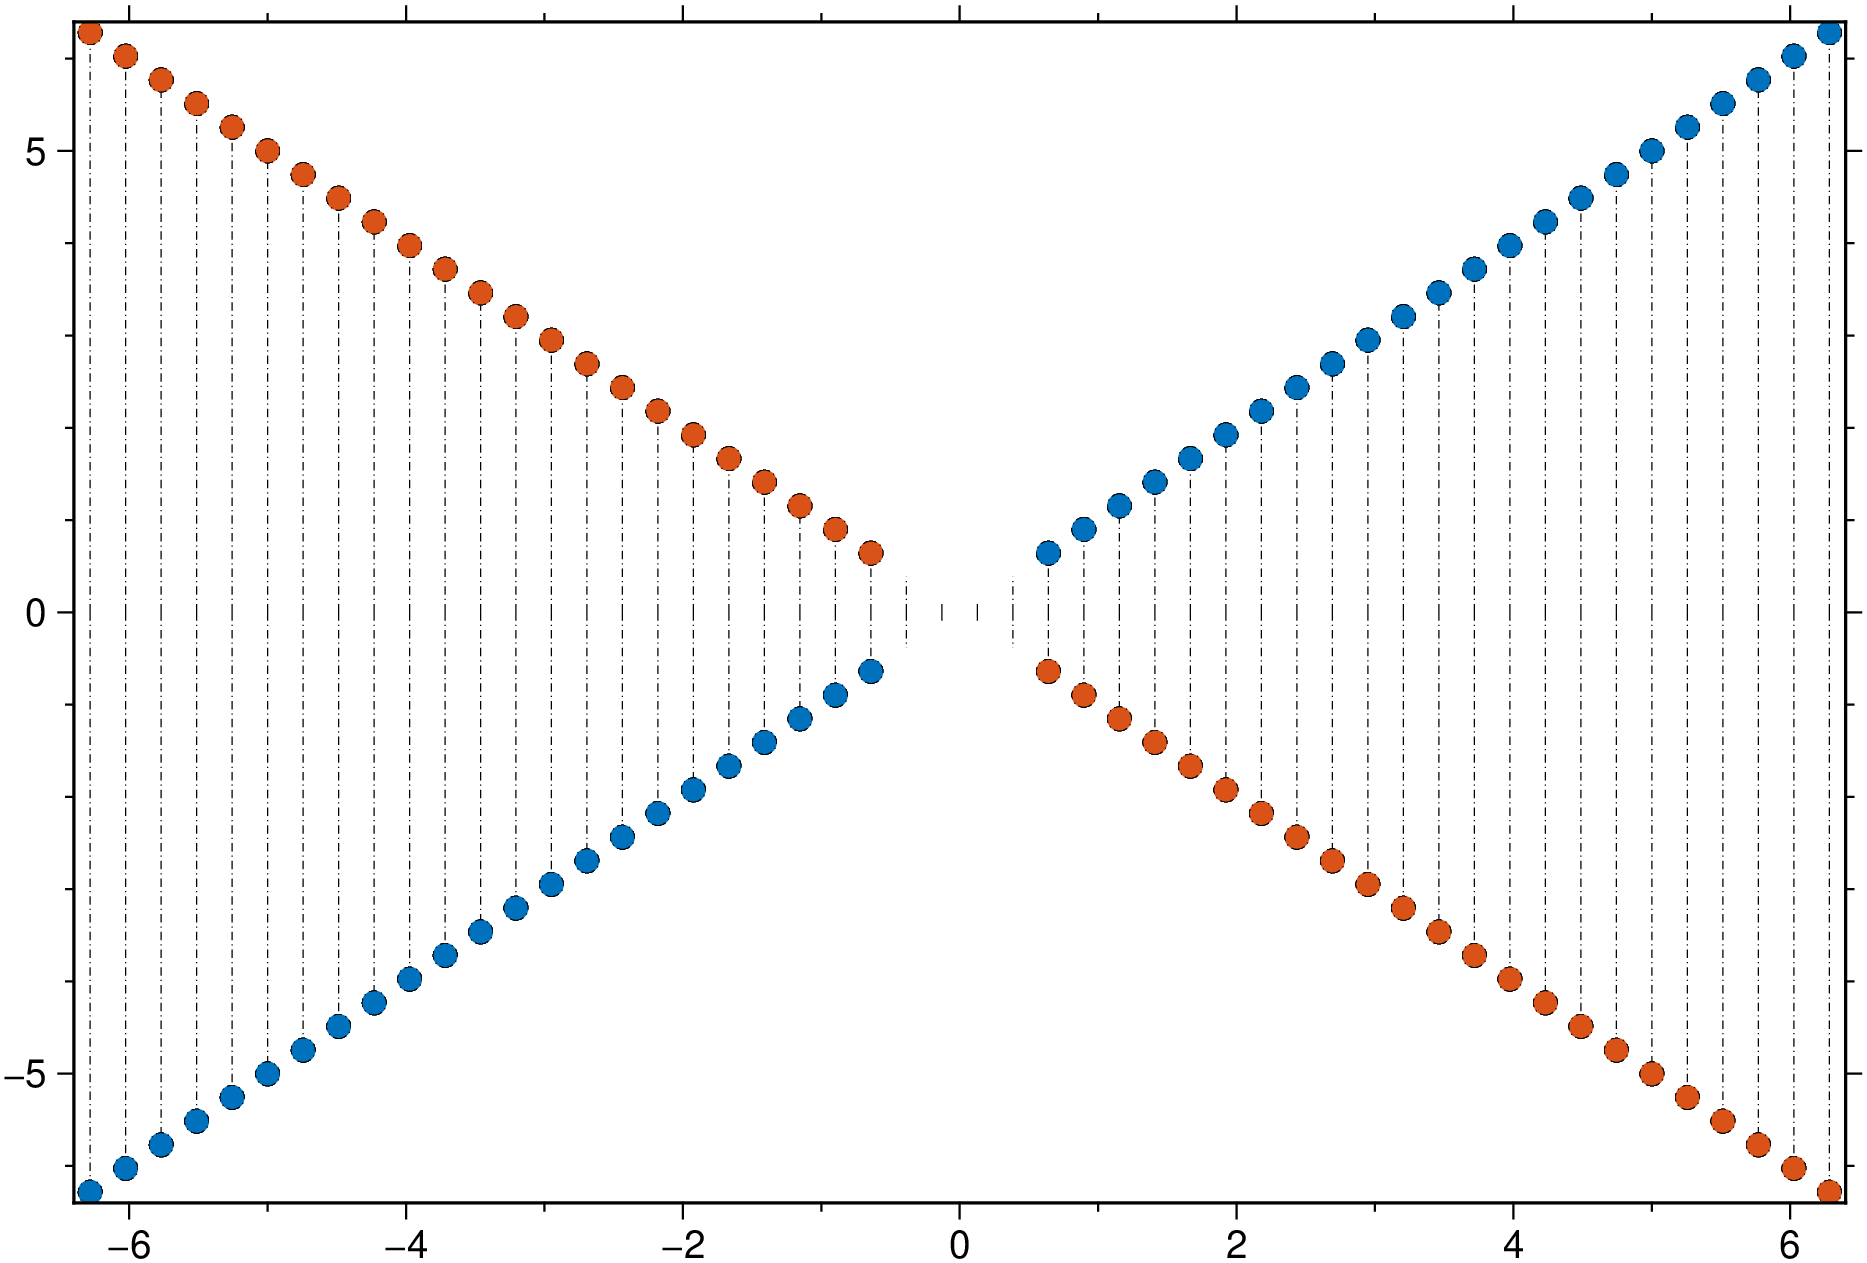
using GMT
Y = linspace(-2*pi,2*pi,50);
stem(Y,[Y -Y], multicol=true, fill=true, ms="10p", nobaseline=true, ls=:DashDot, show=true)