using GMT
x = linspace(0, 4*pi, 50);
stairs(x, sin.(x), lw=0.5, marker=:circ, show=true)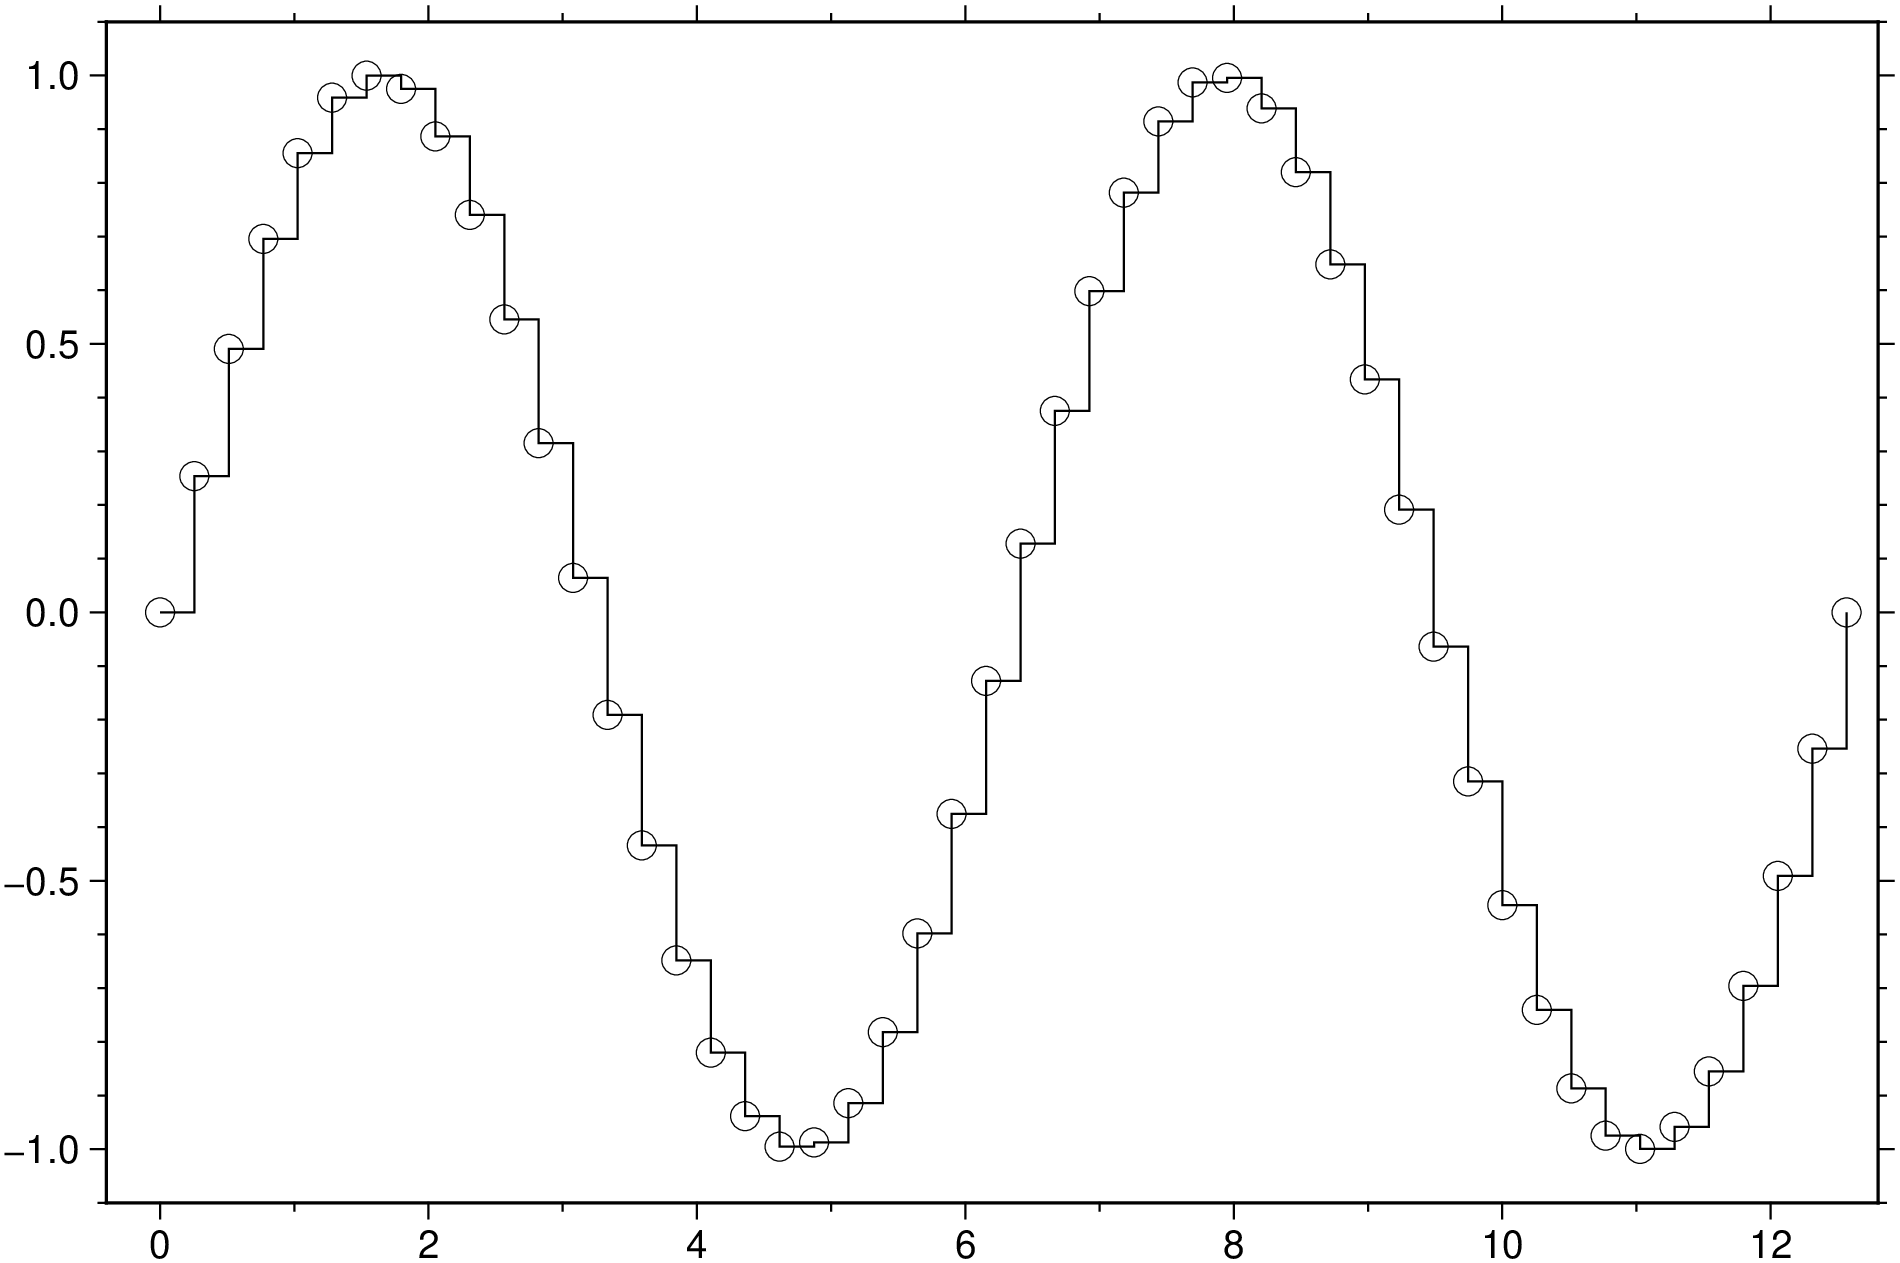
Create a stairs plot of sine evaluated at 50 equally spaced values between 0 and 4π.
using GMT
x = linspace(0, 4*pi, 50);
stairs(x, sin.(x), lw=0.5, marker=:circ, show=true)
Repeat but this time with lines moving first along y.
using GMT
x = linspace(0, 4*pi, 50);
stairs(x, sin.(x), step=:pre, lw=0.5, marker=:circ, show=true)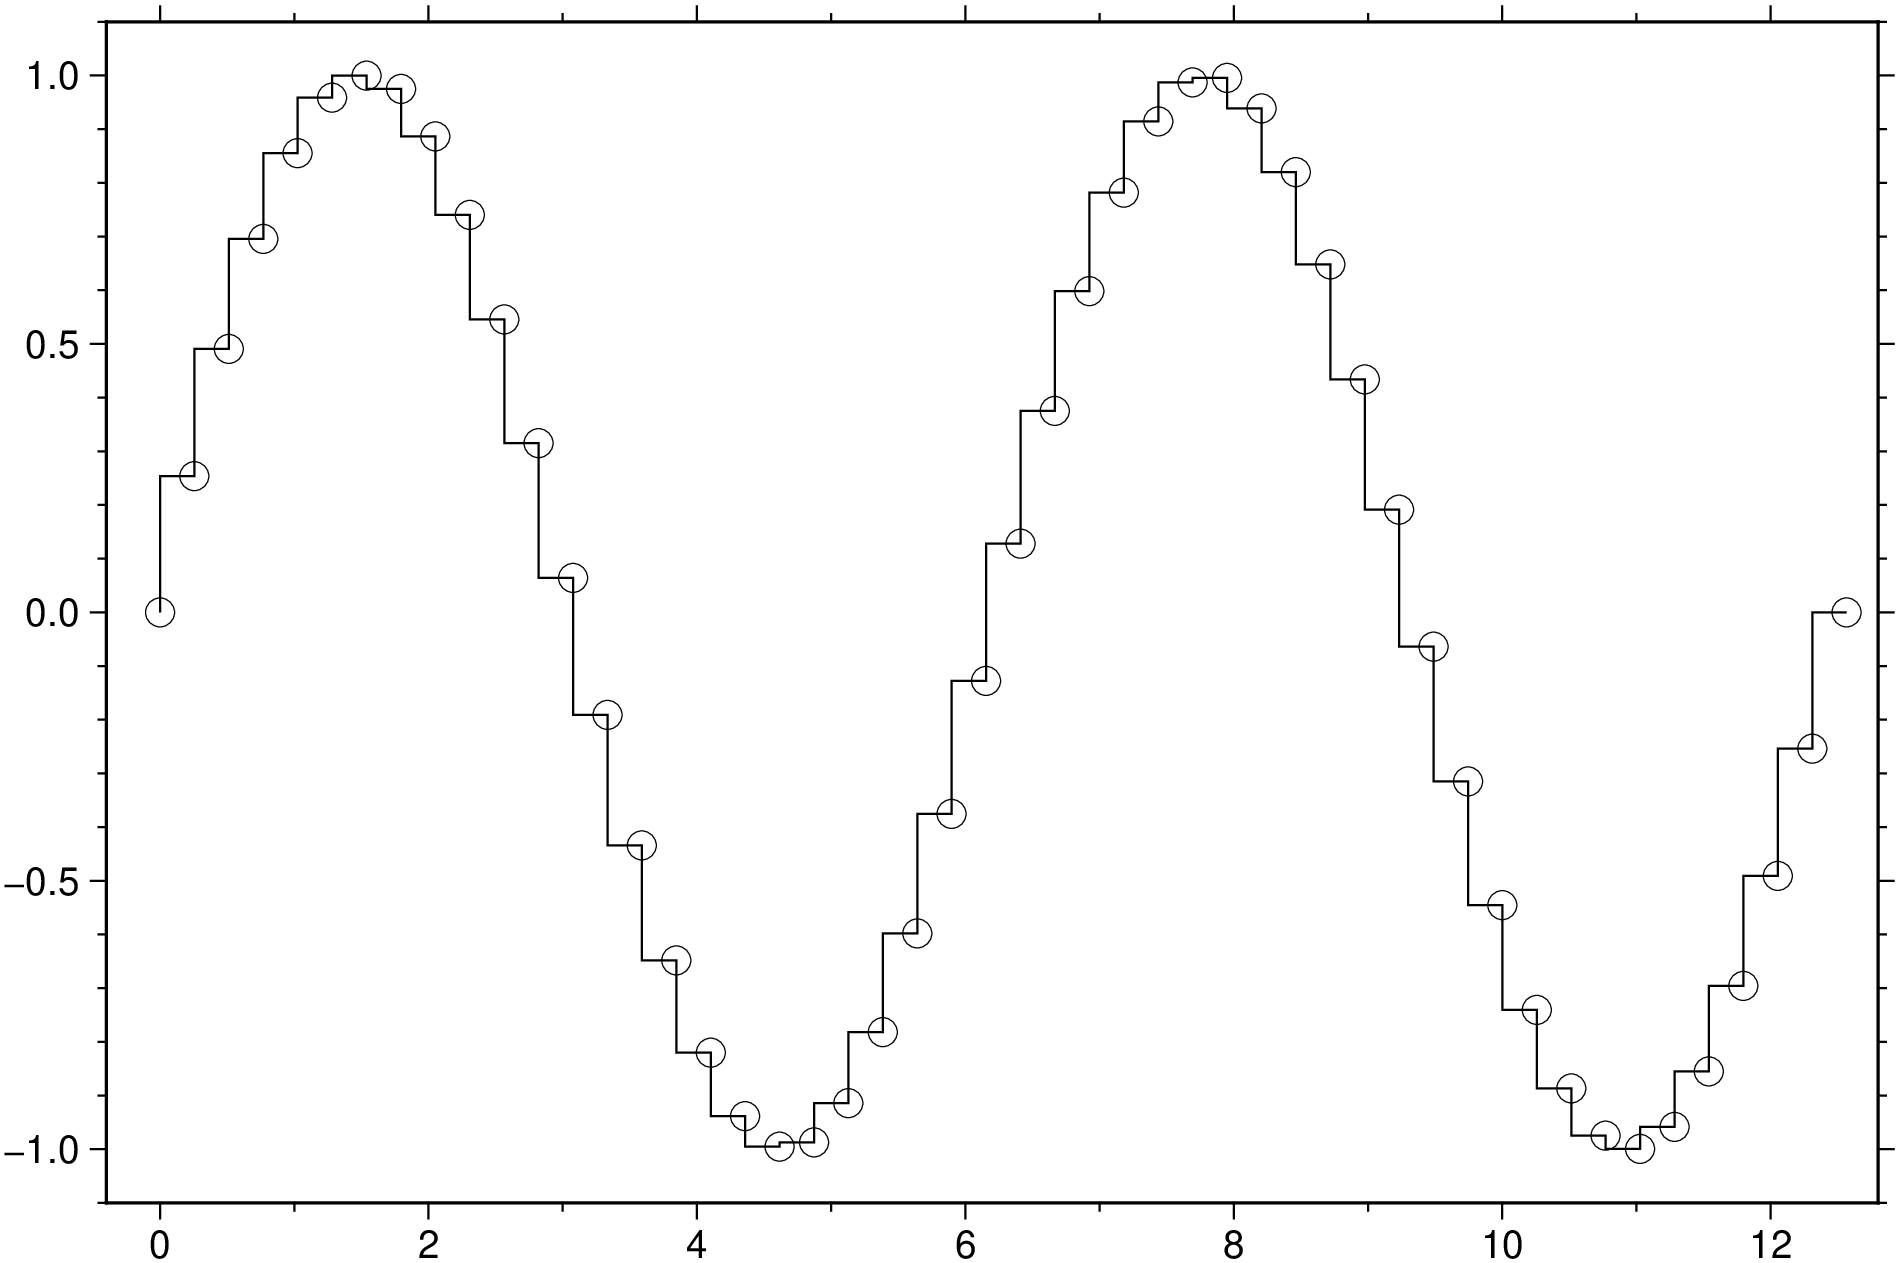
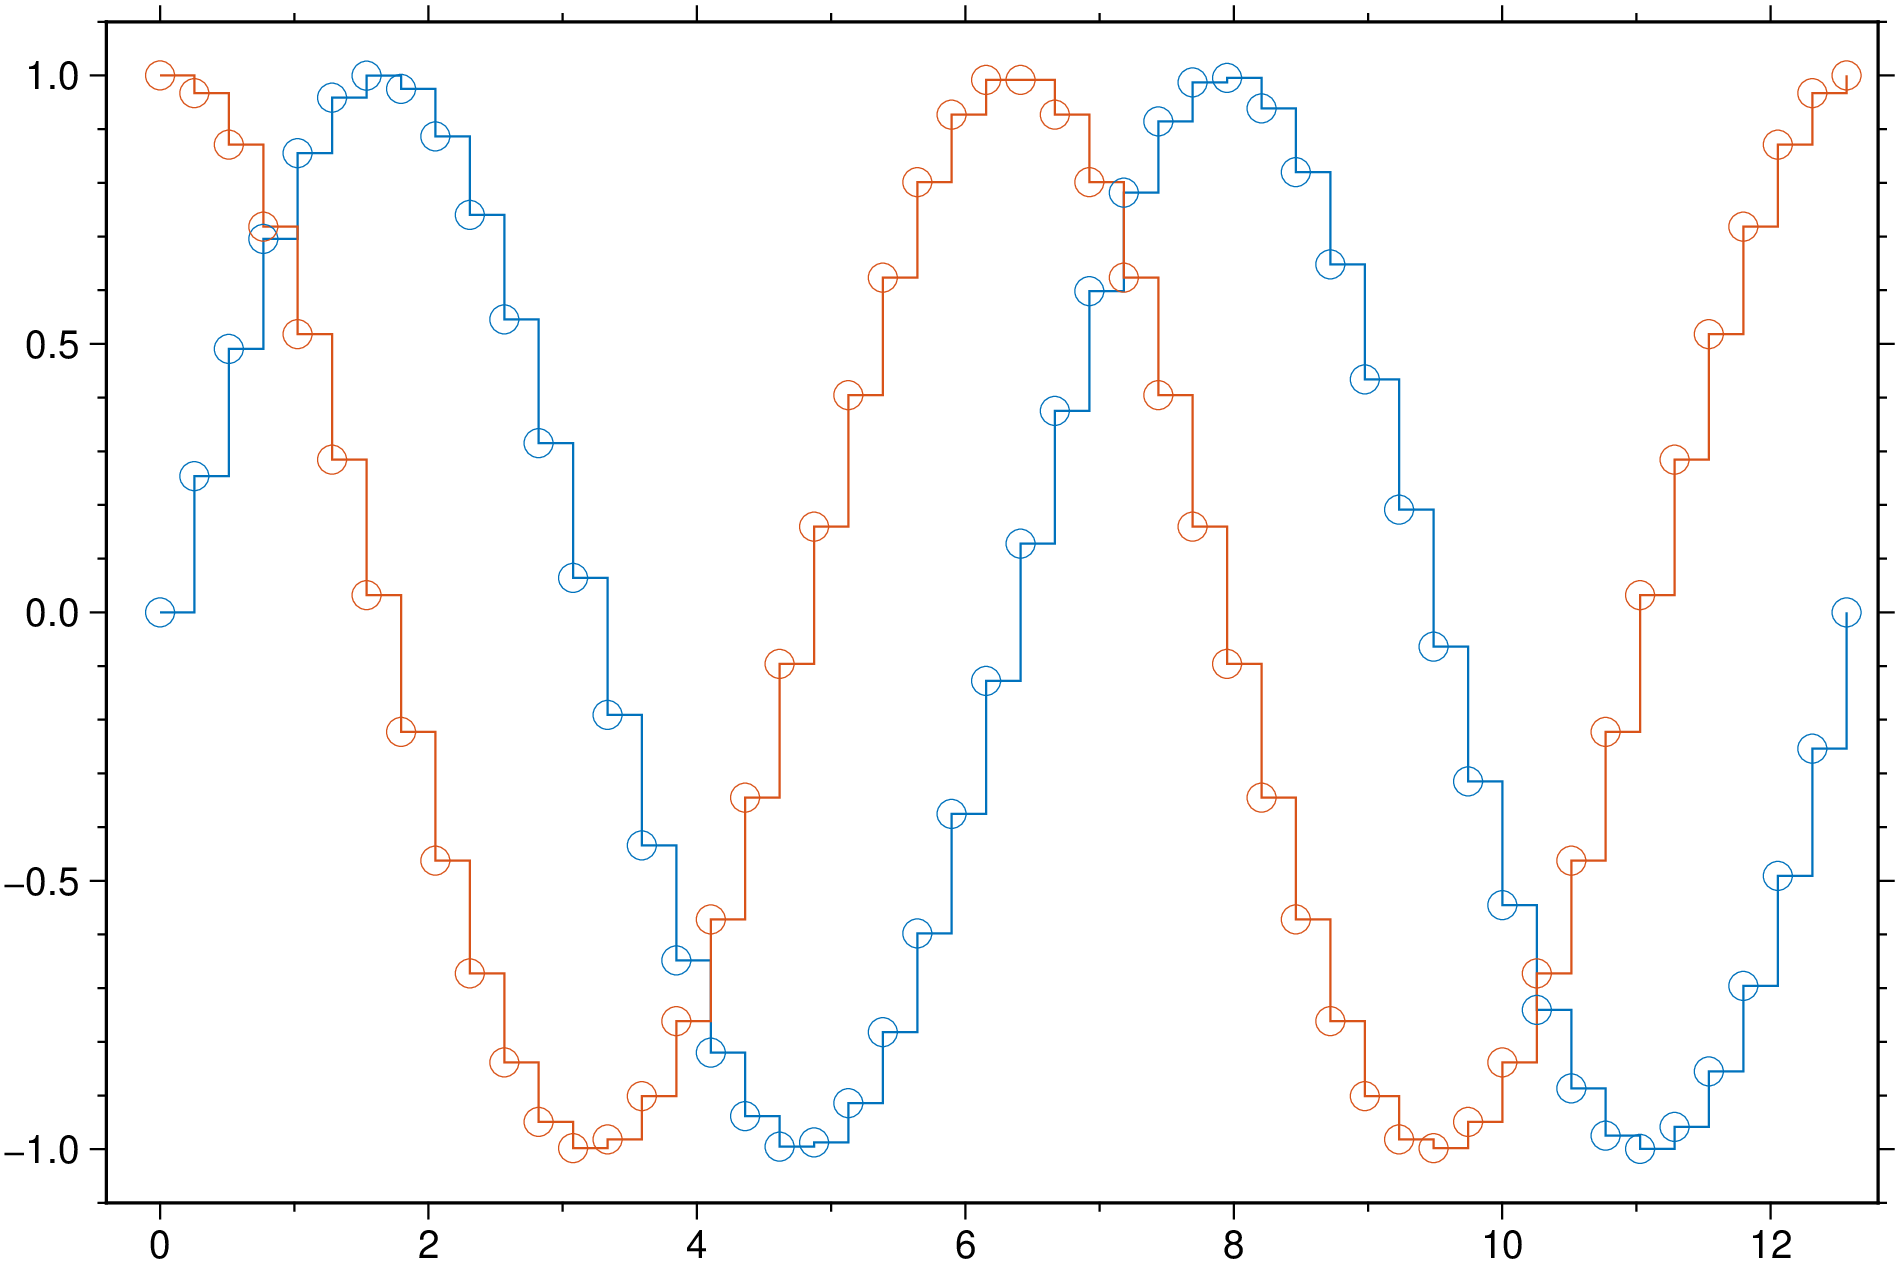
Create a stairs plot of sine and a cosine evaluated at same points as above and add a circle marker at the points location. Note that now we are selectiong the columns from teir names in the D GMTdataset.
using GMT
# Create a GMTdataset with named columns.
D = mat2ds([x sin.(x) cos.(x)], colnames=["x", "sin(x)", "cos(x)"]);
stairs(D, xvar=:x, yvar=["sin(x)", "cos(x)"], lw=0.5, marker=:circ, show=true)