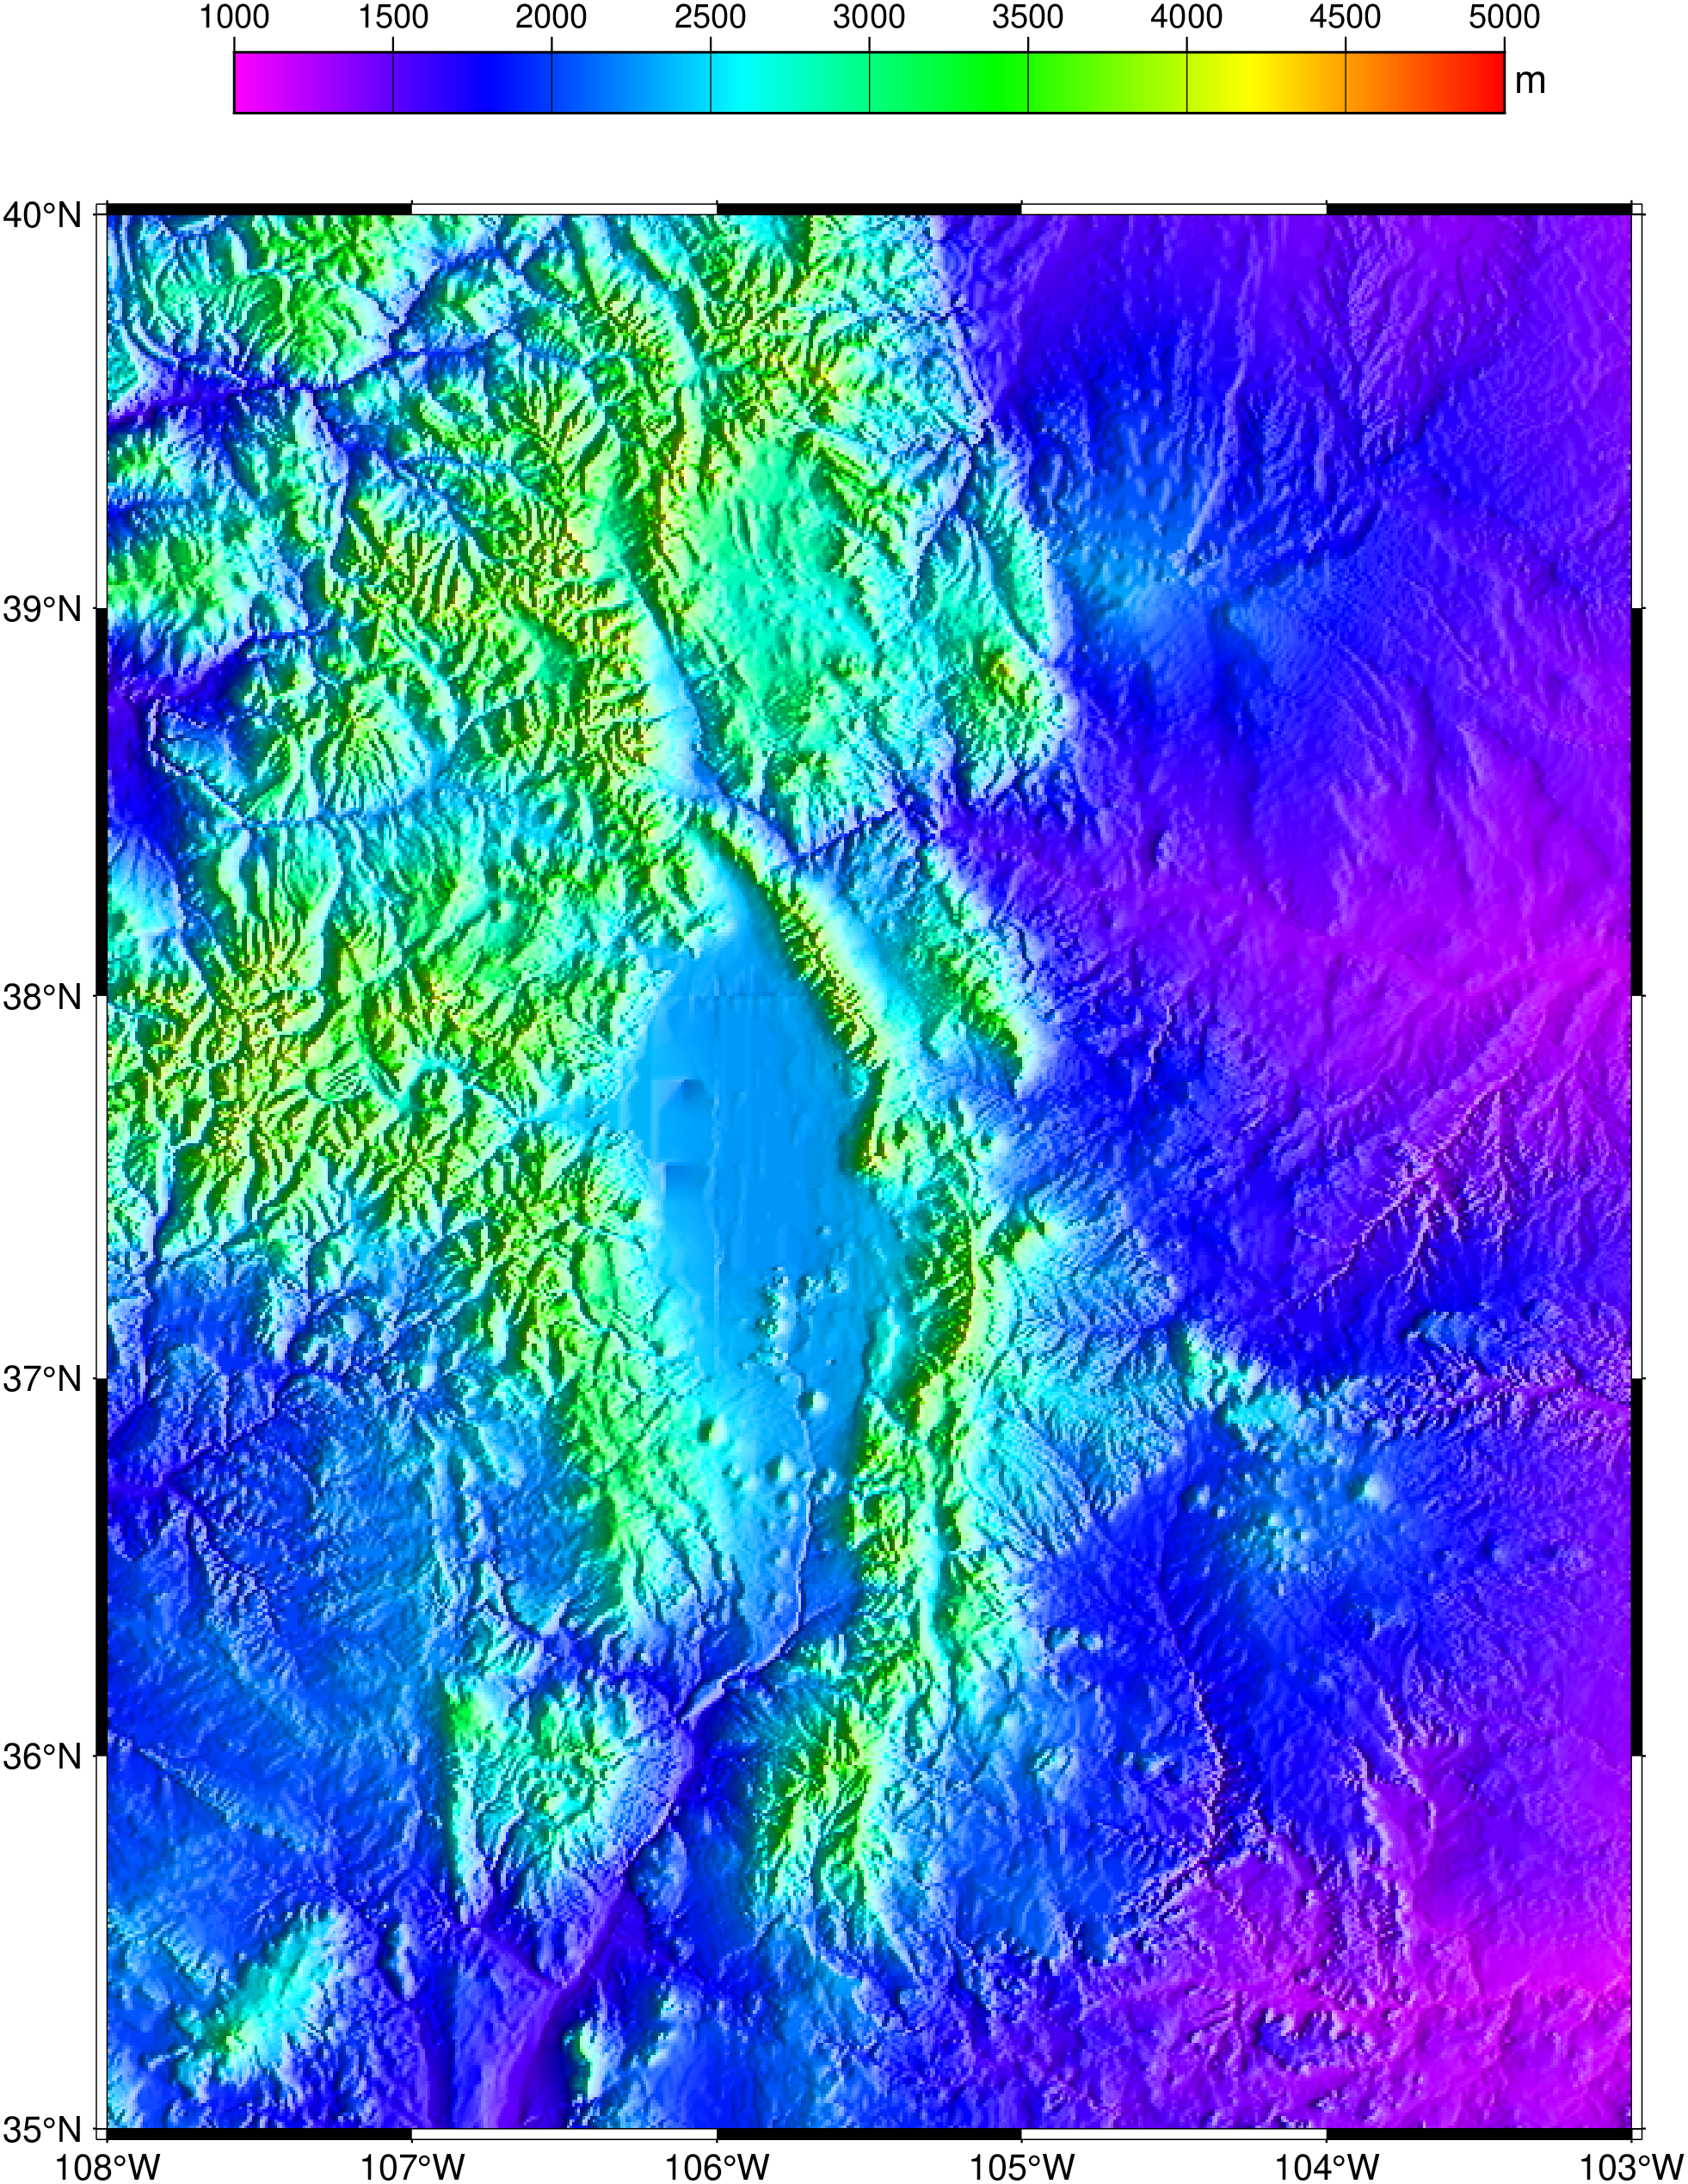
Color images are made with grdimage which takes the usual common options and a color map. It operates over grids or images. The next example shows how to create a color appropriate for the grid’s z range, plot the image and add a color scale. We use here the data keyword to tell the program to load the grid from a file. The @ before the tut_relief.nc file name instructs GMT to download the file from its server on the first usage and save it in a cache dir. See this GMT tutorial for more details about what the arguments mean.