using GMT

x,y,z = peaks(N=45, grid=false);
trisurf([x[:] y[:] z[:]], pen=0.5, show=true)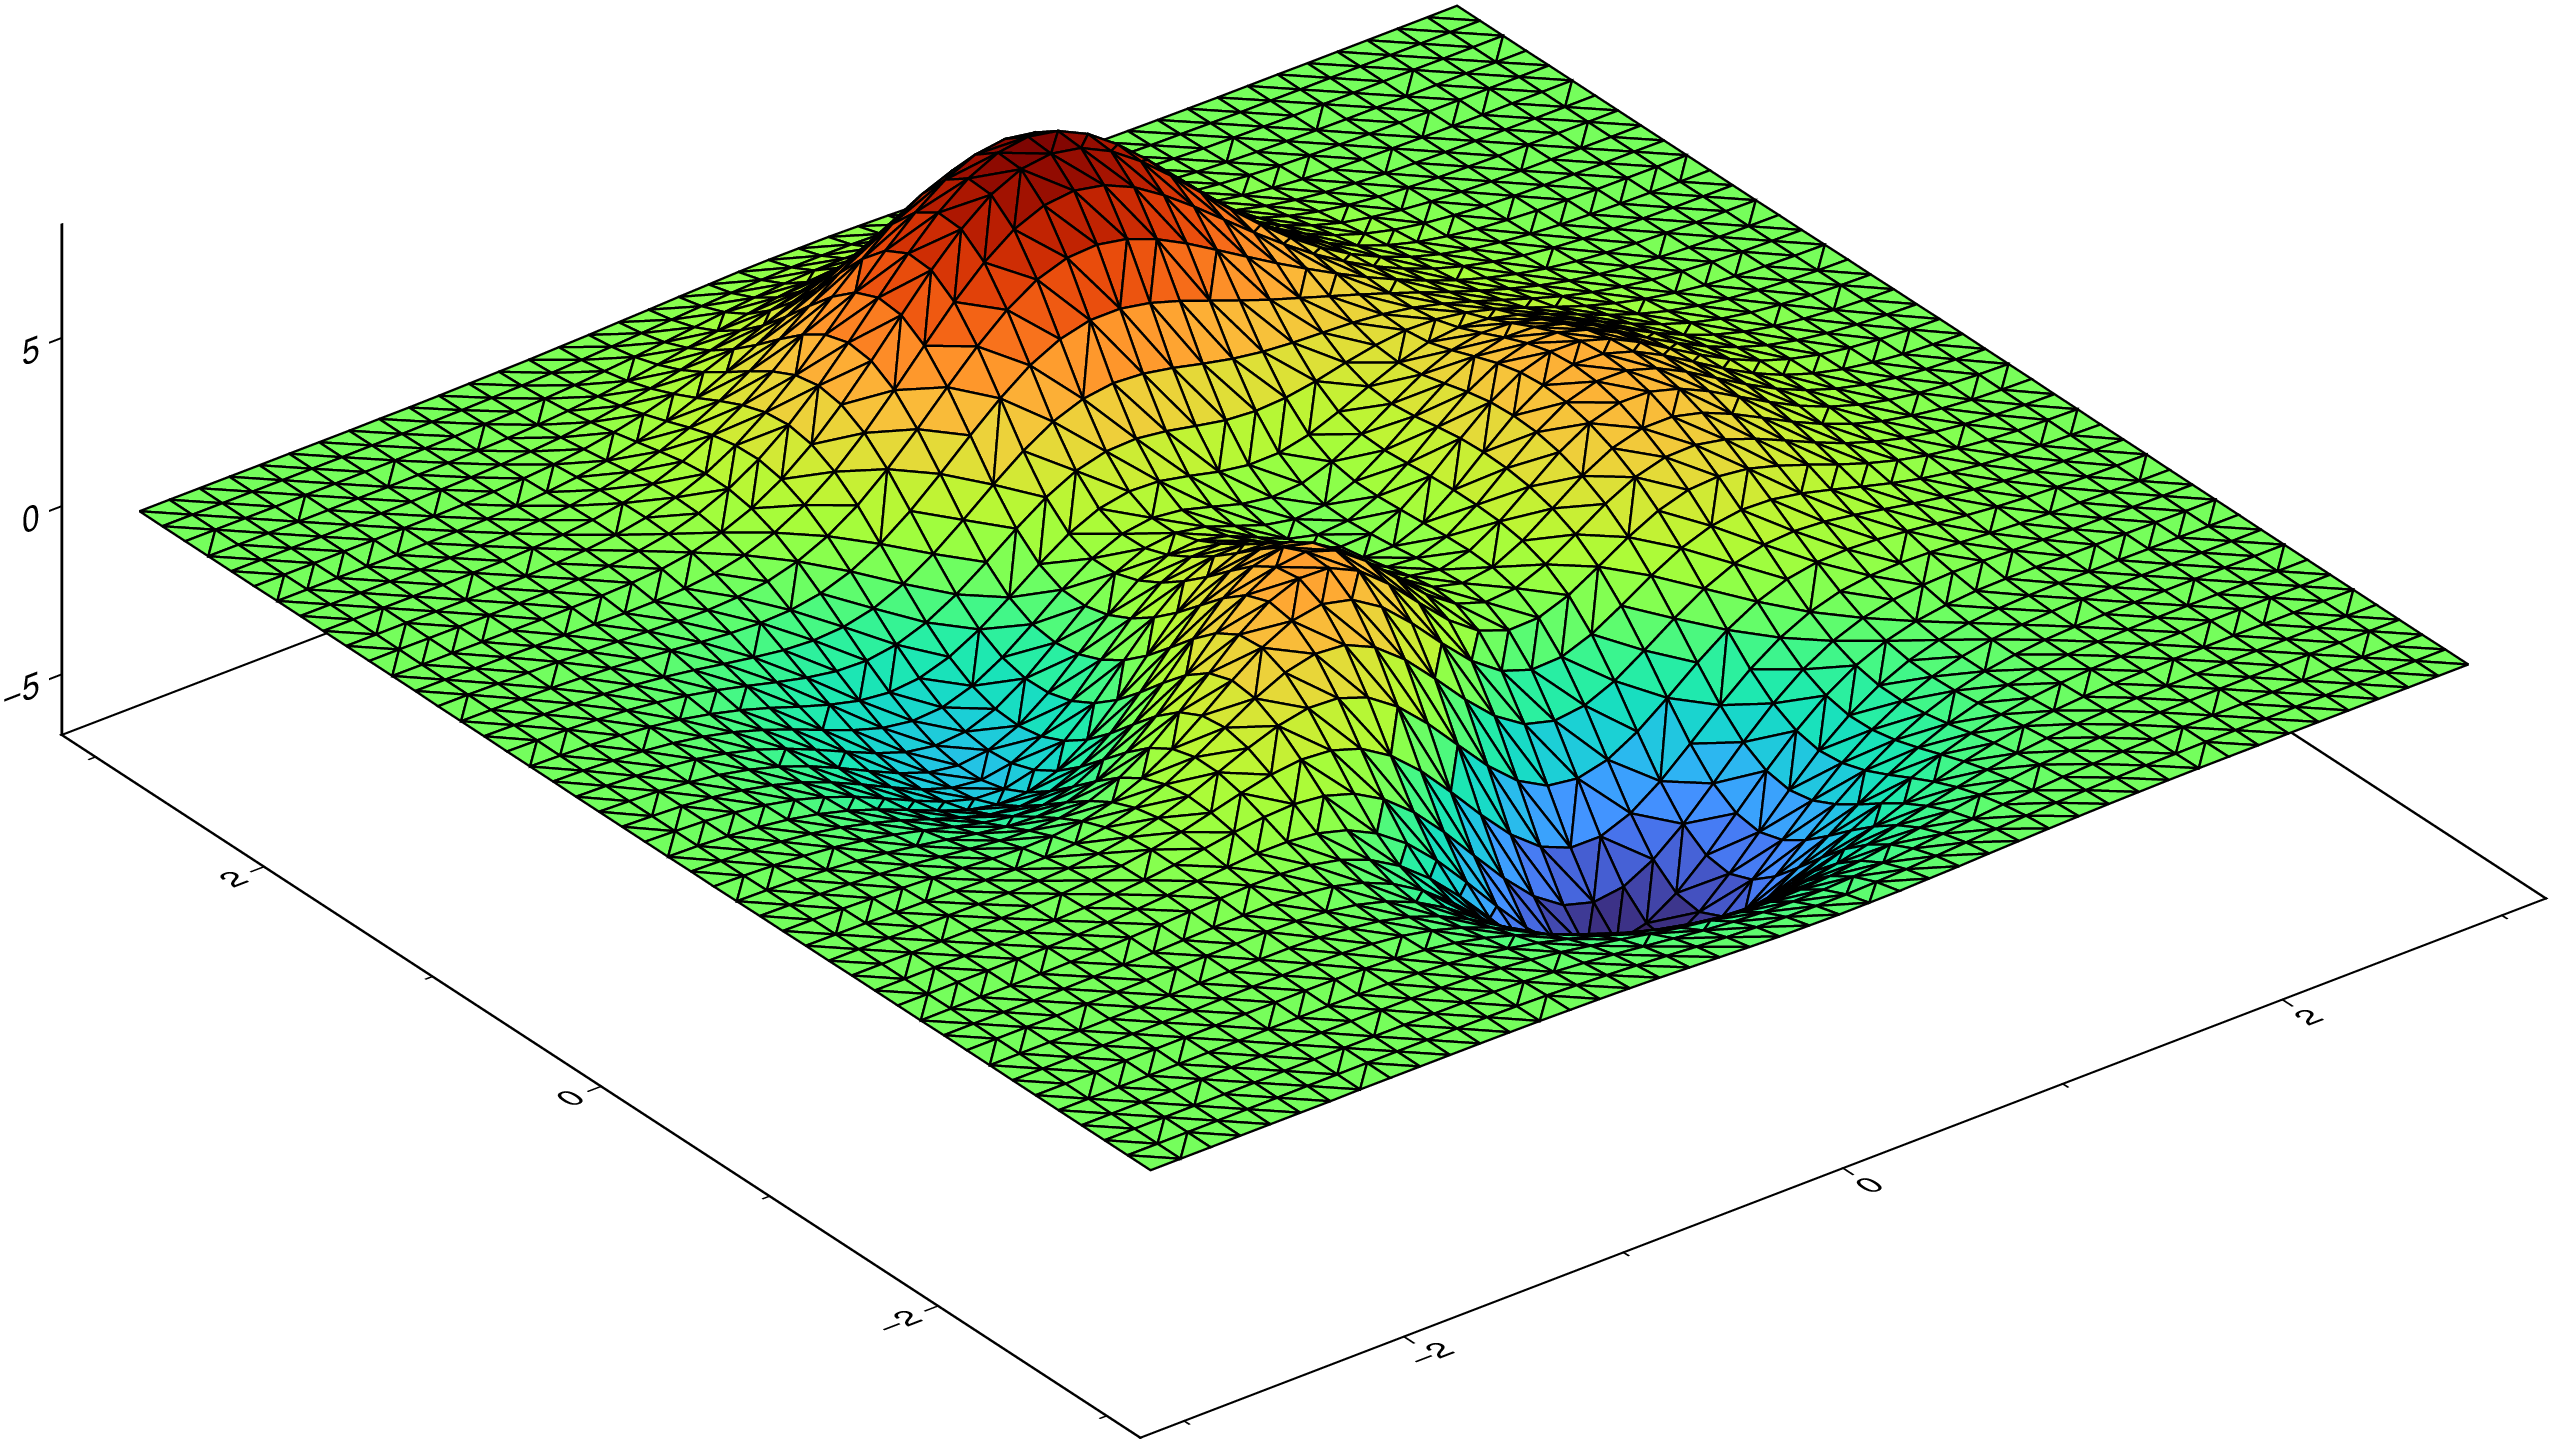
trisurf(in, kw...)Plots the 3-D triangular surface.
The triangulation is defined by the points in a Mx3 matrix or a GMTdataset with data x, y, z in the 3 first columns. The triangles are computed with a Delaunay triangulation done internaly. Since this is a plot3d avatar all options in this function are those of the plot3d program.
Create a set of 3-D points and plot the surface defined by the triangulation.
using GMT
x,y,z = peaks(N=45, grid=false);
trisurf([x[:] y[:] z[:]], pen=0.5, show=true)
This function has multiple methods:
trisurf(G::Union{String, GMTgrid}, G2; first, thickness, isbase, downsample, ratio, bottom, wall_only, top_only, geog, kw...) - triangulate.jl:187trisurf(G::Union{String, GMTgrid}; ...) - triangulate.jl:187trisurf(in::Union{GDtype, Matrix}; first, gdal, kw...) - triangulate.jl:166