sunsetrise(lat=38.7, lon=-9)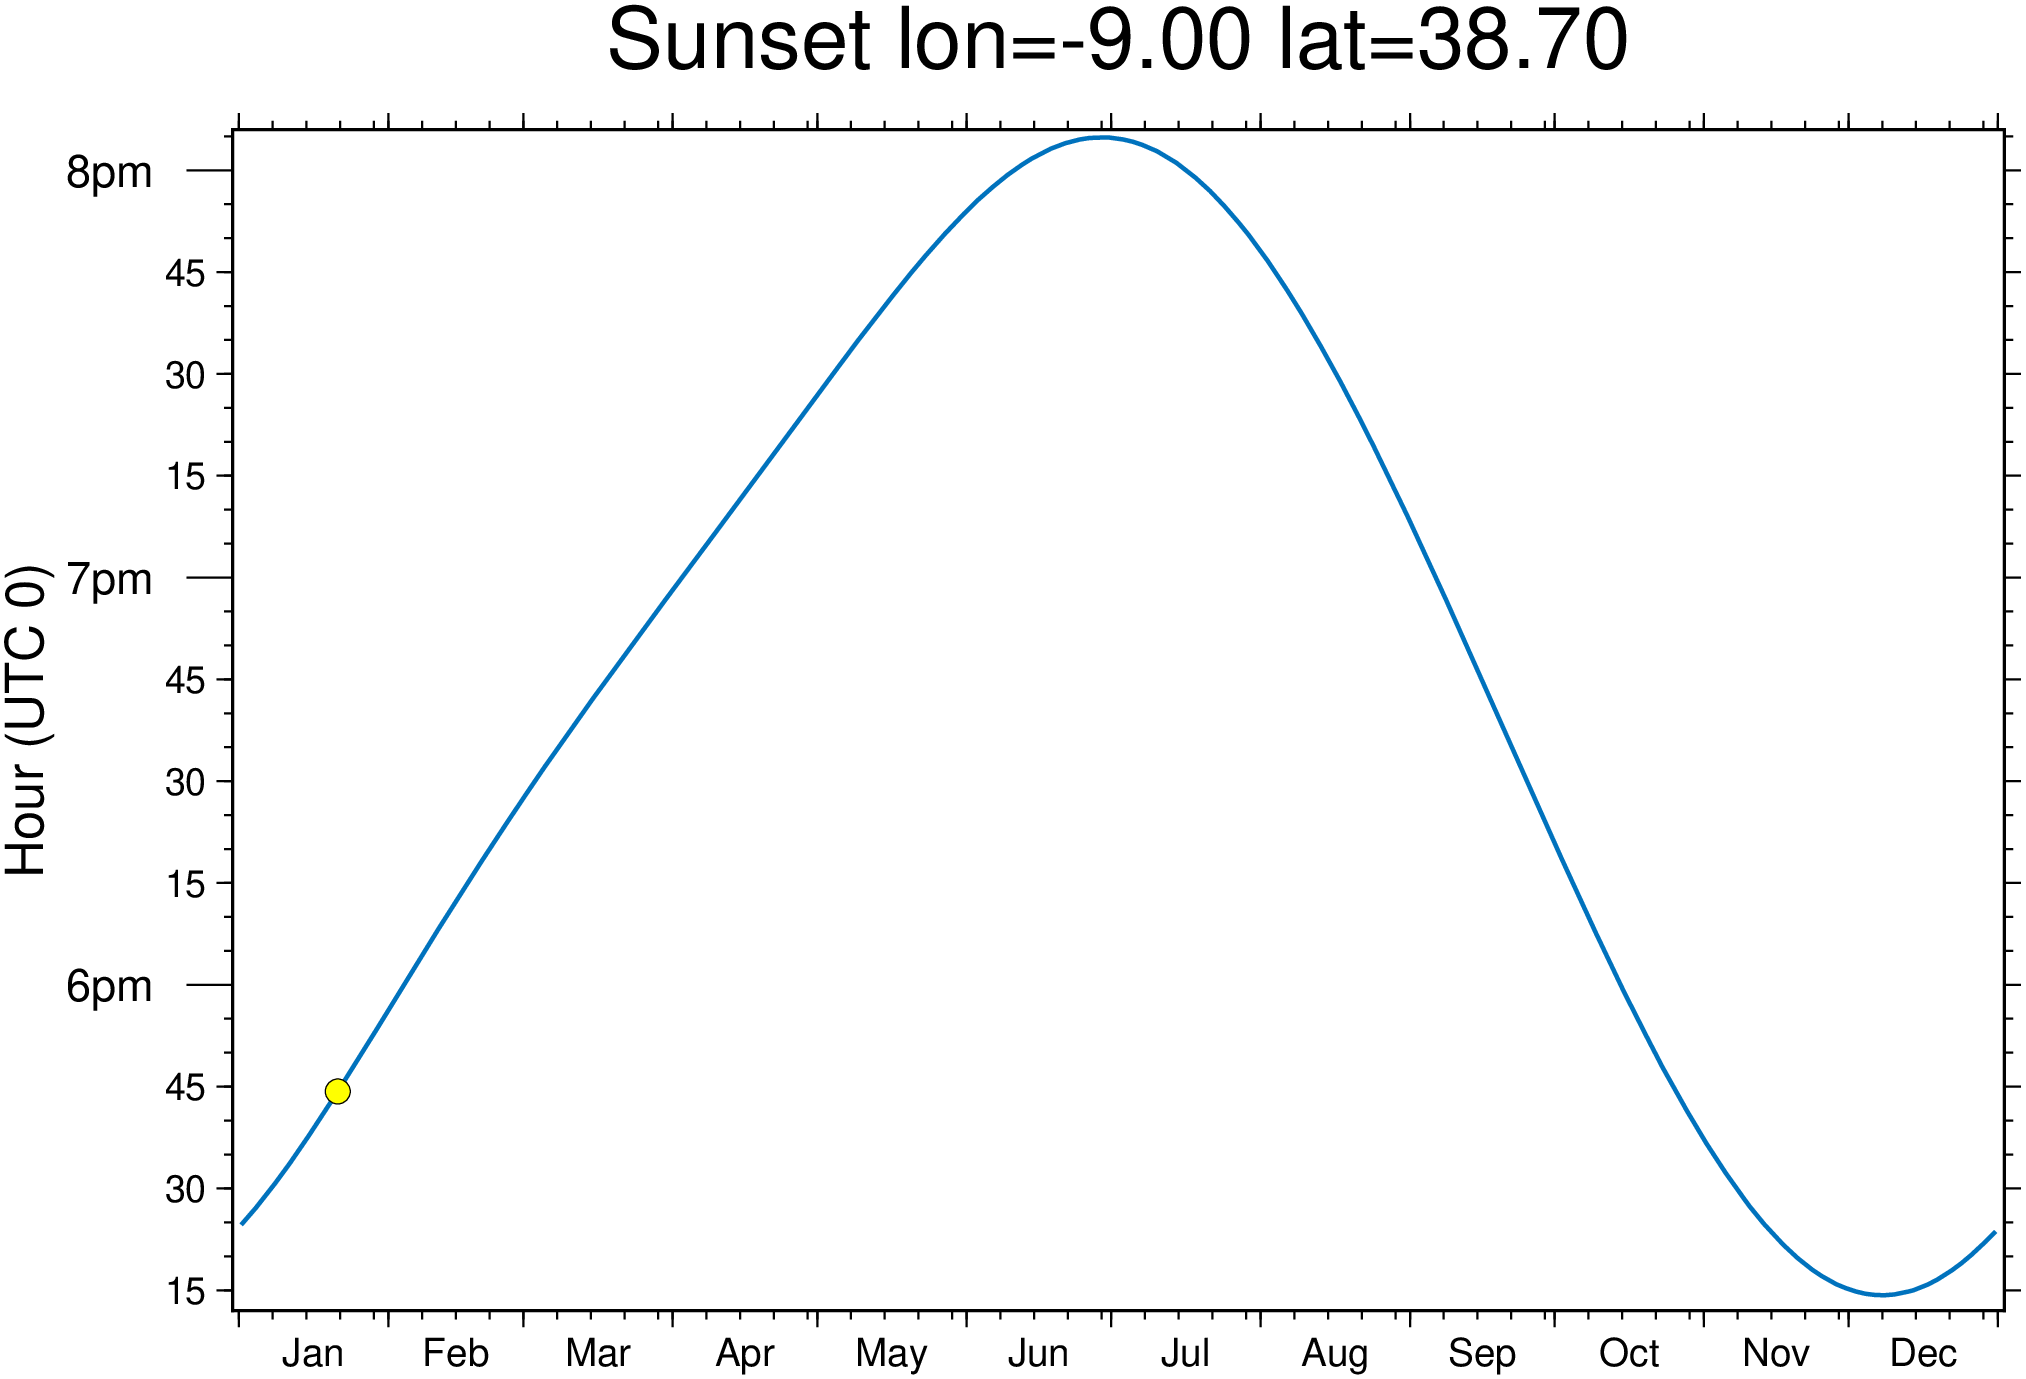
sunsetrise(; lon=0, lat=0, year=2026, TZ::Int=50, raise=false, both=false, data=false; kwargs...)Plot sunrise and sunset times throughout the year for a given location.
Uses GMT’s solar module for calculations.
lon : Observer longitude in degrees.
lat : Observer latitude in degrees. If both lon and lat are equal to zero (the default) we compute your approximate location using web service based your IP address (this adds a delay to the calculations).
year : Year for calculation (default: 2026). This is of minor importance but things slowly change with time.
TZ : Time zone offset in hours. By default (when the default value of 50 stands) we compute it from longitude but it doesn’t take into account daylight saving time.
raise=false: If true, plot sunrise times; if false, plot sunset times.
both=false: If true, plot both sunrise and sunset times.
data=false: If true, return the sunset or sunrise data (depending on rise) or both if both=true in a GMTdataset.
Additional kwargs are passed to plot
If data=true returns a GMTdataset if both is not set (false) or a tuple of GMTdatasets with sunrise and sunset data if both=true. Returns nothing if a plot is made.
sunsetrise(lat=60)            # High latitude with long summer days

Dsrise, Dsset = sunsetrise(lat=38.7, lon=-9, both=true, data=true) # Get sunrise/set datasunsetrise(lat=38.7, lon=-9)
View the source code for this function.