using GMT

stereonet([90 30; 180 45; 270 60; 0 15; 30 45; 120 48; 225 27; 350 80], show=true)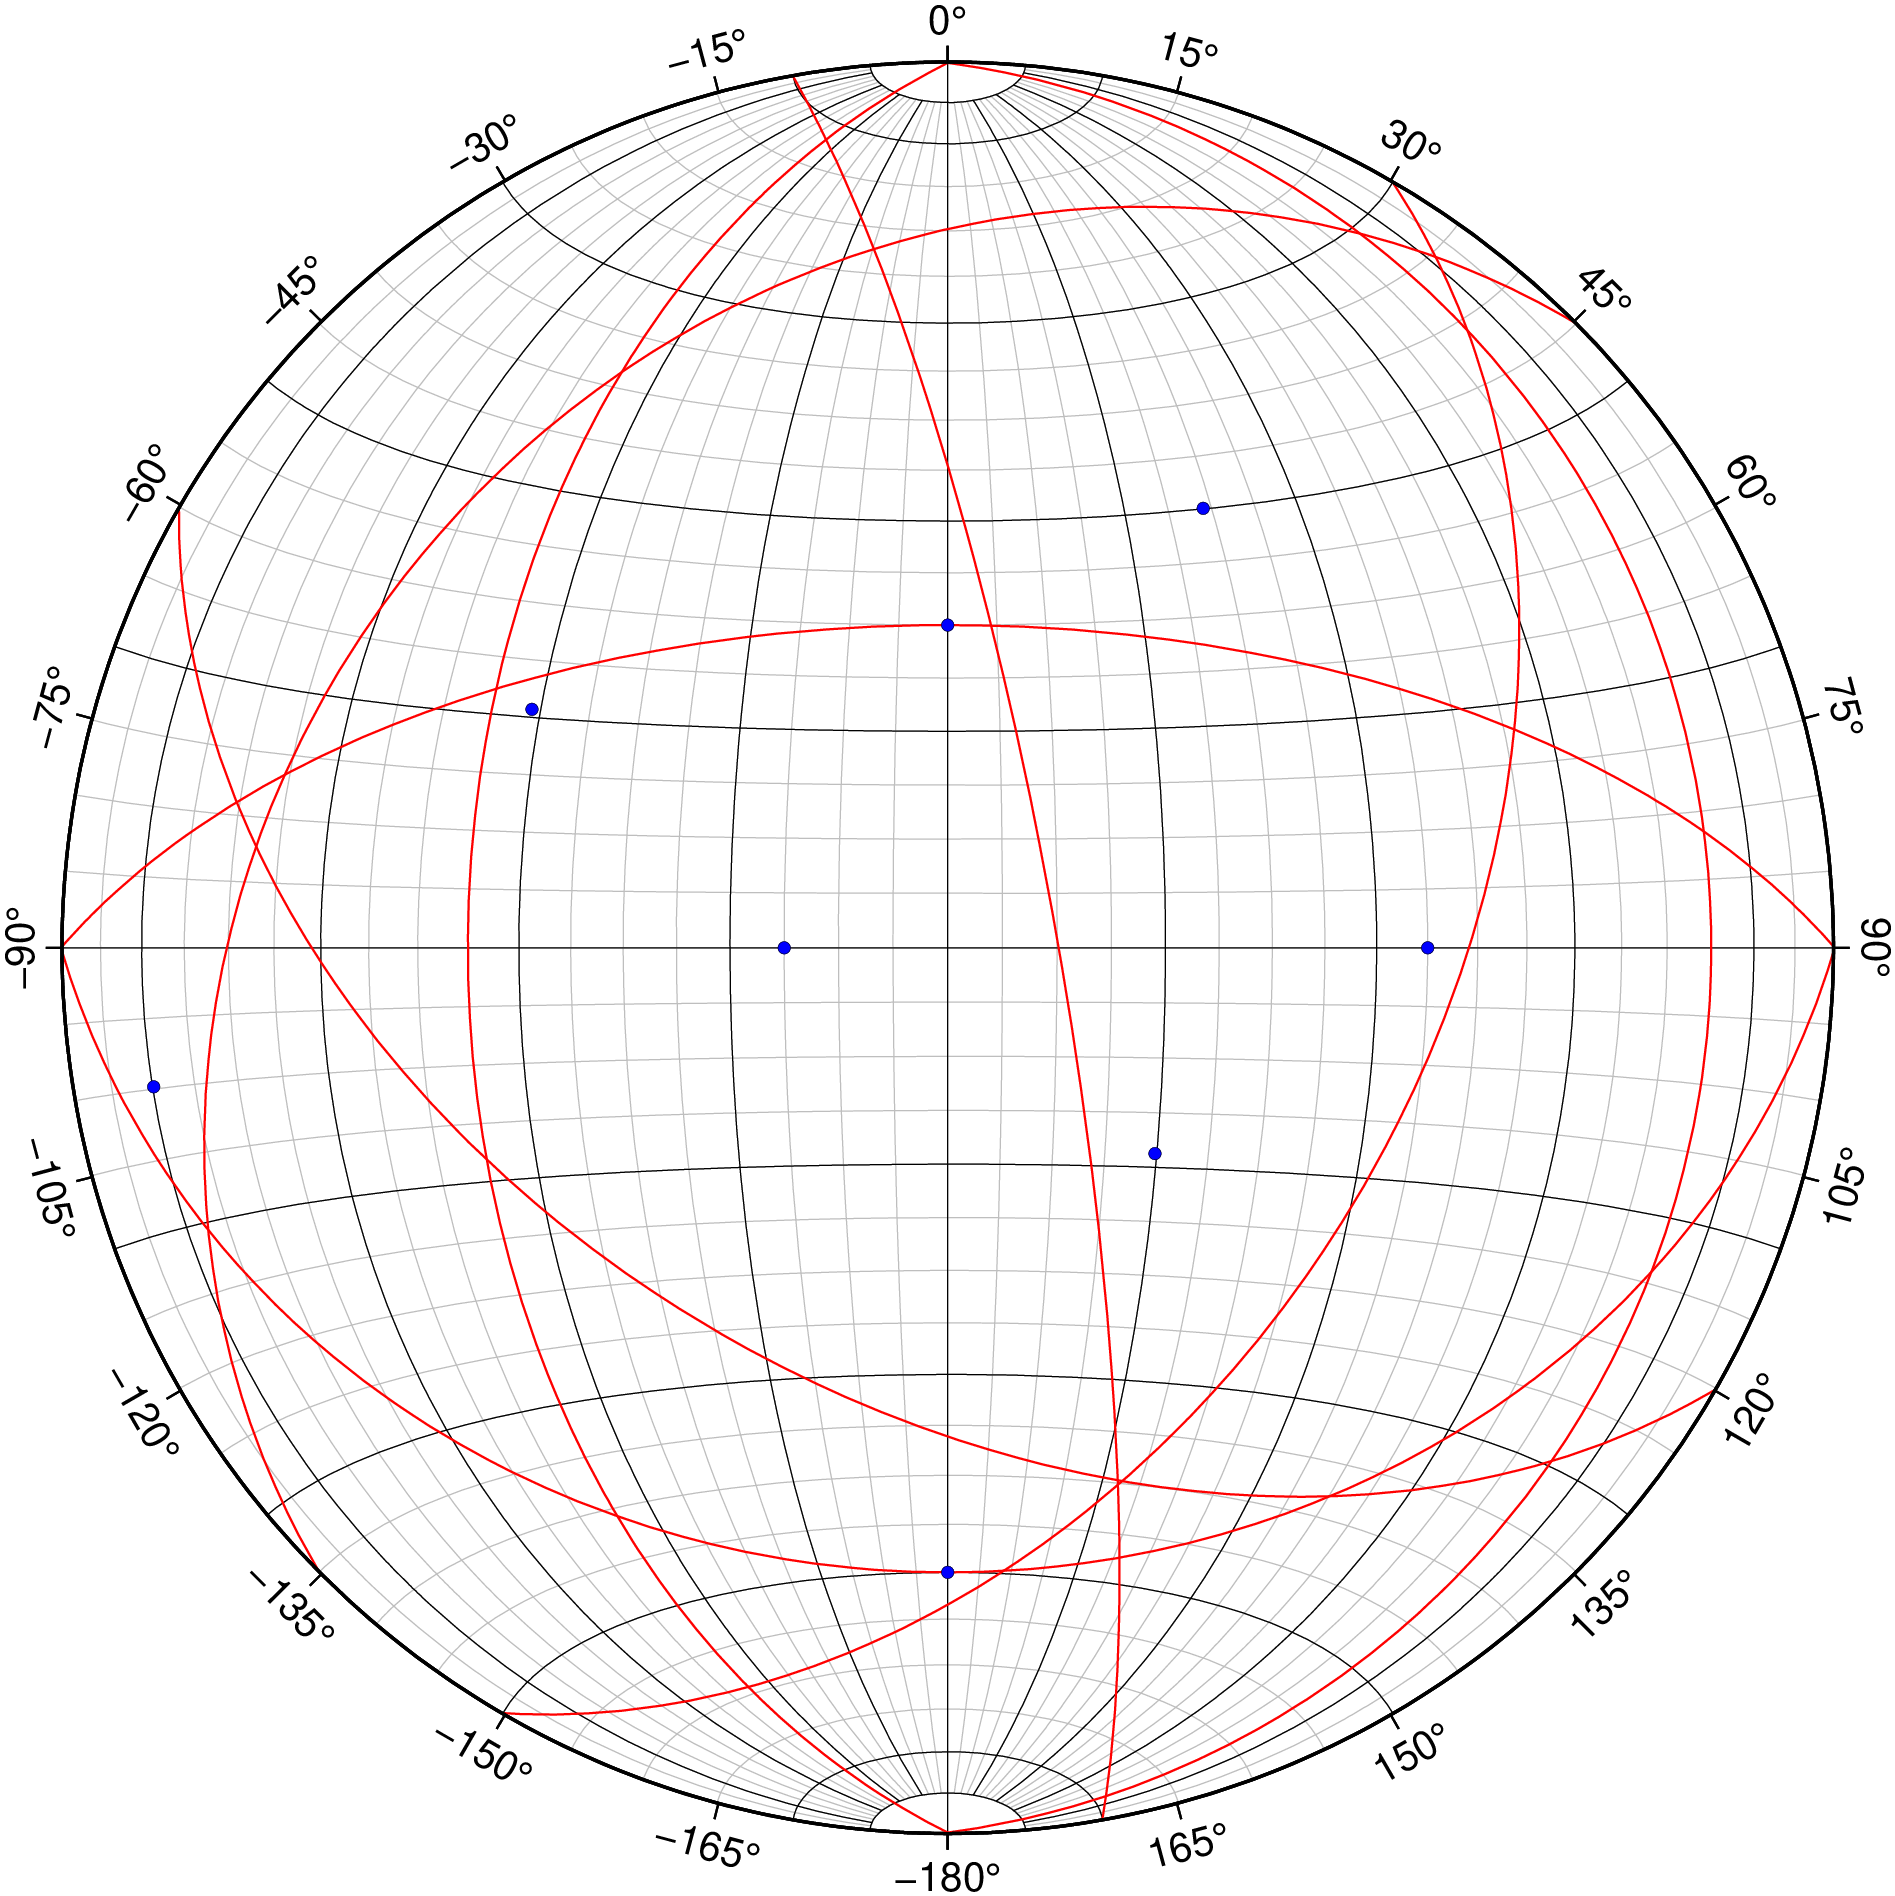
stereonet(mat::AbstractArray{T,2}; schmidt=true, wulff=false, kw...) where T<:RealPlot a stereonet map in either Schmidt or Wulff projection.
mat: A GMTdataset or a matrix with two columns: azimuth and plunge.
schmidt: If true, use Schmidt projection. If false, use Wulff projection.
wulff: If true, use Wulff projection.
kw: Additional keyword arguments to pass to the plot function. Namely, figsize, figname, and line & marker settings (see plots manual for details on them).
In case the produced figure is still not satisfactory, you can make one by yourself. For that use the Dv, Dp = stereonet_data(mat) function to get the fault planes and poles. A good place to start is the stereonet function itself. Type @edit GMT.stereonet([0 0]) to see the code.
using GMT
stereonet([90 30; 180 45; 270 60; 0 15; 30 45; 120 48; 225 27; 350 80], show=true)
View the source code for this function.