D = getdcw("Africa", file=:ODS) # Use the small ODS.nc file
fourcolors(D, groupby="CODE")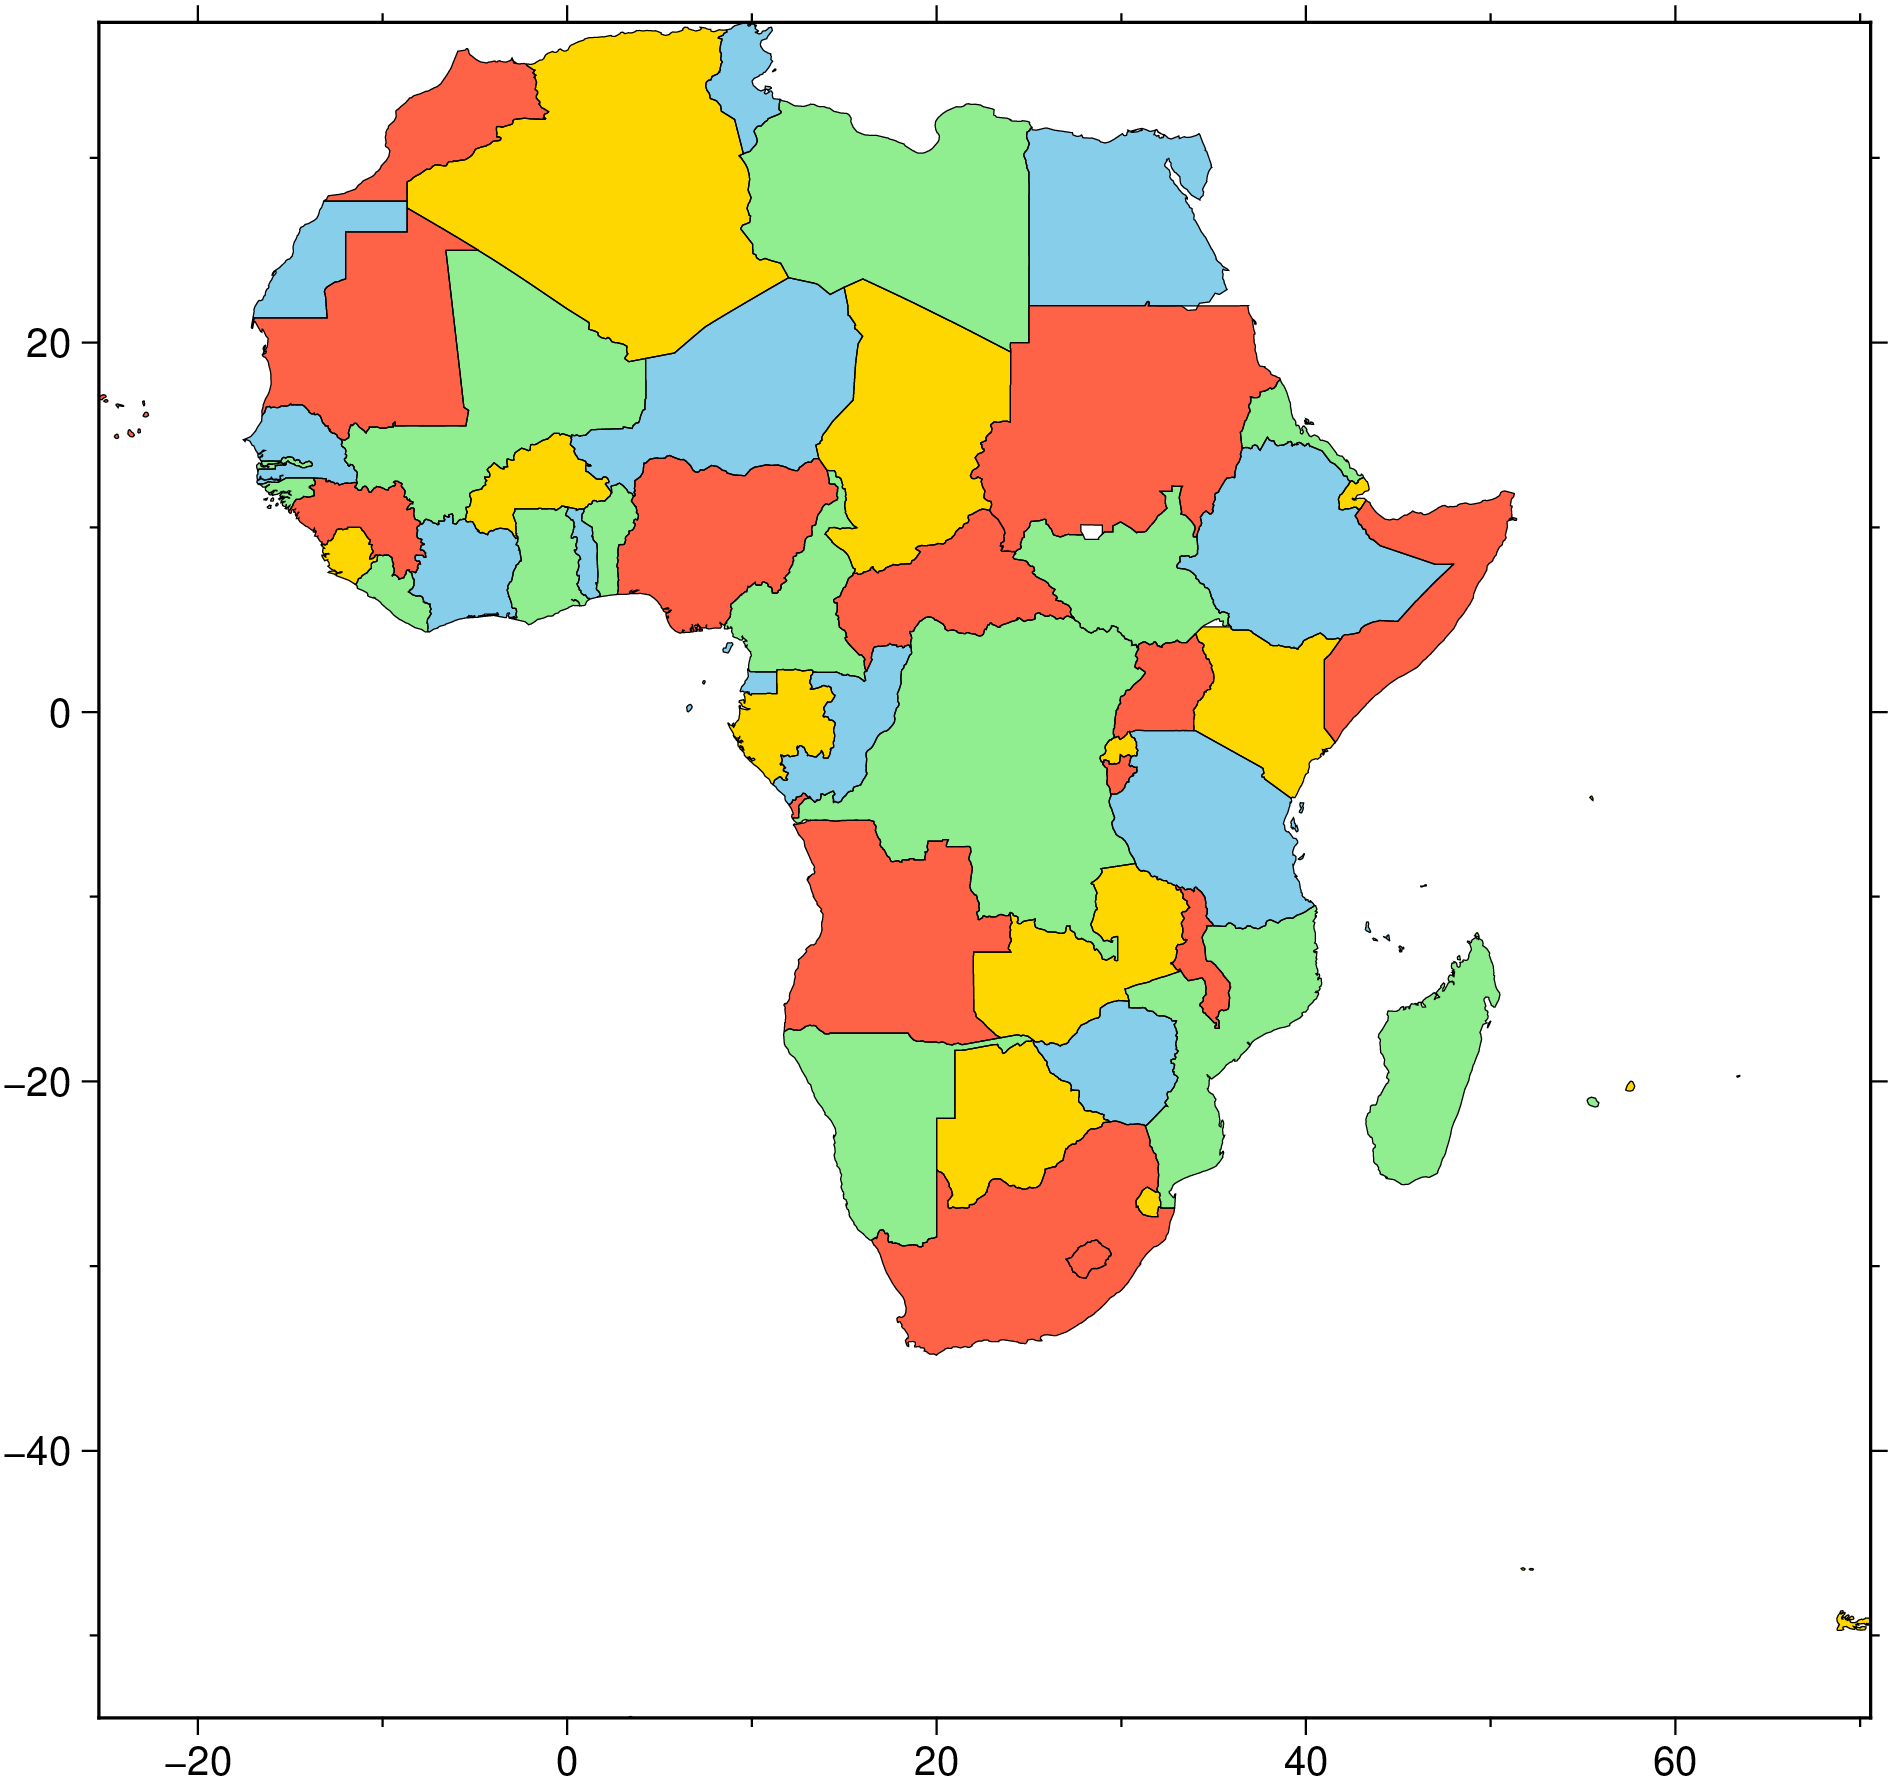
fourcolors(polys; groupby="", colors=[:tomato, :skyblue, :lightgreen, :gold], index=false, show=true, kw...)Apply graph coloring to assign colors to polygons such that no two adjacent polygons share the same color.
polys: Vector of GMTdataset polygons, or a filename with polygons.groupby: Attribute name to group polygons (e.g., country code). All polygons with the same attribute value get the same color. Use "" to treat each polygon independently. Default: “CODE”
ncolors: Number of colors to use. Default: 4 (four color theorem). Use more for fewer regions (e.g., 7 for continents) to get distinct colors for each.
colors: Vector of color names or R/G/B strings. Default: [:tomato, :skyblue, :lightgreen, :gold] If ncolors > length(colors), colors will cycle.
index: If true, return only the color indices without plotting. Default: false
kw...: Additional keyword arguments passed to plot for visualization.
index=false. Otherwise, return Vector{Int}: Color indices (1-ncolors) for each polygon.Note, if index=true, is used we get just a vector of color indices that can be used to color the polygons in other contexts. To help with that, we show here how we actually do the plotting internally in this function:
    color_idx = fourcolorsindex(D; groupby=groupby, ncolors=ncolors)
    C = makecpt(T=(1, ncolors), C=colors)
plot(D; level=color_idx, cmap=C, plot=(data=D,), show=show, kw...)# Color countries with 4 colors (sufficient for any map)
polys = getdcw("AT,DE,FR,IT,ES,PT,CH,BE,NL,PL,CZ");
fourcolors(polys, groupby="CODE")D = getdcw("Africa", file=:ODS) # Use the small ODS.nc file
fourcolors(D, groupby="CODE")
# Color continents with 7 distinct colors
D = getdcw("WD", file=:ODS)     # All countries
fourcolors(D, groupby="CONTINENT", colors=["red","orange","yellow","green","blue","purple","brown"],
           proj=:guess, region=:global)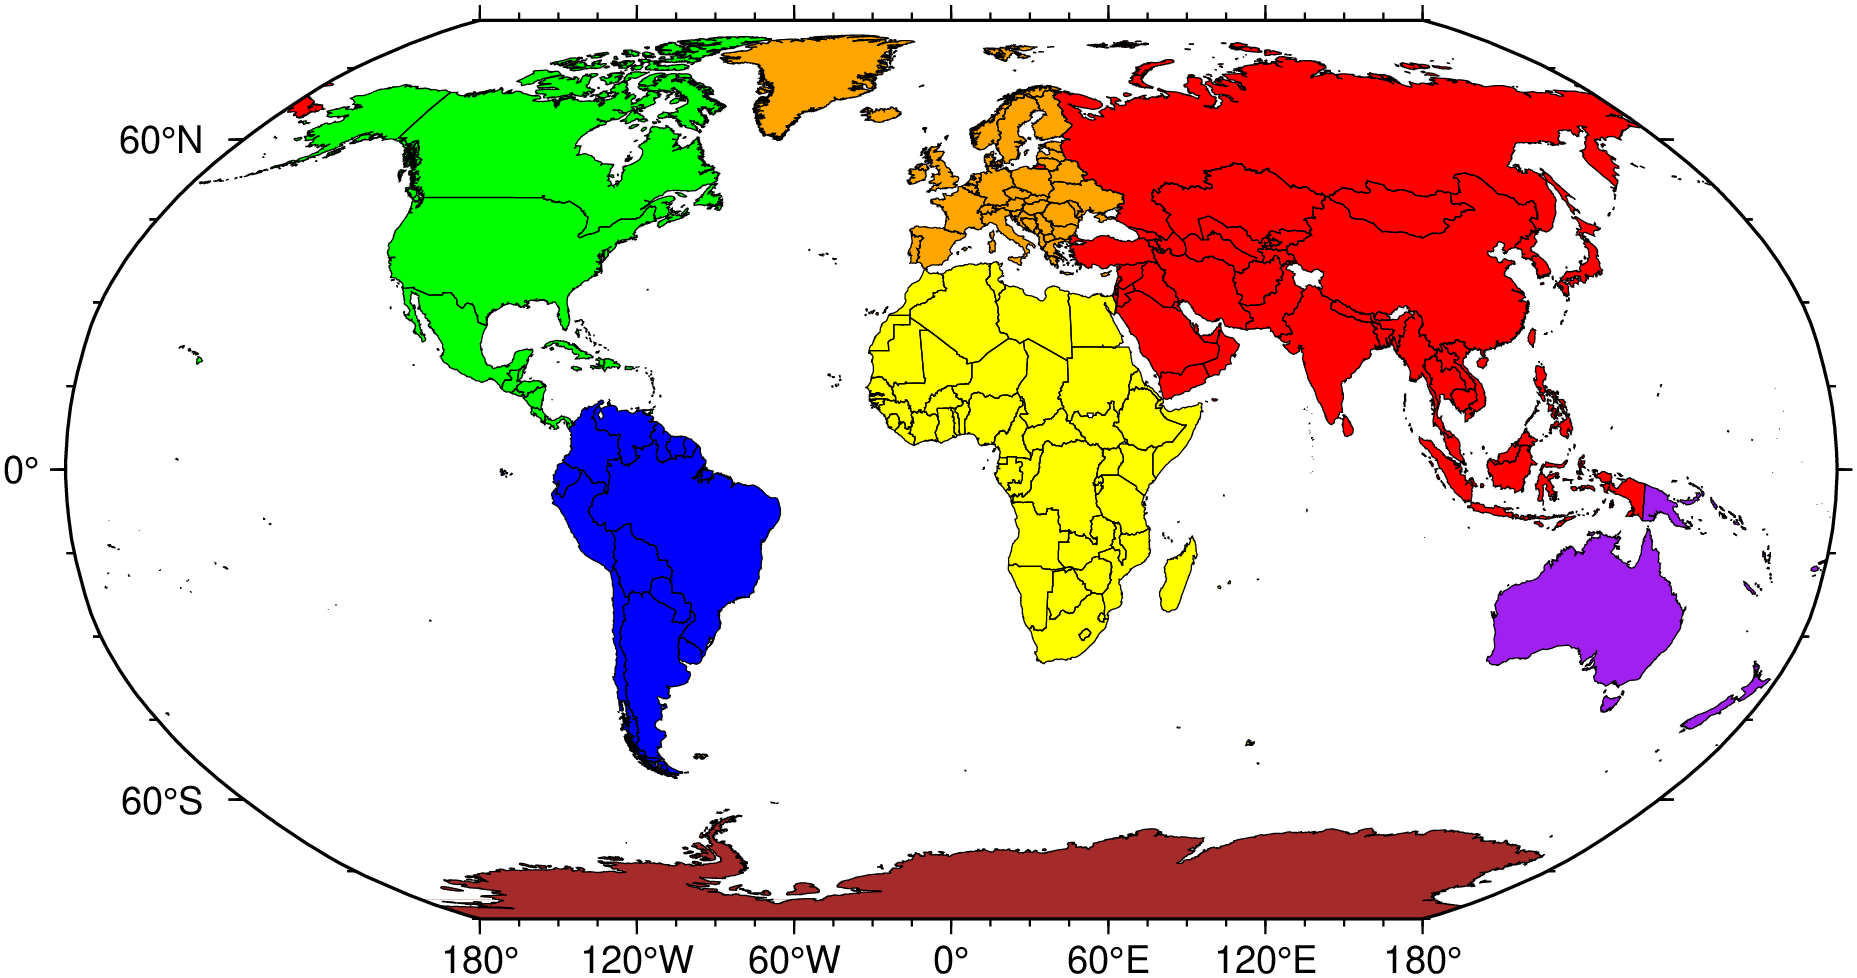
View the source code for this function.