enso()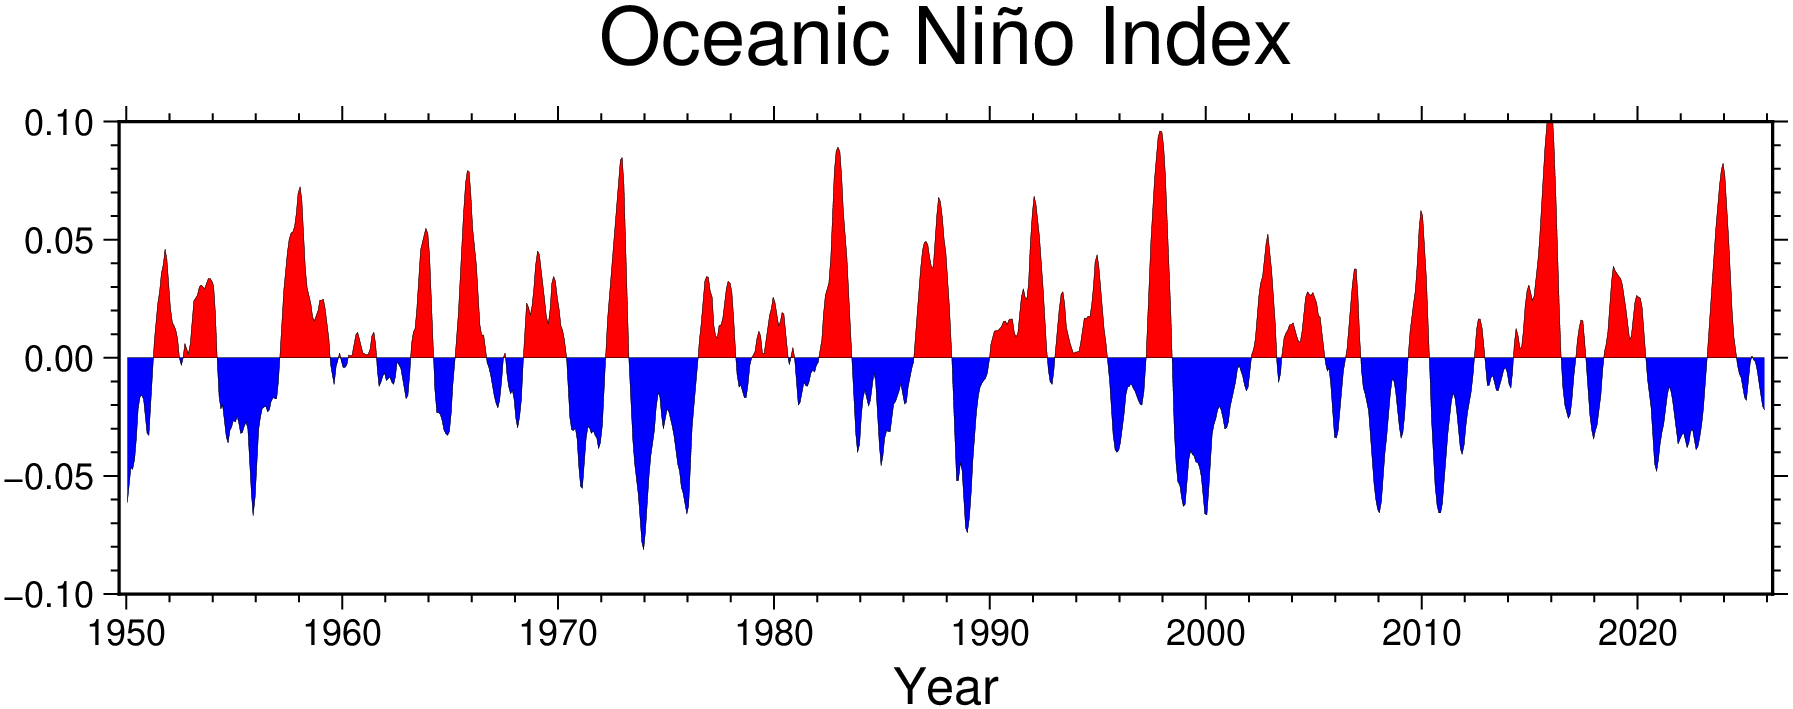
enso(; data::Bool=false, data0::Bool=false, kwargs...)Retrieve ENSO (El Niño-Southern Oscillation) data.
Data is fetched from NOAA (https://www.cpc.ncep.noaa.gov/data/indices/oni.ascii.txt). If plotted, El Niño events (positive) shown in red, La Niña (negative) in blue. A plot is generated by default unless data or data0 is set to true, case in which the index data is returned and no figure is generated.
Arguments - data::Bool=false: If true, return the computed ENSO data as a [date index] pair in a GMTdataset.
data0::Bool=false: If true, similar to above, but return a 3 column matrix with second column all equal to zero. This is useful for plotting purposes when using the wiggle function.
kwargs...: Additional keyword arguments passed to underlying plotting function.
Note, the plot is created with a figure size of (14,4), with x-axis labeled “Year” and title “Oceanic Niño Index”, but this can be overwritten via the xlabel and title options. The option data0 returns a dataset with a zero middle column useful for plotting with wiggle. The default plotting command is:
wiggle(D, track=:faint, ampscale=1.25, figsize=(14,4), R=:tightx, fill=["red+p", "blue+n"], pen=0,
           xlabel="Year", title="Oceanic Niño Index", show=true; kwargs...)
where D is the dataset returned when data0=true. You can use this to customize a new plot further.
And, it seems that the NOOA site sometimes is quite slow to respond, so be patient!
ENSO data indices in a GMTdataset or nothing depending on the data and data0 flags.
Example
enso()
View the source code for this function.