annotate

annotate(points, labels; kwargs...)
annotate!(points, labels; kwargs...)

Place text annotations connected to data points by arrows or leader lines, with automatic non-overlapping label placement.

Description

annotate is a high-level convenience function inspired by Matplotlib’s annotate. It handles the full labeling pipeline in a single call:

  1. Computes non-overlapping label positions automatically via textrepel (unless positions are supplied explicitly).
  2. Places the labels with text using GMT’s per-record offset mechanism (-D+f).
  3. Draws connecting lines from each anchor point to its label, either as arrows (default) or as thin GMT leader lines.

Required Arguments

  • points : Nx2 Matrix or GMTdataset with (x, y) coordinates of the anchor points.
  • labels : Vector{String} with one annotation per point.

Optional Arguments

  • text_pos : Nx2 matrix or GMTdataset with explicit label positions in data coordinates. When provided the labels are placed here and connecting lines go from points to text_pos. When omitted (together with offsets) positions are computed automatically by textrepel.

  • offsets : Nx2 matrix of per-label displacements in cm from each anchor point. Passed to text via GMT’s -D+f per-record offset mechanism. Omit to let textrepel compute them automatically.

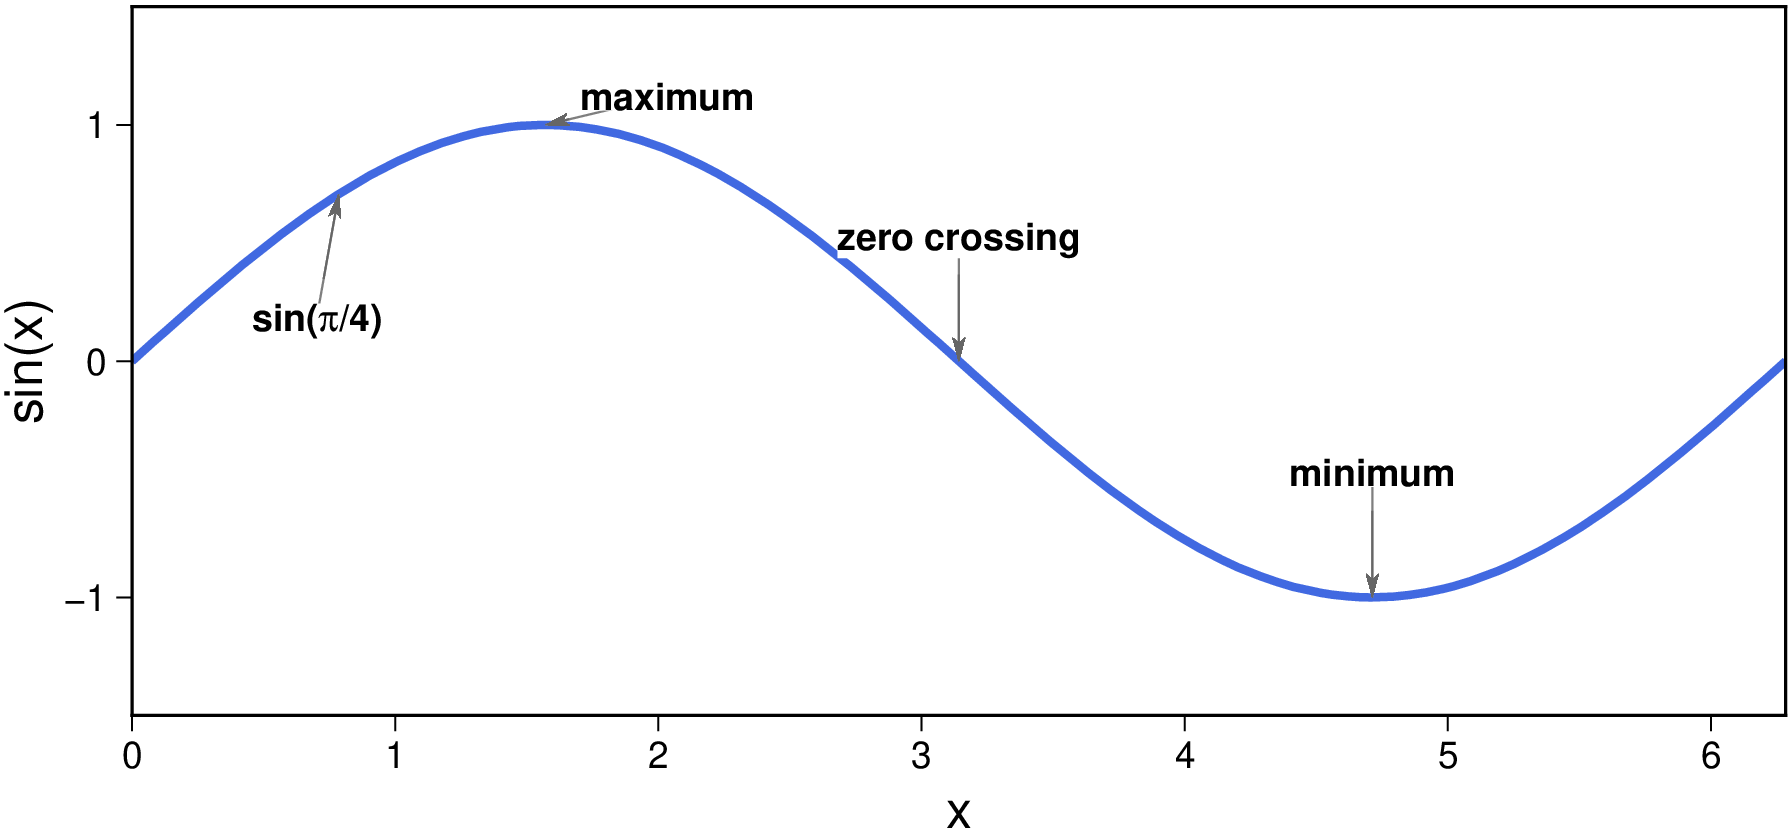
  • arrowprops : Controls the connecting arrow drawn between each anchor and its label.

    • false (default) — no arrow.
    • true — draws a default filled arrow pointing to the data point (pen=1, arrow=(len=0.6,stop=true), fill=:black).
    • A NamedTuple with any kwargs accepted by arrows!() — custom arrow styling. E.g. arrowprops=(pen="0.5p,gray", arrow=(len=0.3, stop=true, shape=0.5), fill=:gray).
  • leader : Pen string for a thin GMT leader line (-D+f+v<pen>) drawn from the anchor point to the edge of the text box (no arrowhead). E.g. leader="0.5p,gray50".

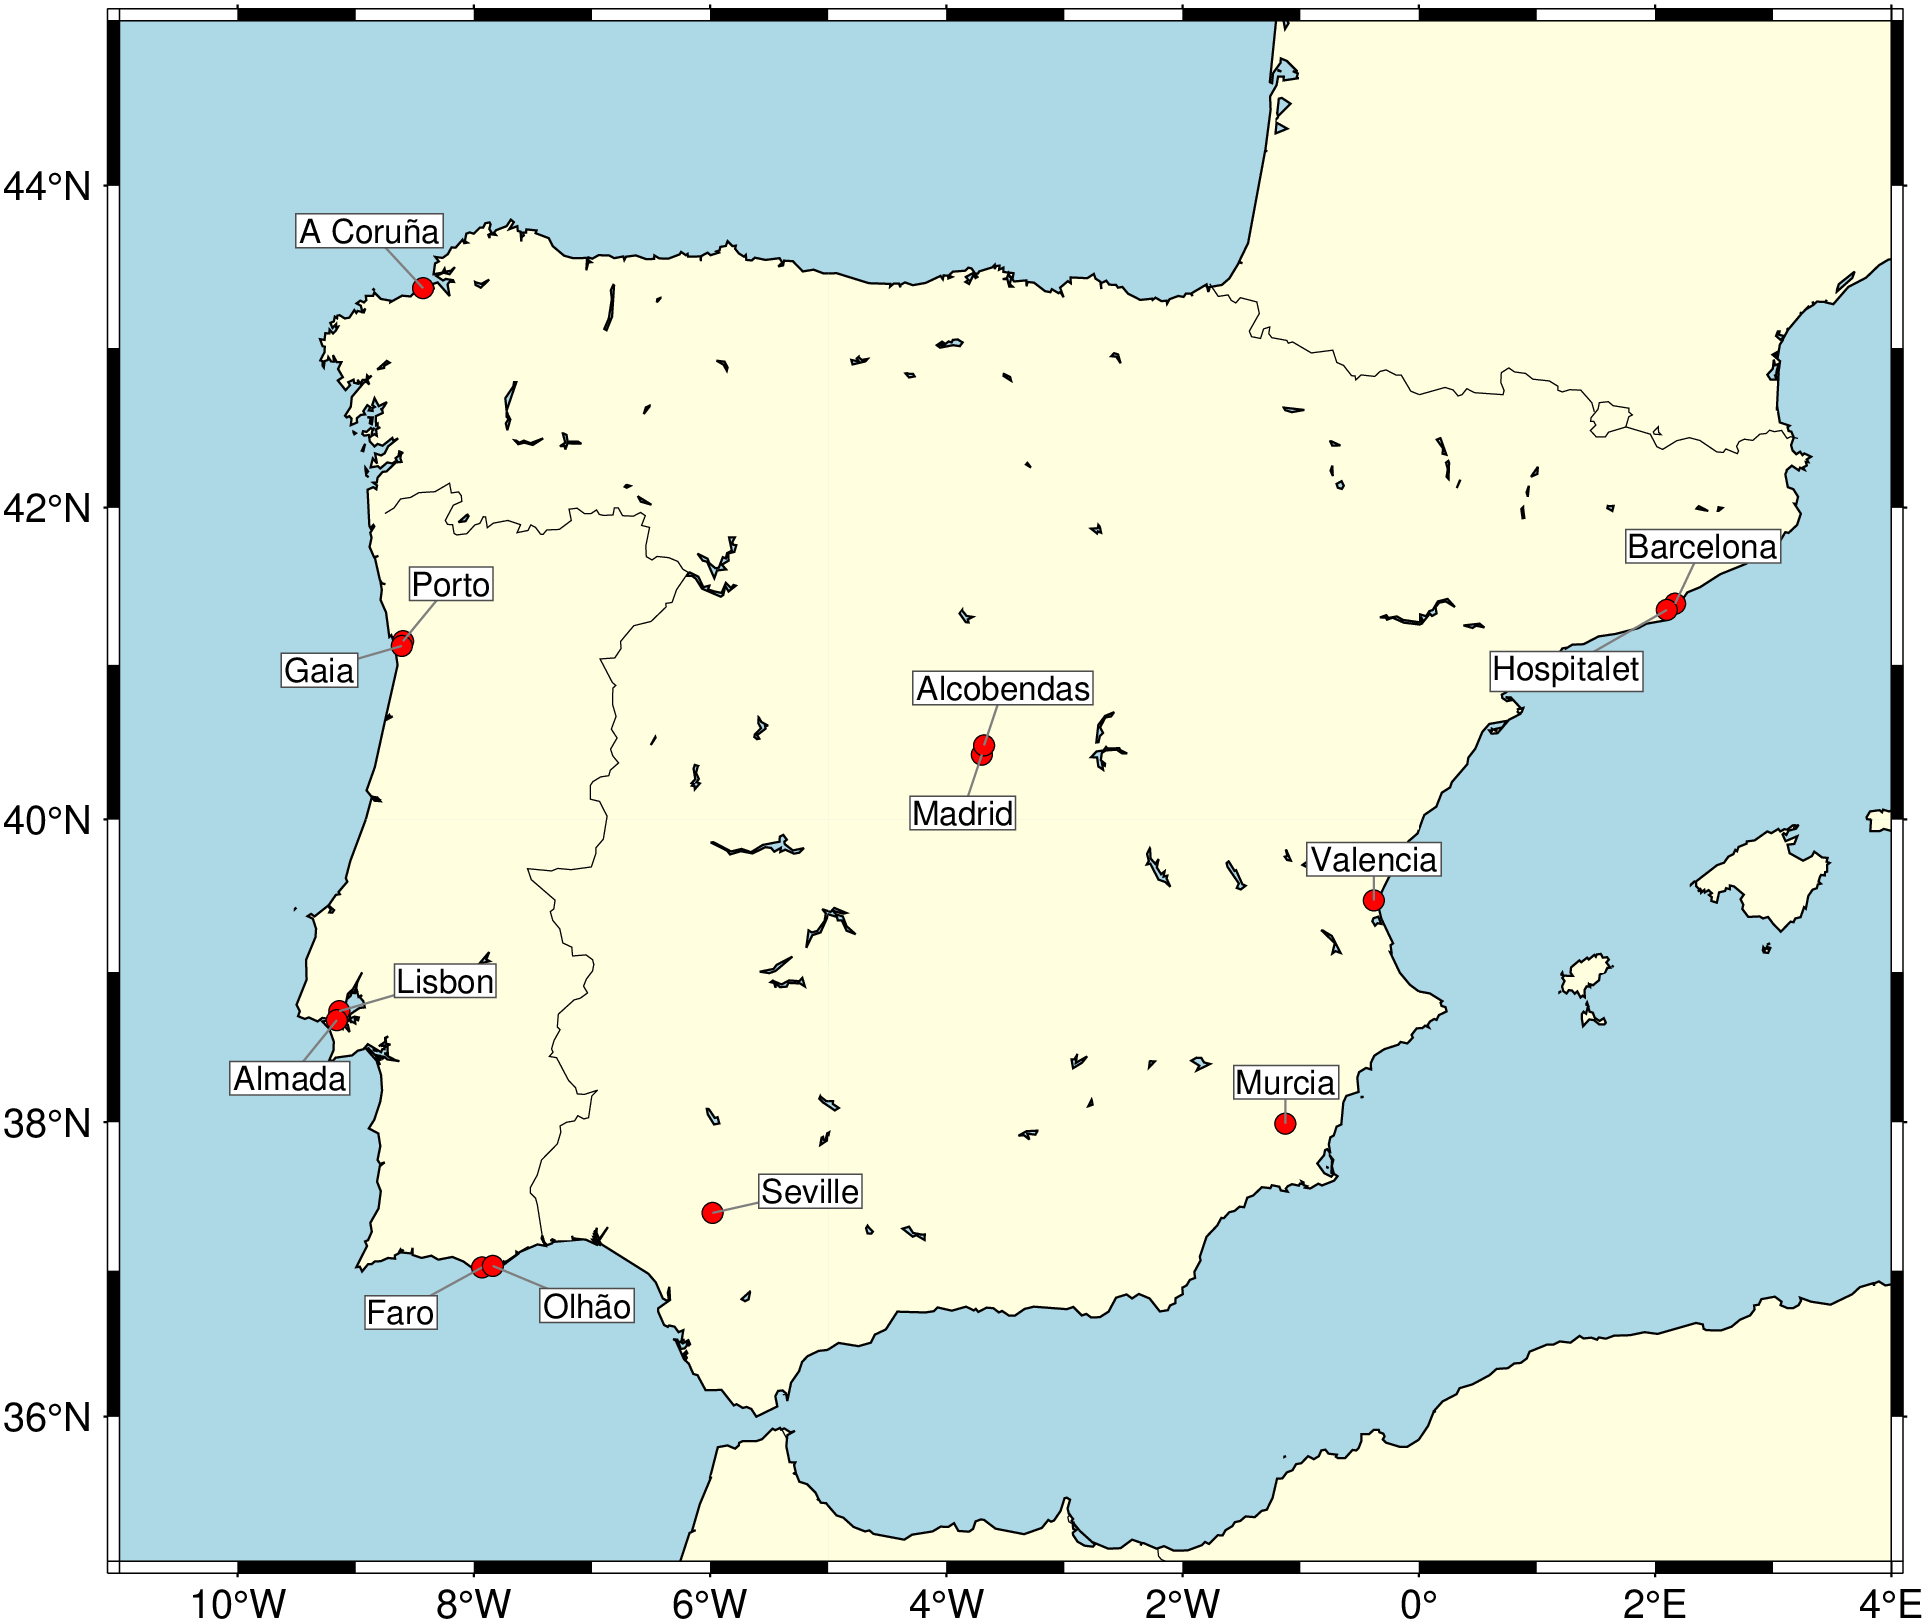
  • nobox : If true, render the label with fill only — no box border is drawn and clearance is forced to "0p" so the fill hugs the text. Useful for clean map labels with a coloured background but no visible rectangle.

  • nofill : If true, render the label as plain text with no box and no background fill.

  • justify : GMT justification code for the text anchor (default "CM", centre-middle).

  • fontsize : Font size in points used by textrepel for bounding-box estimation (default 10). Use F=(font=...) to control the rendered font.

  • force_push, force_pull, max_iter, pad, min_offset : textrepel tuning parameters (used only when neither text_pos nor offsets is given).

  • Remaining kwargs are forwarded to text() and control label appearance — e.g. fill, pen, clearance, F=(font=...), font, etc.

  • U or time_stamp : – time_stamp=true | time_stamp=(just=“code”, pos=(dx,dy), label=“label”, com=true)
    Draw GMT time stamp logo on plot. More at timestamp

  • V or verbose : – verbose=true | verbose=level
    Select verbosity level. More at verbose

  • figname or savefig or name : – figname=name.png
    Save the figure with the figname=name.ext where ext chooses the figure image format.

Examples

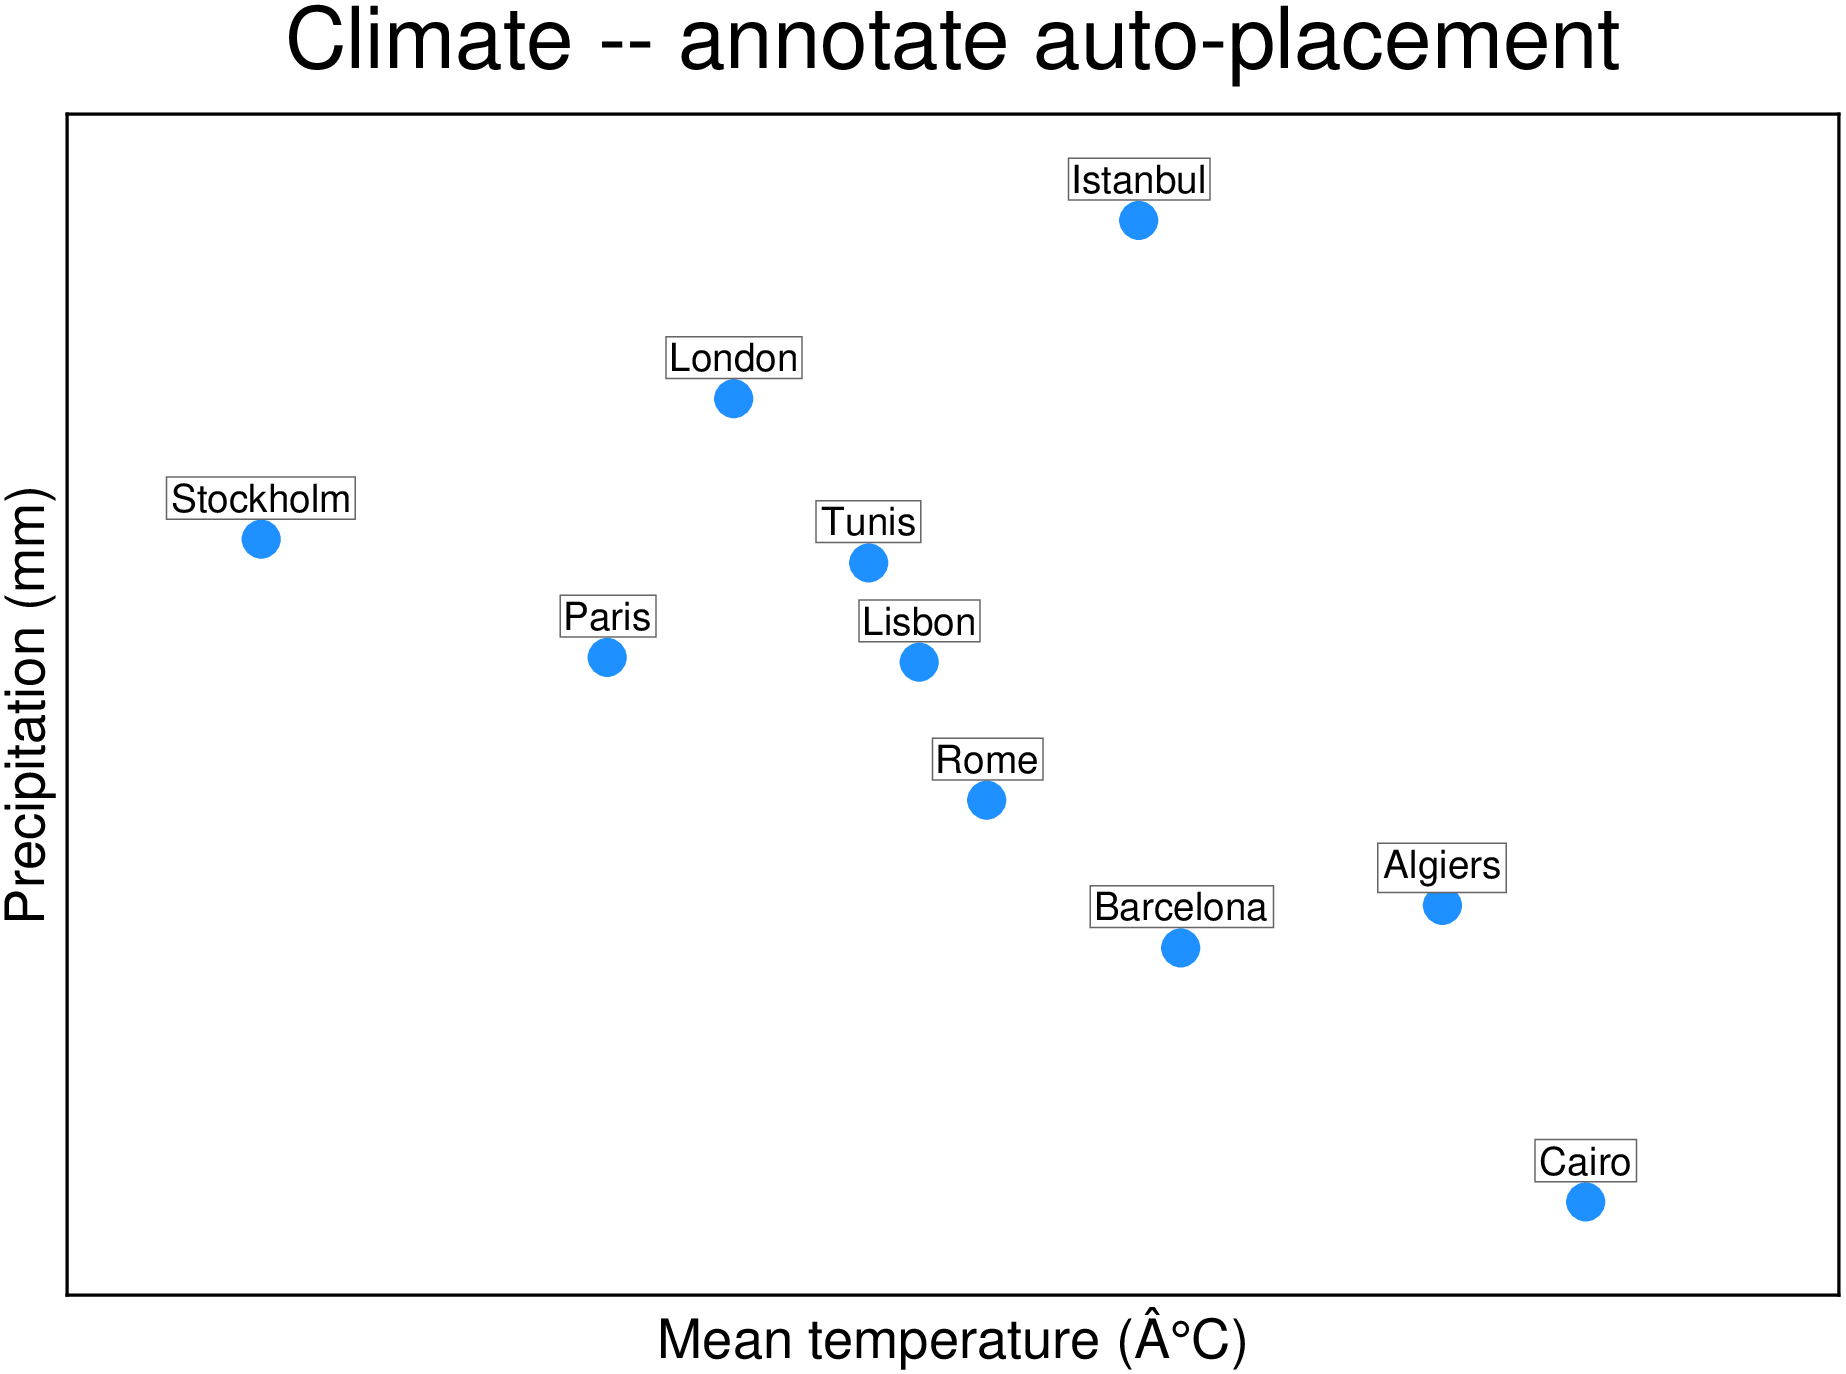
Automatic non-overlapping scatter labels

The simplest usage: pass points and labels, and annotate places everything automatically. Label positions are computed by textrepel to avoid overlaps; arrows connect labels to anchors.

using GMT

# Climate data for selected cities: mean temperature vs. annual precipitation
temp  = [17.2, 14.1, 10.4, 11.9, 22.0, 16.7,  6.3, 14.9, 13.5, 20.3]
prec  = [394,  636,  640,  859,  179, 1010,  740,  519,  720,  430]
names = ["Barcelona", "Lisbon", "Paris", "London", "Cairo",
         "Istanbul",  "Stockholm", "Rome", "Tunis", "Algiers"]
pts   = hcat(temp, Float64.(prec))

scatter(pts, region=(4, 25, 100, 1100),
        frame=(xlabel="Mean temperature (°C)", ylabel="Precipitation (mm)",
               title="Climate -- annotate auto-placement"),
        marker=:circle, ms="10p", fill=:dodgerblue, ml="0.5p,white")
annotate!(pts, names; fontsize=8, fill=:white, pen="0.3p,gray40", clearance="1.5p", show=true)
Precompiling packages...


  50556.8 msGMT

  1 dependency successfully precompiled in 52 seconds. 80 already precompiled.

Annotating a European city map

annotate works equally well on geographic maps. The automatic layout keeps city labels legible even when several capitals are close together.

pts = [-9.14 38.74; -3.70 40.42; -0.13 51.51;  2.35 48.85;
        4.90 52.37; 13.41 52.52; 12.50 41.90; 16.37 48.21;
       19.04 47.50; 23.73 37.98]
cities = ["Lisbon", "Madrid", "London", "Paris",
          "Amsterdam", "Berlin", "Rome", "Vienna",
          "Budapest", "Athens"]

coast(region=(-12, 28, 34, 57), proj=:Mercator, land=:wheat, water="lightblue",
      borders=(1,:gray50), shore=:thinnest, frame=:a10g10)
scatter!(pts, marker=:star, ms="8p", fill=:red, ml="0.5p,darkred")
annotate!(pts, cities; fontsize=7, fill=:white, pen="0.3p,gray30", clearance="1p", show=true)

And another with very close cities

cities = [
    -9.14  38.74;   # Lisbon
    -9.16  38.68;   # Almada
    -8.60  41.15;   # Porto
    -8.61  41.12;   # Gaia
    -7.93  37.02;   # Faro
    -7.84  37.03;   # Olhão
    -3.70  40.42;   # Madrid
    -3.68  40.48;   # nearby Madrid (Alcobendas)
    -0.38  39.47;   # Valencia
     2.17  41.39;   # Barcelona
     2.10  41.35;   # nearby Barcelona (Hospitalet)
    -8.43  43.37;   # A Coruña
    -5.98  37.39;   # Seville
    -1.13  37.99;   # Murcia
]

names = ["Lisbon", "Almada", "Porto", "Gaia", "Faro", "Olhão", "Madrid", "Alcobendas",
         "Valencia", "Barcelona", "Hospitalet", "A Coruña", "Seville", "Murcia"]

    # Plot the coast as background
coast(region=[-11, 4, 35, 45], proj=:Mercator, shore=true,
      land=:lightyellow, water=:lightblue, borders=(1,:thinnest))

# Plot city points
scatter!(cities, marker=:circle, ms="5p", fill=:red, ml=:thinnest)
annotate!(cities, names; leader="0.5p,gray50", font=(8,:Helvetica,:black),
          fill=:white, pen="0.3p,gray30", clearance="1p", show=true)

Vector lines

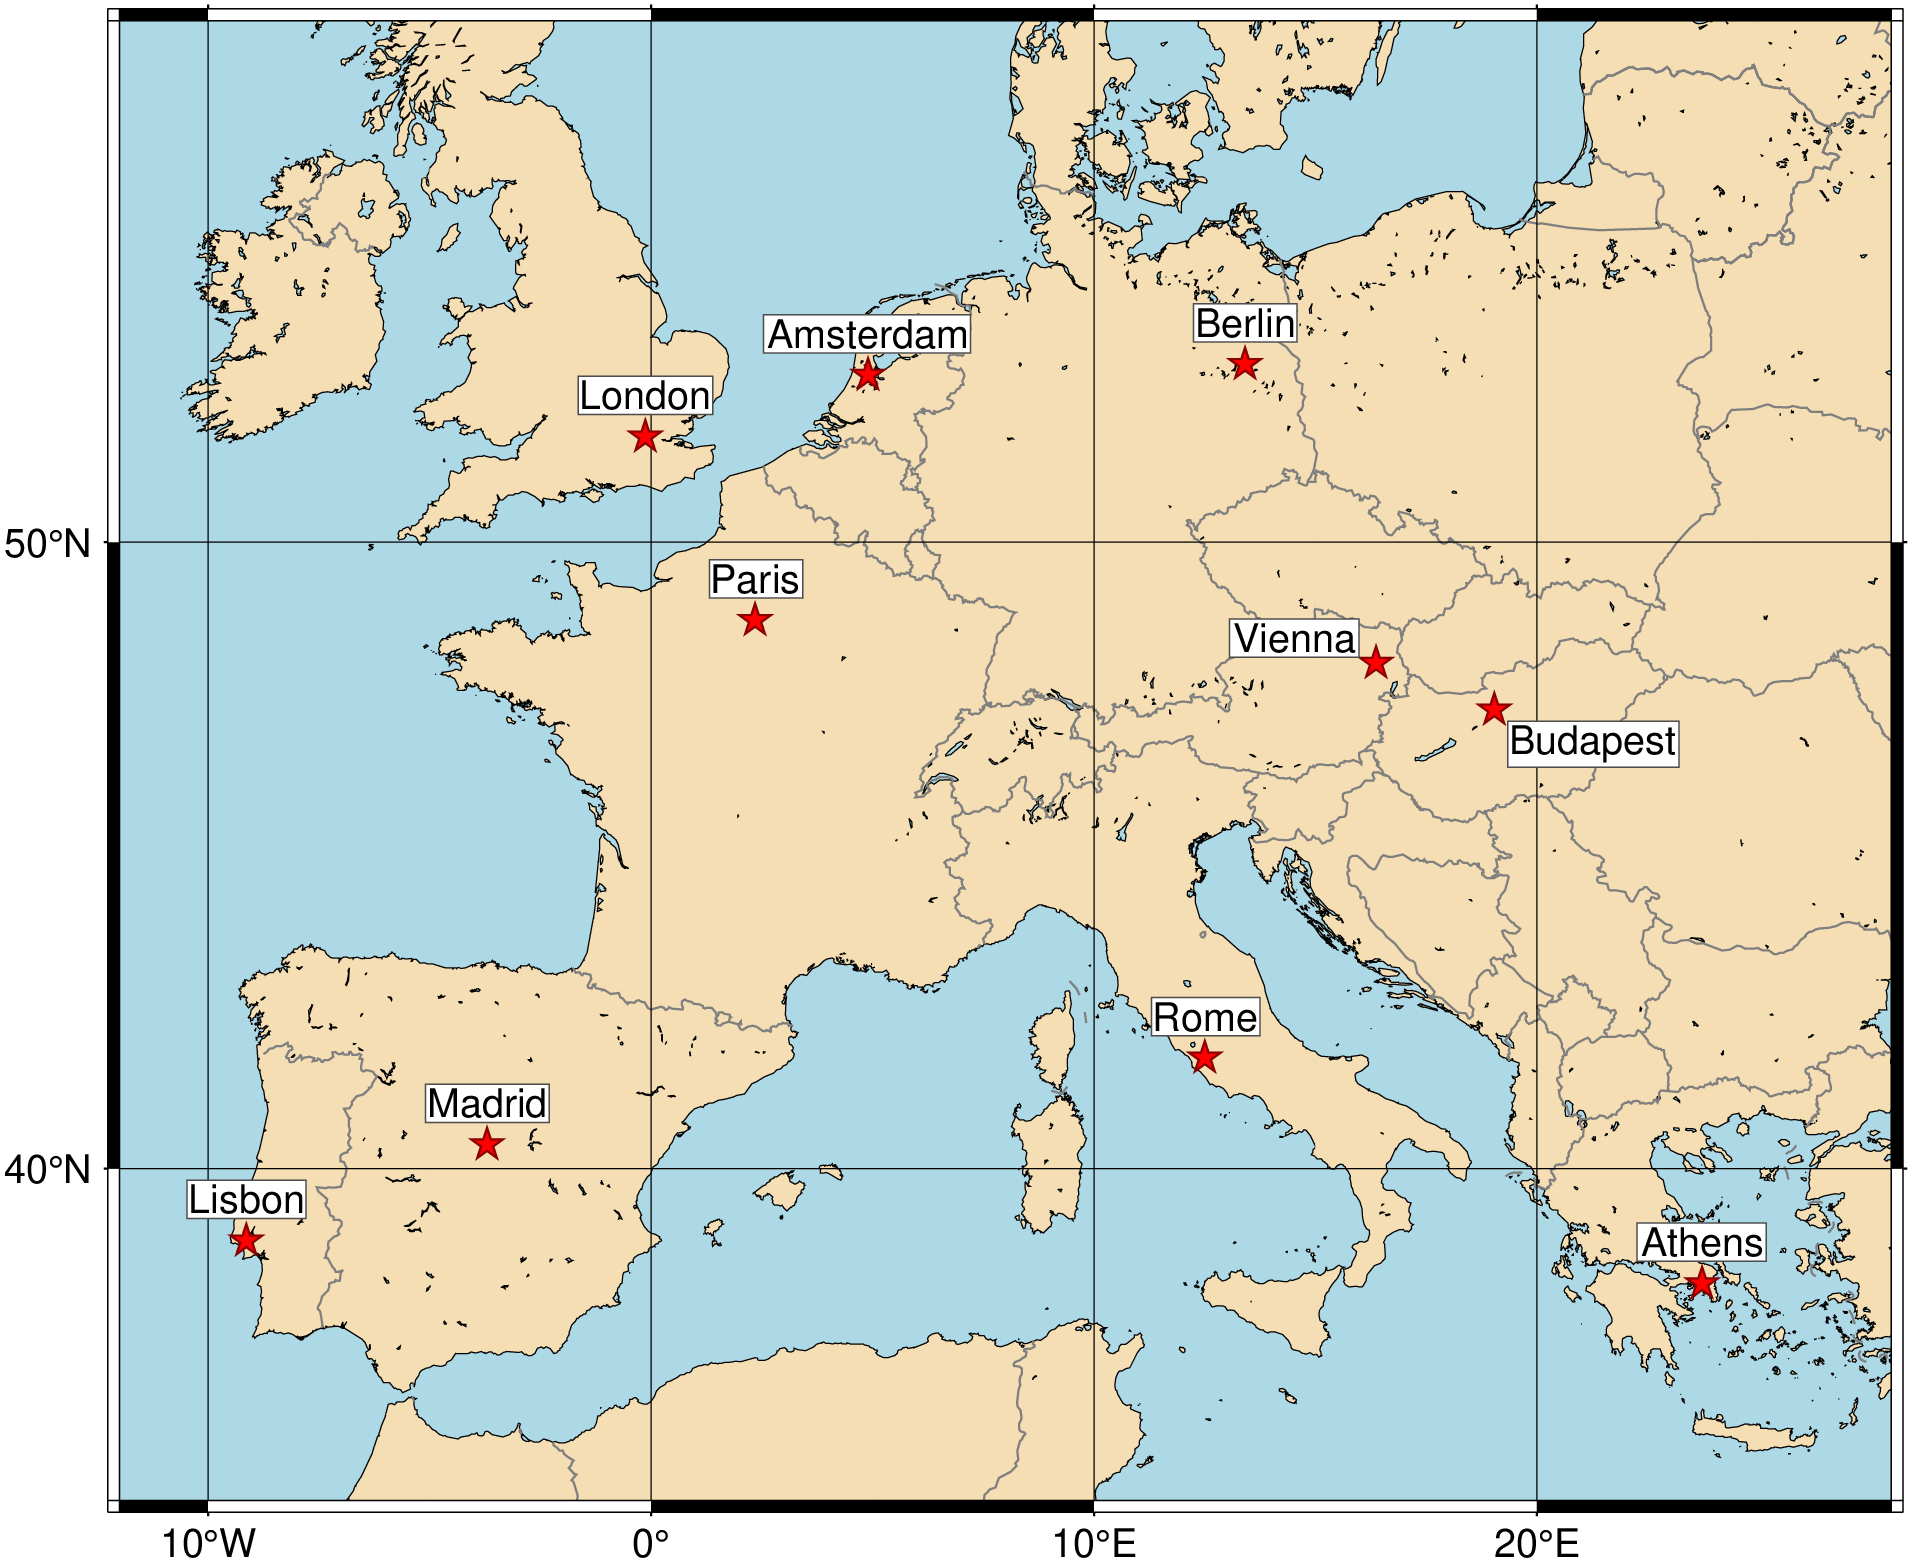
Pass leader=<pen> to use GMT’s hairline connector — a thin line from the anchor to the edge of the text box, with no arrowhead. Since no arrow is drawn by default, just setting leader is sufficient.

x = collect(LinRange(0.0, 2π, 300))
plot(hcat(x, sin.(x)), region=(0, 2π, -1.5, 1.5), figsize=(14, 6), frame=:af,
     pen="2p,royalblue", xaxis=(annot=:auto, label="x"), yaxis=(annot=:auto, label="sin(x)"))

pts  = [π/2  1.0;  π    0.0; 3π/2 -1.0; π/4  0.707]
    labs = ["maximum", "zero crossing", "minimum", "sin($(greek('p'))/4)"]

annotate!(pts, labs; leader="0.5p,gray50", min_offset=30, nobox=true,
          arrowprops=(pen="0.4p,gray40", arrow=(len=0.2, stop=true, shape=0.5), fill=:gray40),
            F=(font=(9, "Helvetica-Bold"),), show=true)

Source Code

View the source code for this function.

See Also

text, textrepel, arrows, plot