using GMT
violin(randn(100,8), fill=true, show=true)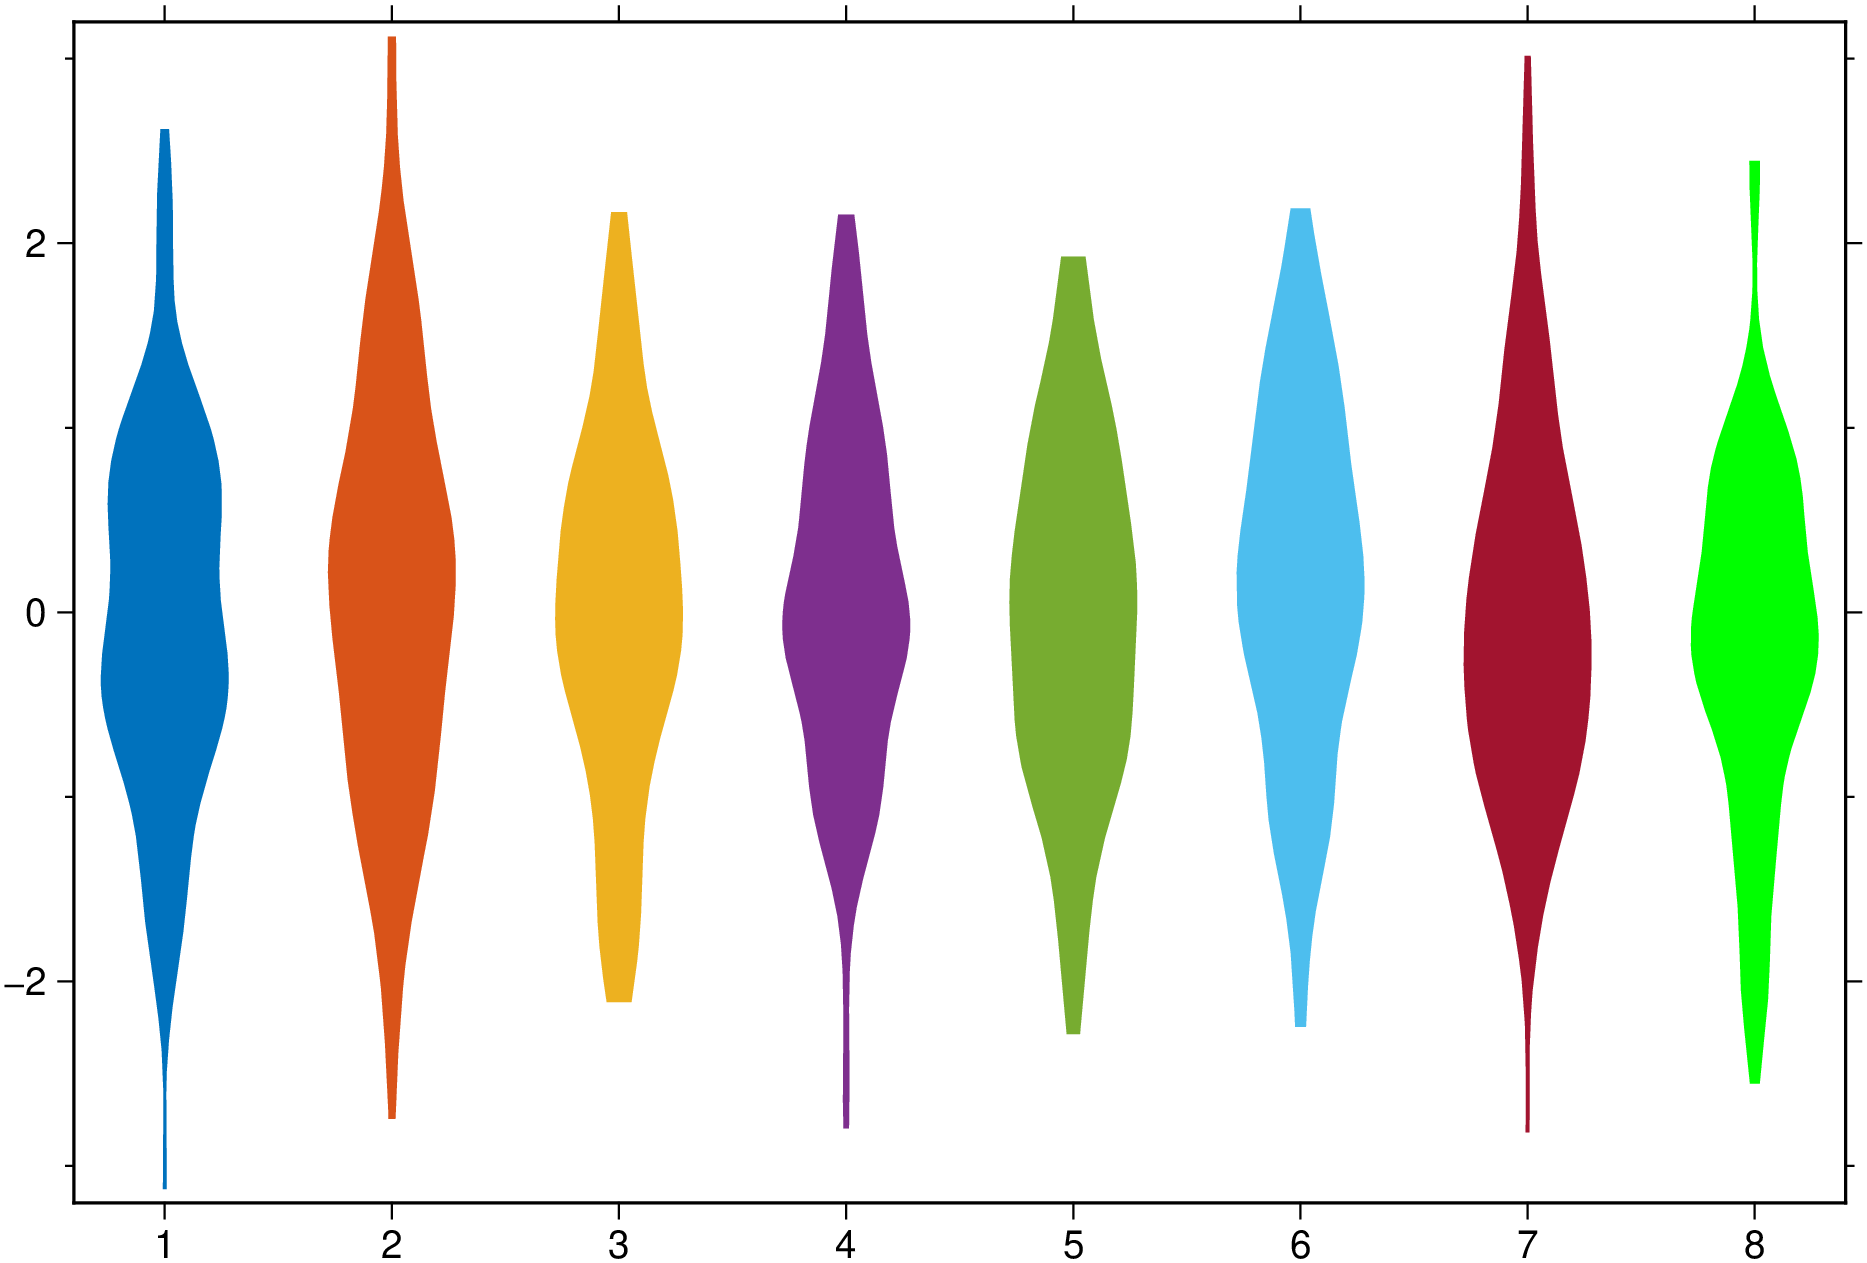
violin(data, grp=[]; pos=nothing, kwargs...)Draw a violin plot that is similar to a box plot, with the addition of a kernel density plot on each side. The input data can take several different forms.
violin(data::AbstractVector{<:Real}; kwargs…)
Draws a single violin. Options in kwargs provide fine settings for the violin
boxplot: Logical value indicating whether to add boxplots on top of the violins. When the violins are color painted, adding boxplots adds them in light gray.boxwidth or cap: Sets the the boxplot width and, optionally, the cap width. Provide info as boxwidth="10p/3p" to set the boxwidth different from the cap’s. Note, however, that this requires GMT6.5. Previous versions do not destinguish box and cap widths.fill: If fill=true paint the box with the first color of a pre-defined color scheme. Otherwise, give a color to paint the box.horizontal or hbar: Logical value indicating whether to plot horizontal instead of vertical boxplots.notch: Logical value indicating whether the box should have a notch (needs GMT6.5).nbins: points are queried between MIN(Y[:]) and MAX(Y[:]) where Y is the vector data.bins: Calculates the density for the query points specified by BINS. The values are used as the query points directly. Default is 100 points.bandwidth: uses the ‘bandwidth’ to calculate the kernel density. It must be a scalar. BINS may be an empty array in order to use the default described above.kernel: Uses the kernel function specified by KERNEL to calculate the density. The kernel may be: ‘Normal’ (default) or ‘Uniform’outliers: If other than a NamedTuple, plots outliers (1.5IQR) with the default black 5pt stars. If argument is a NamedTuple (marker=??, size=??, color=??, markeredge=??), where marker is one of the plots marker symbols, plots the outliers with those specifications. Any missing spec default to the above values. i.e outliers=(size="3p") plots black 3 pt stars.scatter: Logical value indicating whether to add a scatter plot on top of the violins (and boxplots) If arg is a NamedTuple, take it to mean the same thing as described above for the outliers.weights: Array giving the weights for the data in data. The array must be the same size as data.region or limits: By default we estimate the plotting limits but sometimes that may not be convenient. Give a region=(x_min,x_max,y_min,y_max) tuple if you want to control the plotting limits.ticks or xticks or yticks: A tuple with annotation location and label. E.g. xticks=([2], [“Ab”]) where first element is an AbstractArray and second an array or tuple of strings or symbols.violin(data::AbstractVector{<:Real}, grp::AbstractVector, …) Use the categorical vector (made of integers or text strings) grp break down a the data column vector in cathegories (groups).
violin(data::AbstractMatrix{<:Real}; pos=Vector{<:Real}, …) where pos is a coordinate vector (or a single location when data is a vector) where to plot the boxes. Default plots them at 1:n_boxes or 1:n_groups.
violin(data::GMTdatset{<:Real}; pos=Vector{Real}(), …) Like the above case but the input data is stored in a GMTdataset
violin(data::Vector{Vector{<:Real}}; pos=Vector{Real}(), …) Similar to the Matrix case but here each data vector used to compute the statistics can have a different number of points. There will be as many boxplots as length(data)
violin(data::Array{T<:Real,3}; pos=Vector{Real}(), groupwidth=0.75, ccolor=false, …) Draws G groups of violins of N columns boxes. - groupWidth: Specify the proportion of the x-axis interval across which each x-group of boxes should be spread. The default is 0.75. - ccolor: Logical value indicating whether the groups have constant color (when fill=true is used) or have variable color (the default). - fill: If fill=true paint the boxes with a pre-defined color scheme. Otherwise, give a list of colors to paint the boxes. - fillalpha: When the fill option is used, we can set the transparency of filled violins with this option that takes in an array (vec or 1-row matrix) with numeric values between [0-1] or ]1-100], where 100 (or 1) means full transparency. - pos: a coordinate vector where to plot the boxes. Default plots them at 1:n_boxes or 1:n_groups. - split: If true, the groups that have two elements will be plotted with the left-side of one and the right side of the other. For groups that have other number of elements this option is ignored. - ticks or xticks or yticks: A tuple with annotations interval and labels. E.g. xticks=(1:5, [“a”, “b”, “c”, “d”]) where first element is an AbstractArray and second an array or tuple of strings or symbols. - separator: If = true plot a black line separating the groups. Otherwise provide the pen settings of those lines.
violin(data::Vector{Vector{Vector{<:Real}}}, …) Like the above but here the groups (length(data)) can have a variable number of elements and each have its own size.
This module is a subset of plot. So not all (fine) controlling parameters are not listed here. For the finest control, user should consult the plot module.
Create a plot with 8 violins colored with the default colors.
using GMT
violin(randn(100,8), fill=true, show=true)
Now add boxplot, scatter and outliers to a plot similar to above. The outliers show as black stars.
using GMT
violin(randn(100,8), fill=true, boxplot=true, scatter=true, outliers=true, show=true)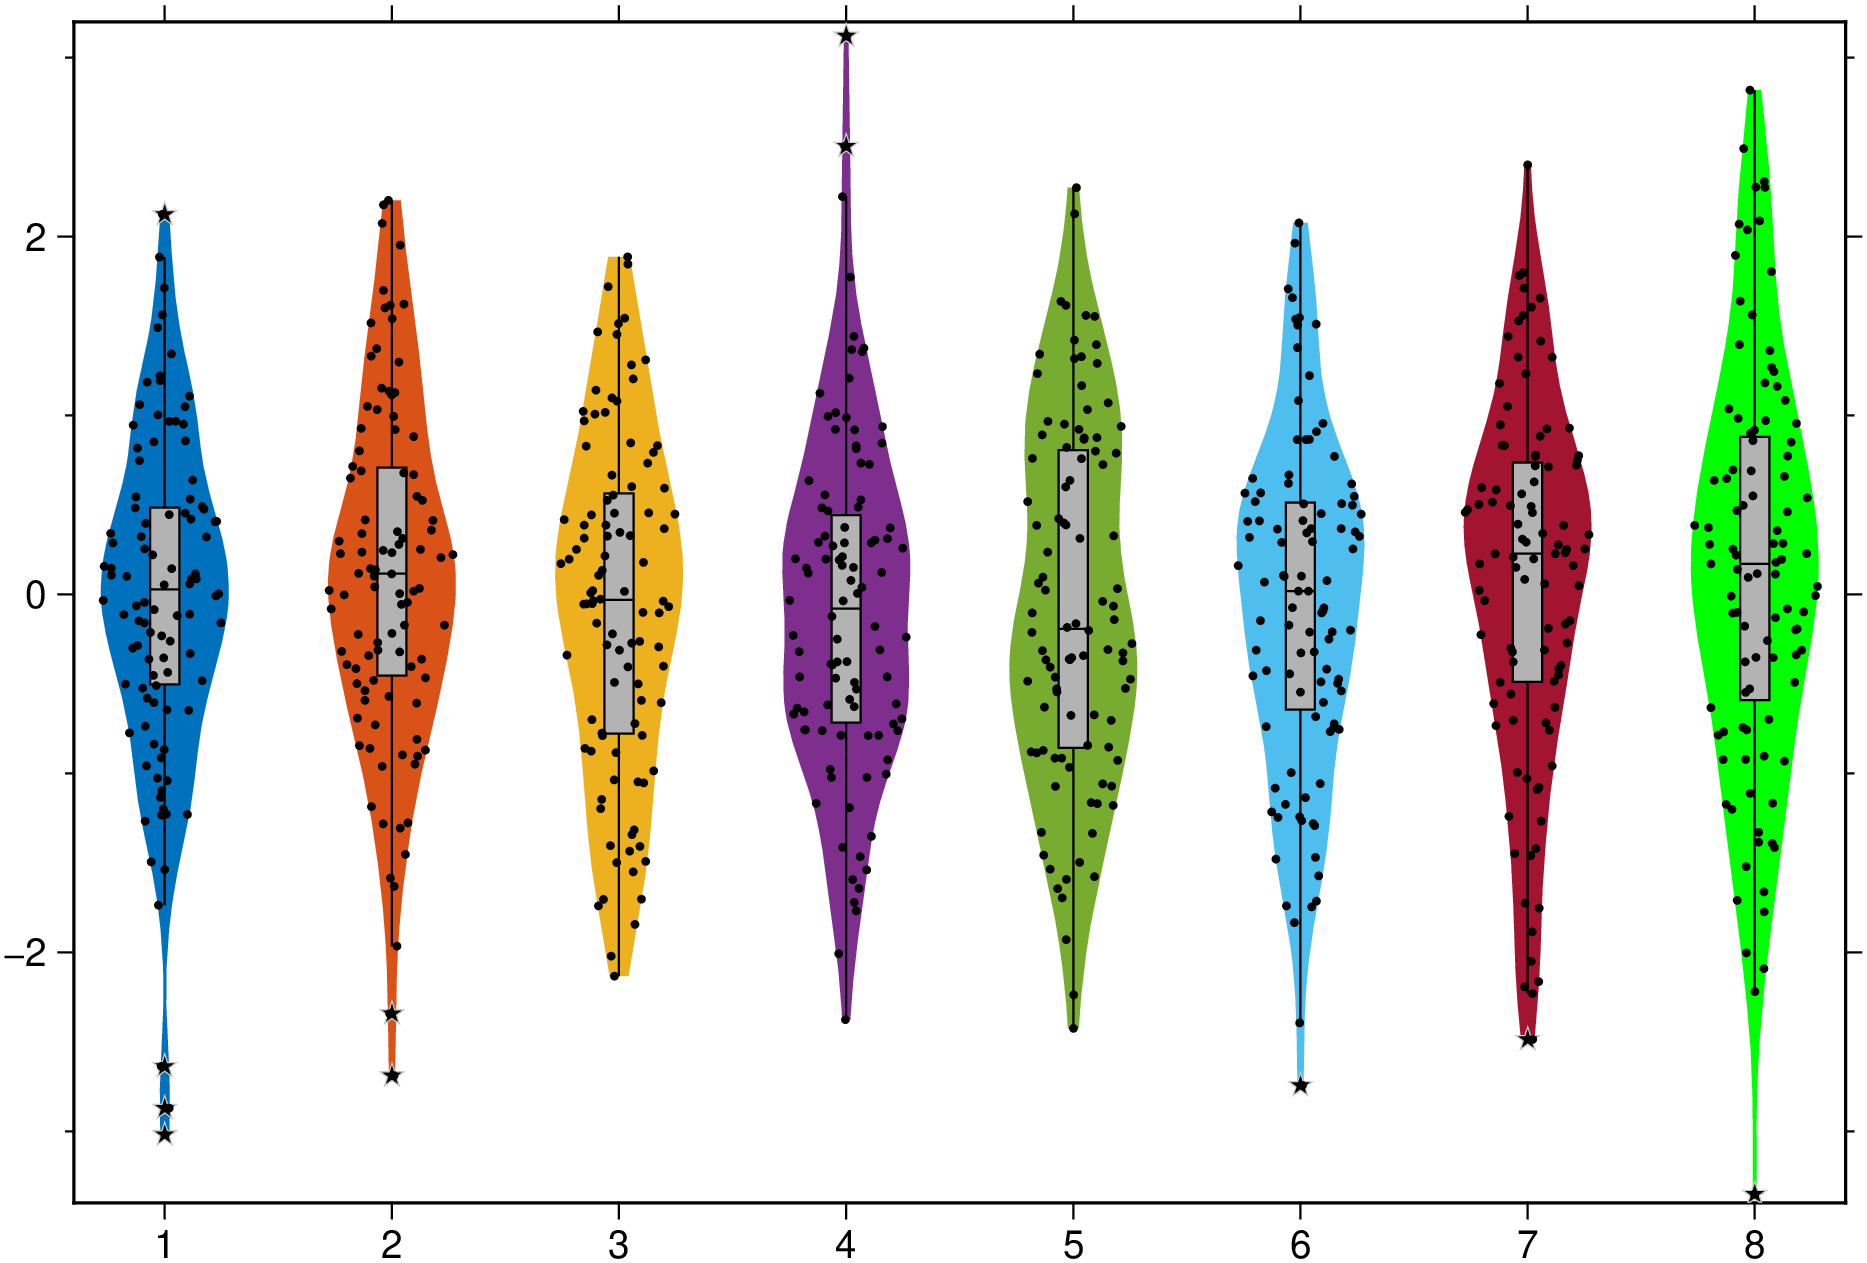
And a group example with red dashed separator lines.
using GMT
vvv = [[randn(50), randn(30)], [randn(40), randn(48), randn(45)], [randn(35), randn(43)]];
violin(vvv, fill=true, boxplot=true, separator=(:red, :dash), scatter=true, outliers=true, show=true)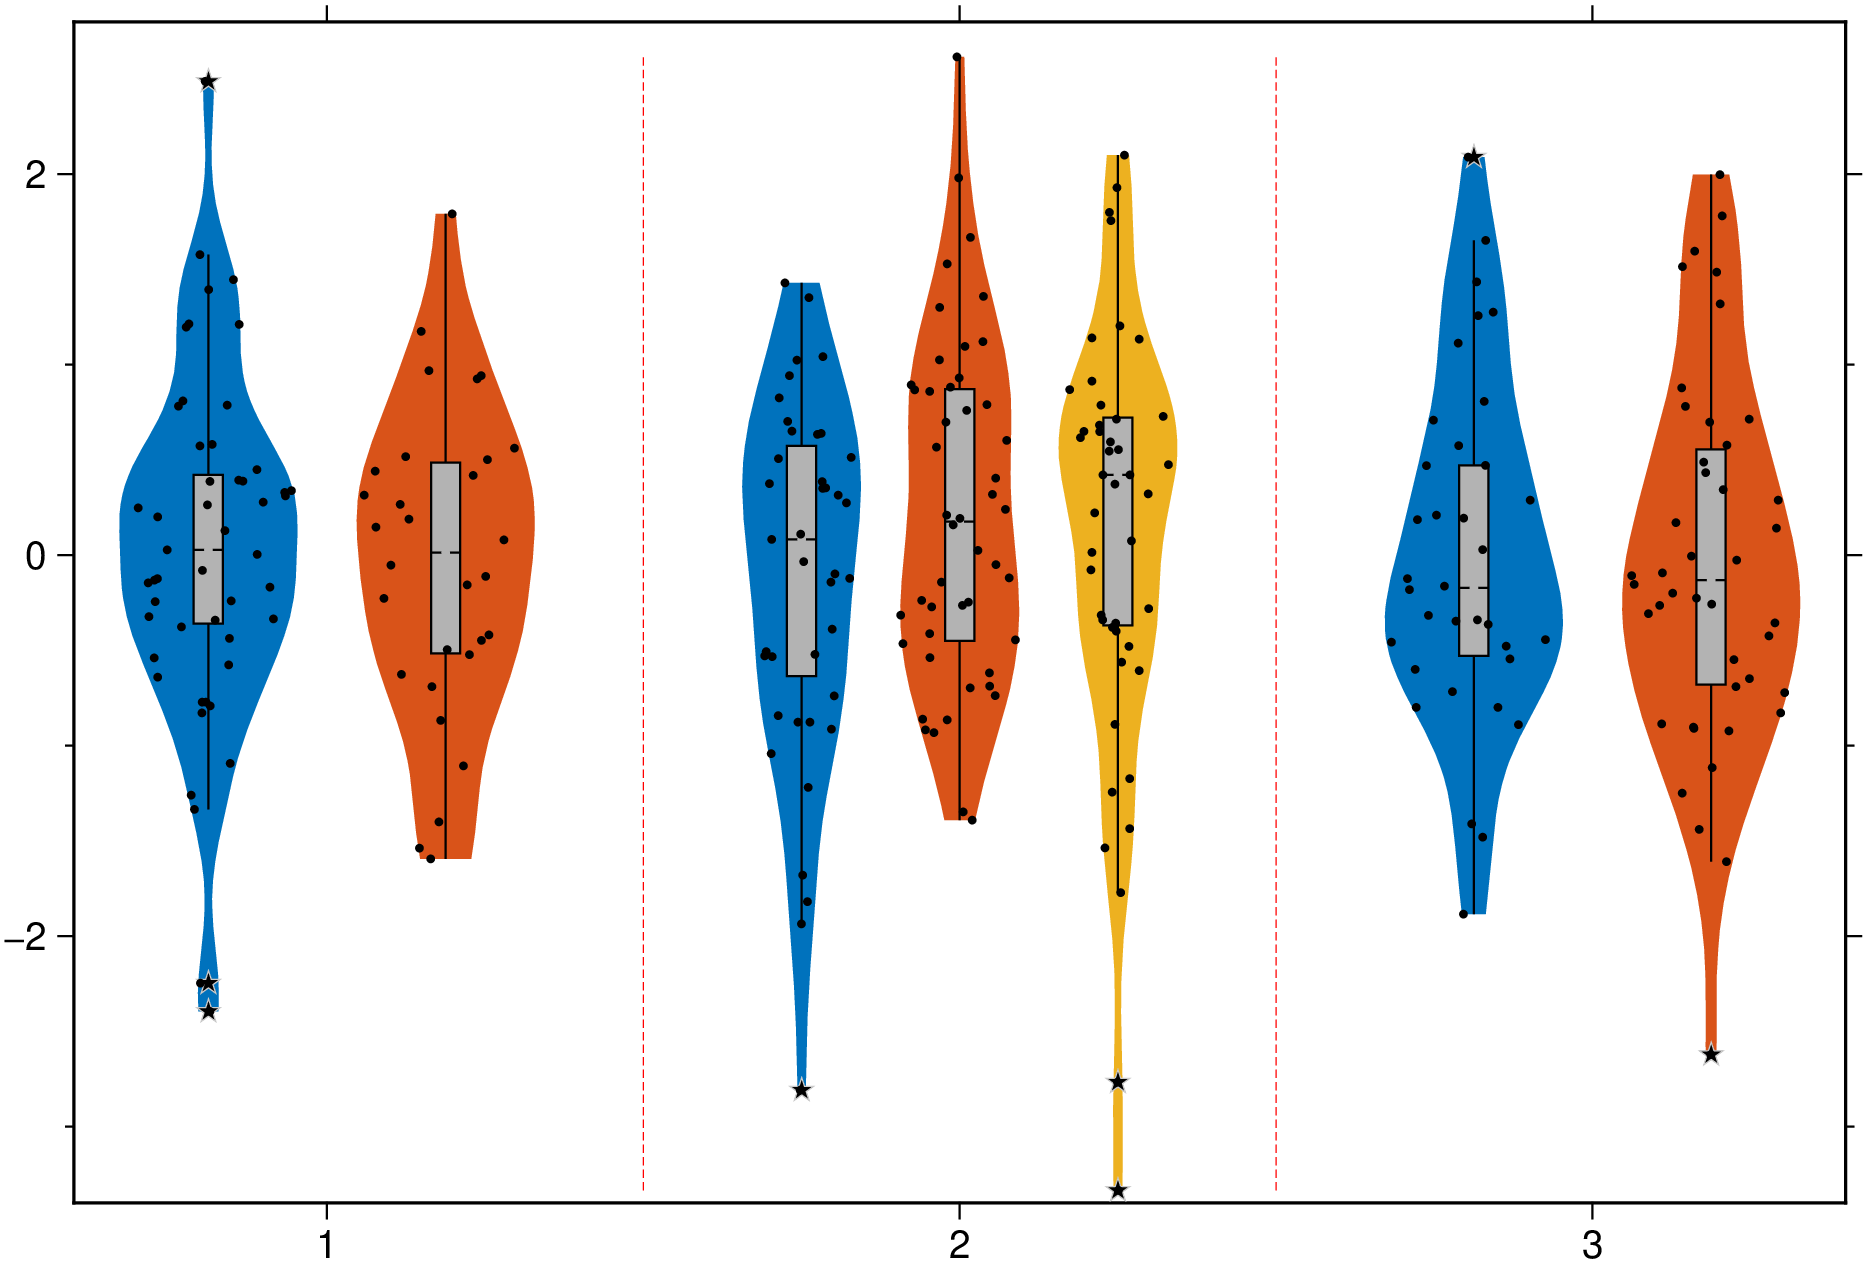
This function has multiple methods:
violin(data::Array{Array{Vector{T}, 1}, 1}; pos, nbins, first, bins, bandwidth, kernel, groupwidth, ccolor, kwargs...) where T - statplots.jl:618violin(data::Array{<:Real, 3}; pos, nbins, first, bins, bandwidth, kernel, groupwidth, ccolor, kwargs...) - statplots.jl:592violin(data::GMTdataset; pos, first, kwargs...) - statplots.jl:565violin(data::Union{AbstractMatrix{T}, Array{Vector{T}, 1}}; first, pos, nbins, bins, bandwidth, groupwidth, kernel, kwargs...) where T - statplots.jl:580violin(data::Vector{<:Real}, grp::AbstractVector; first, pos, nbins, bins, bandwidth, groupwidth, kernel, kwargs...) - statplots.jl:569violin(data::Vector{<:Real}; ...) - statplots.jl:569