using GMT
triplot(rand(5,2), voronoi=true, show=true)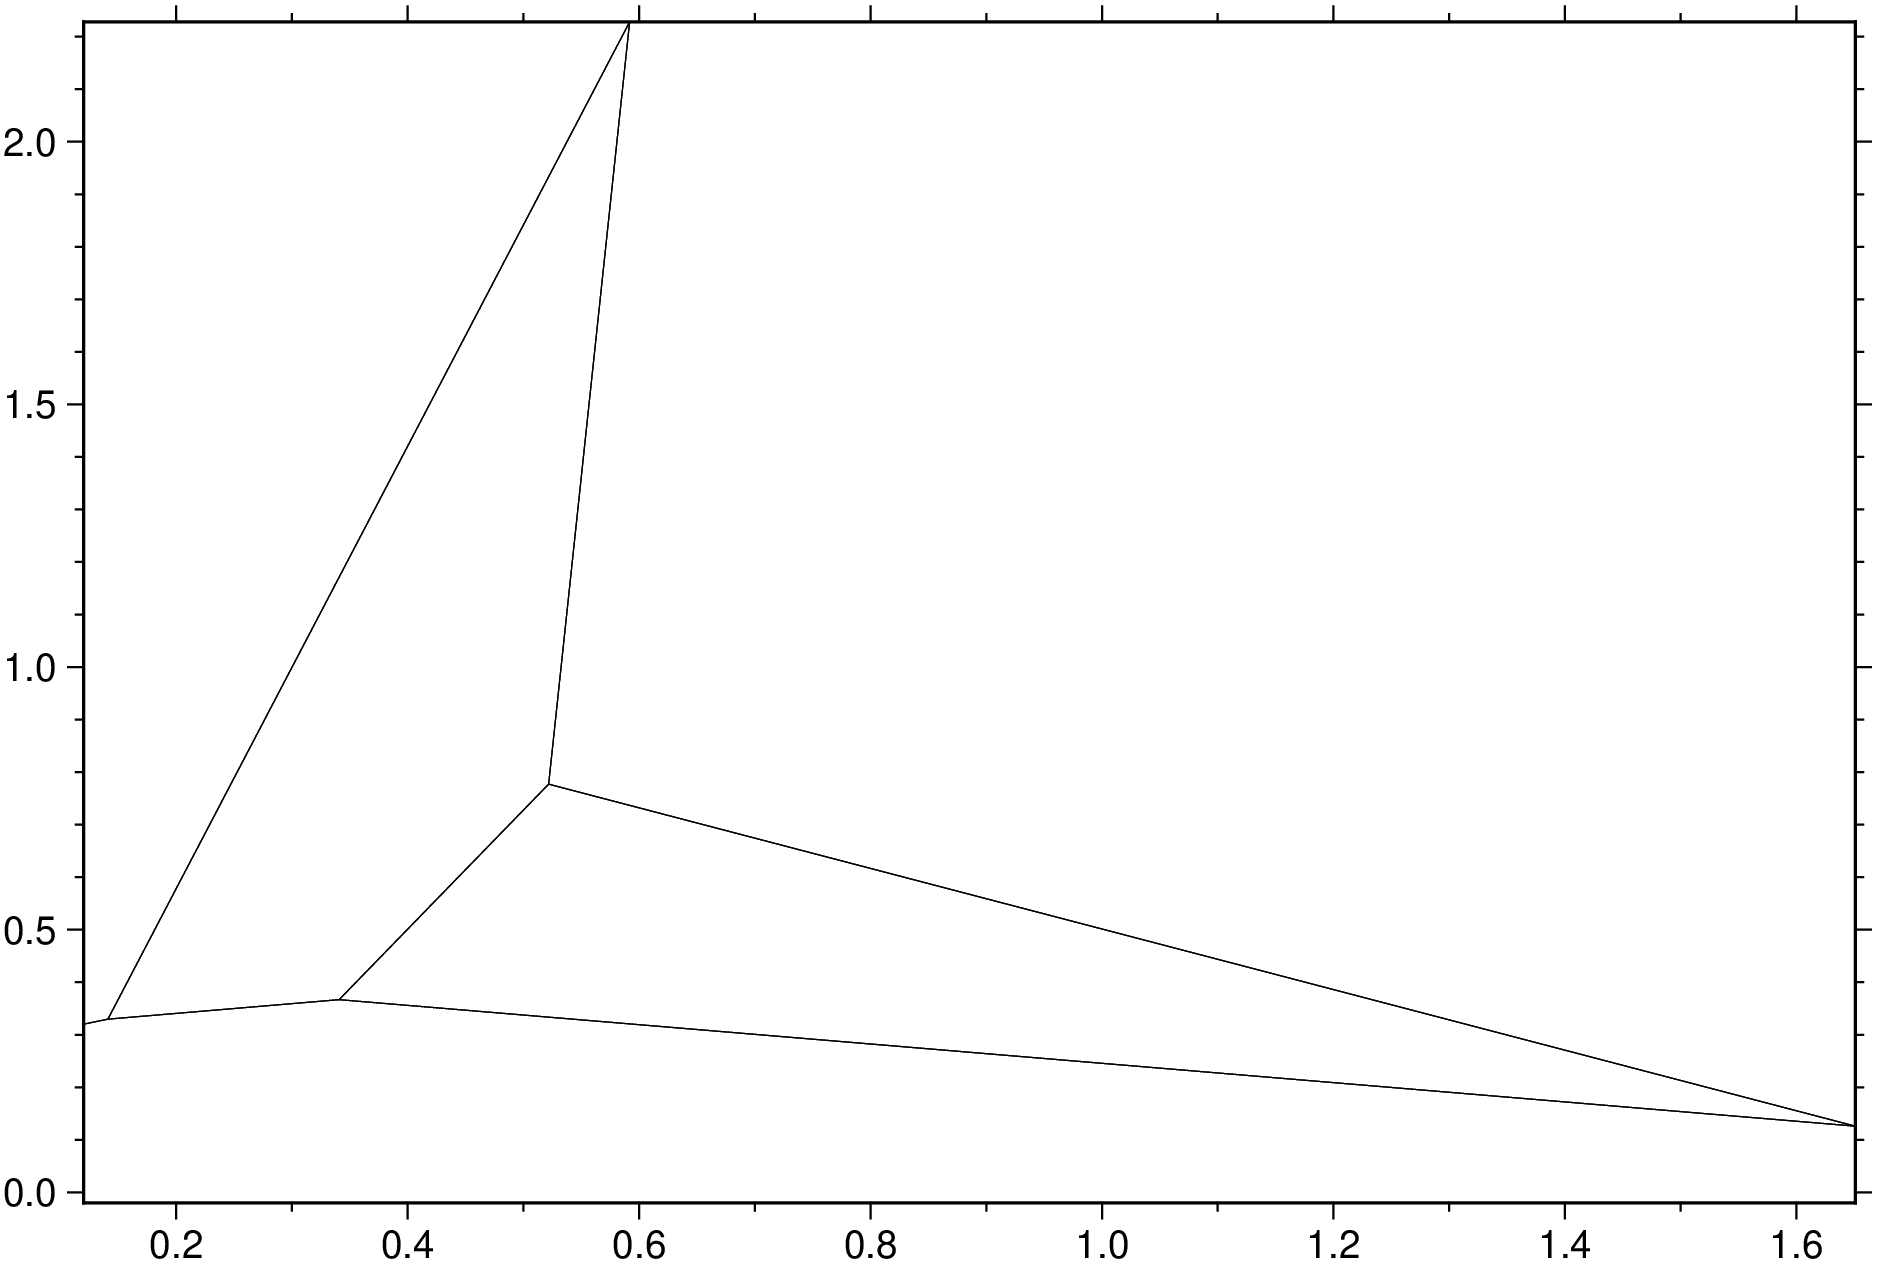
triplot(in::Matrix; onlyedges::Bool=false, noplot::Bool=false, kw...)Plots the 2-D triangulation or Voronoi polygons defined by the points in a matrix.
in: The input data. Can be either a Mx2 or Mx3 matrix.
noplot: Return the computed Delaunay or Veronoi data instead of plotting it (the default).
onlyedges: By default we compute Delaunay tringles or Veronoi cells as polygons. Use this option as onlyedges=true to compute multiple line segments.
region: Sets the data region (xmin,xmax,ymin,ymax) for voronoi (required). If not provided we compute it from in.
voronoi: Compute Voronoi cells instead of Delaunay triangles (requires region).
kw...: keyword arguments used in the plot module (ignore if noplot=true).
figname or savefig or name : – figname=name.png
Save the figure with the figname=name.ext where ext chooses the figure image format.
A GMTdataset if noplot=true or nothing otherwise.
Using a grid
using GMT
triplot(rand(5,2), voronoi=true, show=true)
using GMT
triplot(rand(5,3), lc=:red, show=true)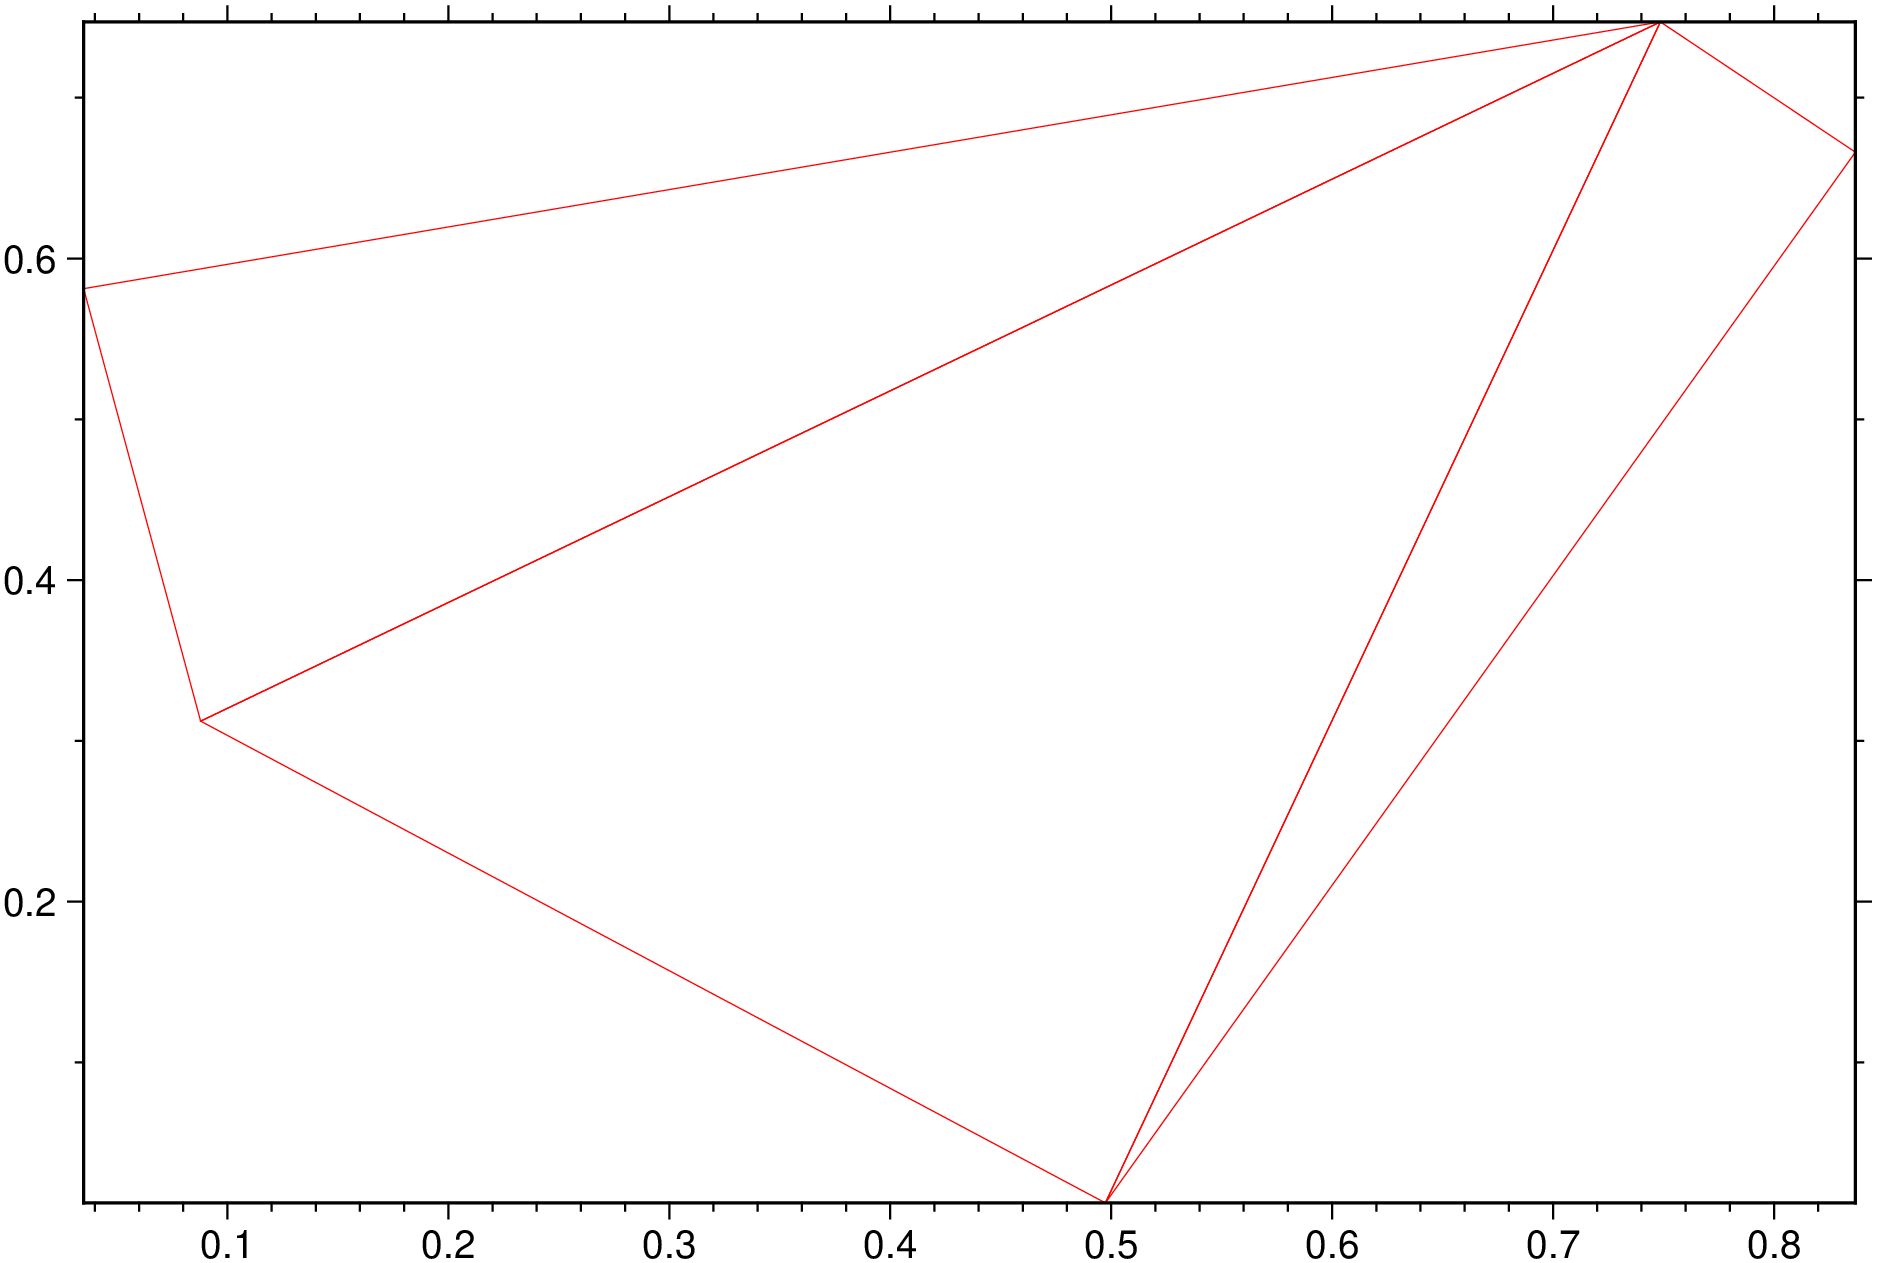
View the source code for this function.