Convenience function that wraps basemap to draw a map scale bar (-L). The scale bar length is computed for a given latitude, allowing accurate distance representation on projected maps.
Can be called as an overlay (mapscale!) on an existing plot, or standalone with explicit region and proj. When no explicit frame is given, defaults to frame=:none so that only the scale bar is drawn.
Parameters
anchor : – anchor=(x,y) | anchor=refpoint
Reference point on the map for the scale bar.
scale_at_lat : – scale_at_lat=lat
Latitude at which the map scale is computed. Required for geographic projections.
length or width : – length=“1000k” | length=val
Length of the scale bar. Append unit: e (meter), f (foot), k (km), M (mile), n (nautical mile), u (US survey foot). E.g., "500k" for 500 km.
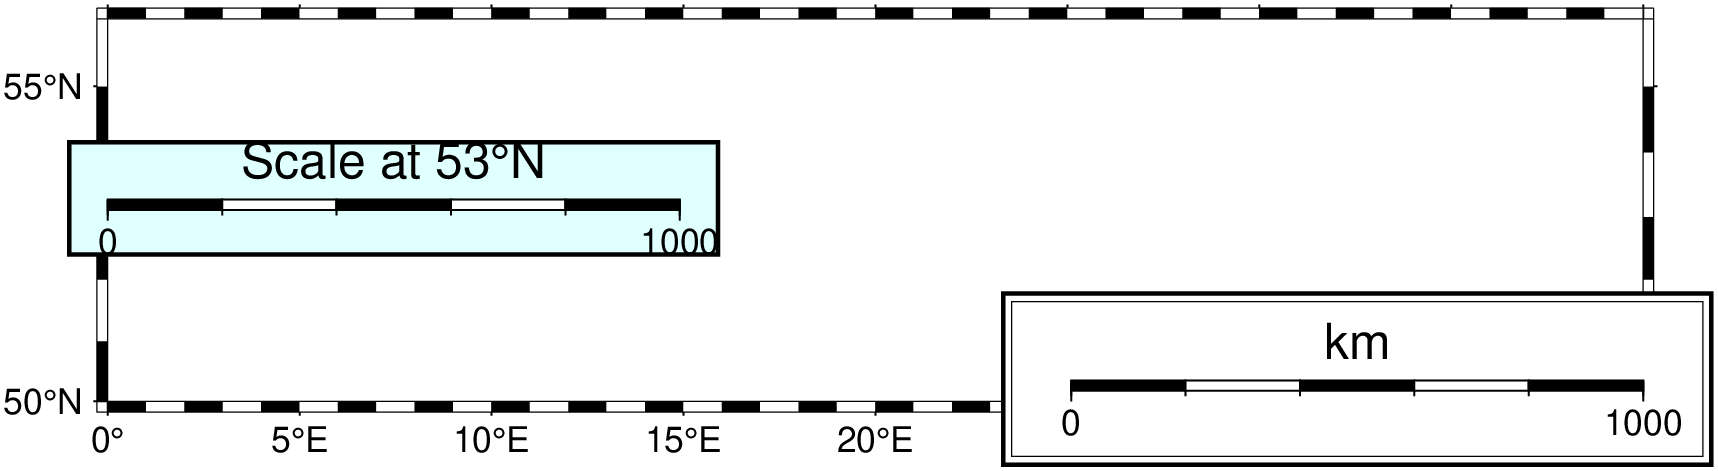
fancy : – fancy=true
Draw a fancy scale bar instead of a plain one.
label : – label=true | label=“text”
Label for the scale bar. Use true for the default unit label, or provide custom text.
align : – align=:left | align=:right | align=:top | align=:bottom
Alignment of the label relative to the scale bar.
justify : – justify=code
2-char justification code for the anchor point (e.g., :CM). See text.
offset : – offset=(dx,dy)
Offset from the anchor point.
units : – units=true
Append the unit to all distance annotations along the scale.
vertical : – vertical=true
Plot a vertical instead of horizontal Cartesian scale.
map, inside, outside, norm, paper :
Coordinate system for the anchor point. Use map=true for map coordinates, inside=code or outside=code for justification-based placement, norm=true for normalized (0-1) coordinates, or paper=true for plot coordinates.
All other keyword arguments (e.g., region, proj, frame, par, show, savefig, box, etc.) are passed through to basemap.
Examples
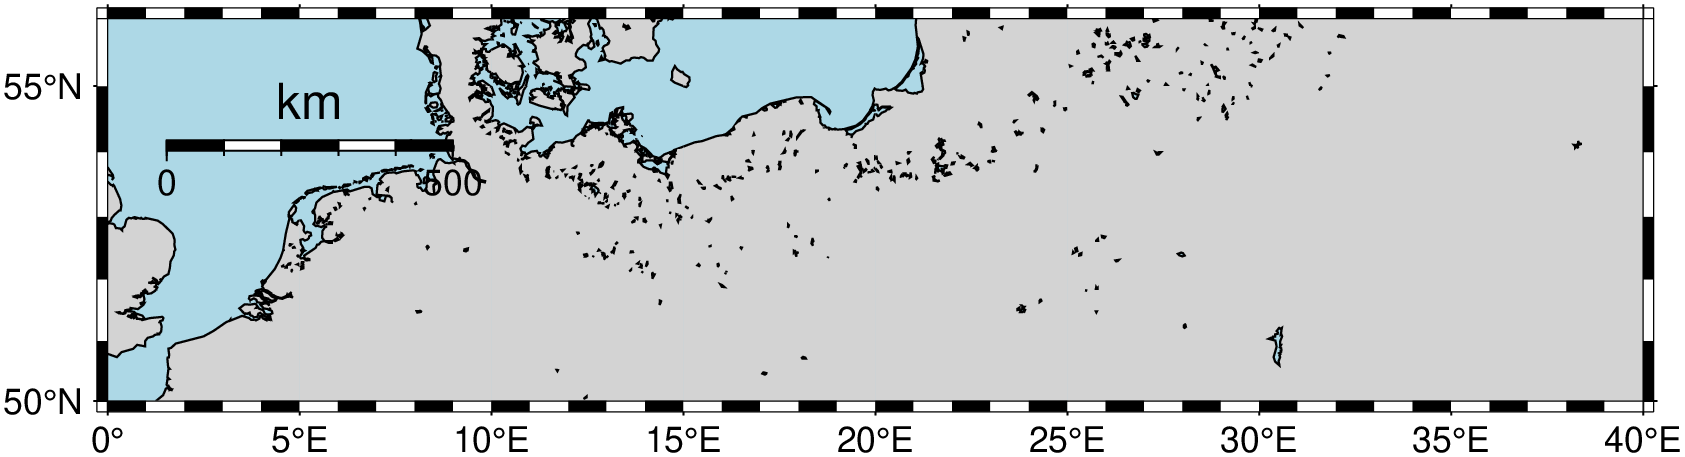
Simple scale bar on a map
A 500 km fancy scale bar on a Mercator map of the North Sea, computed at latitude 53N.