using GMT
biplot(TESTSDIR * "iris.dat", show=true)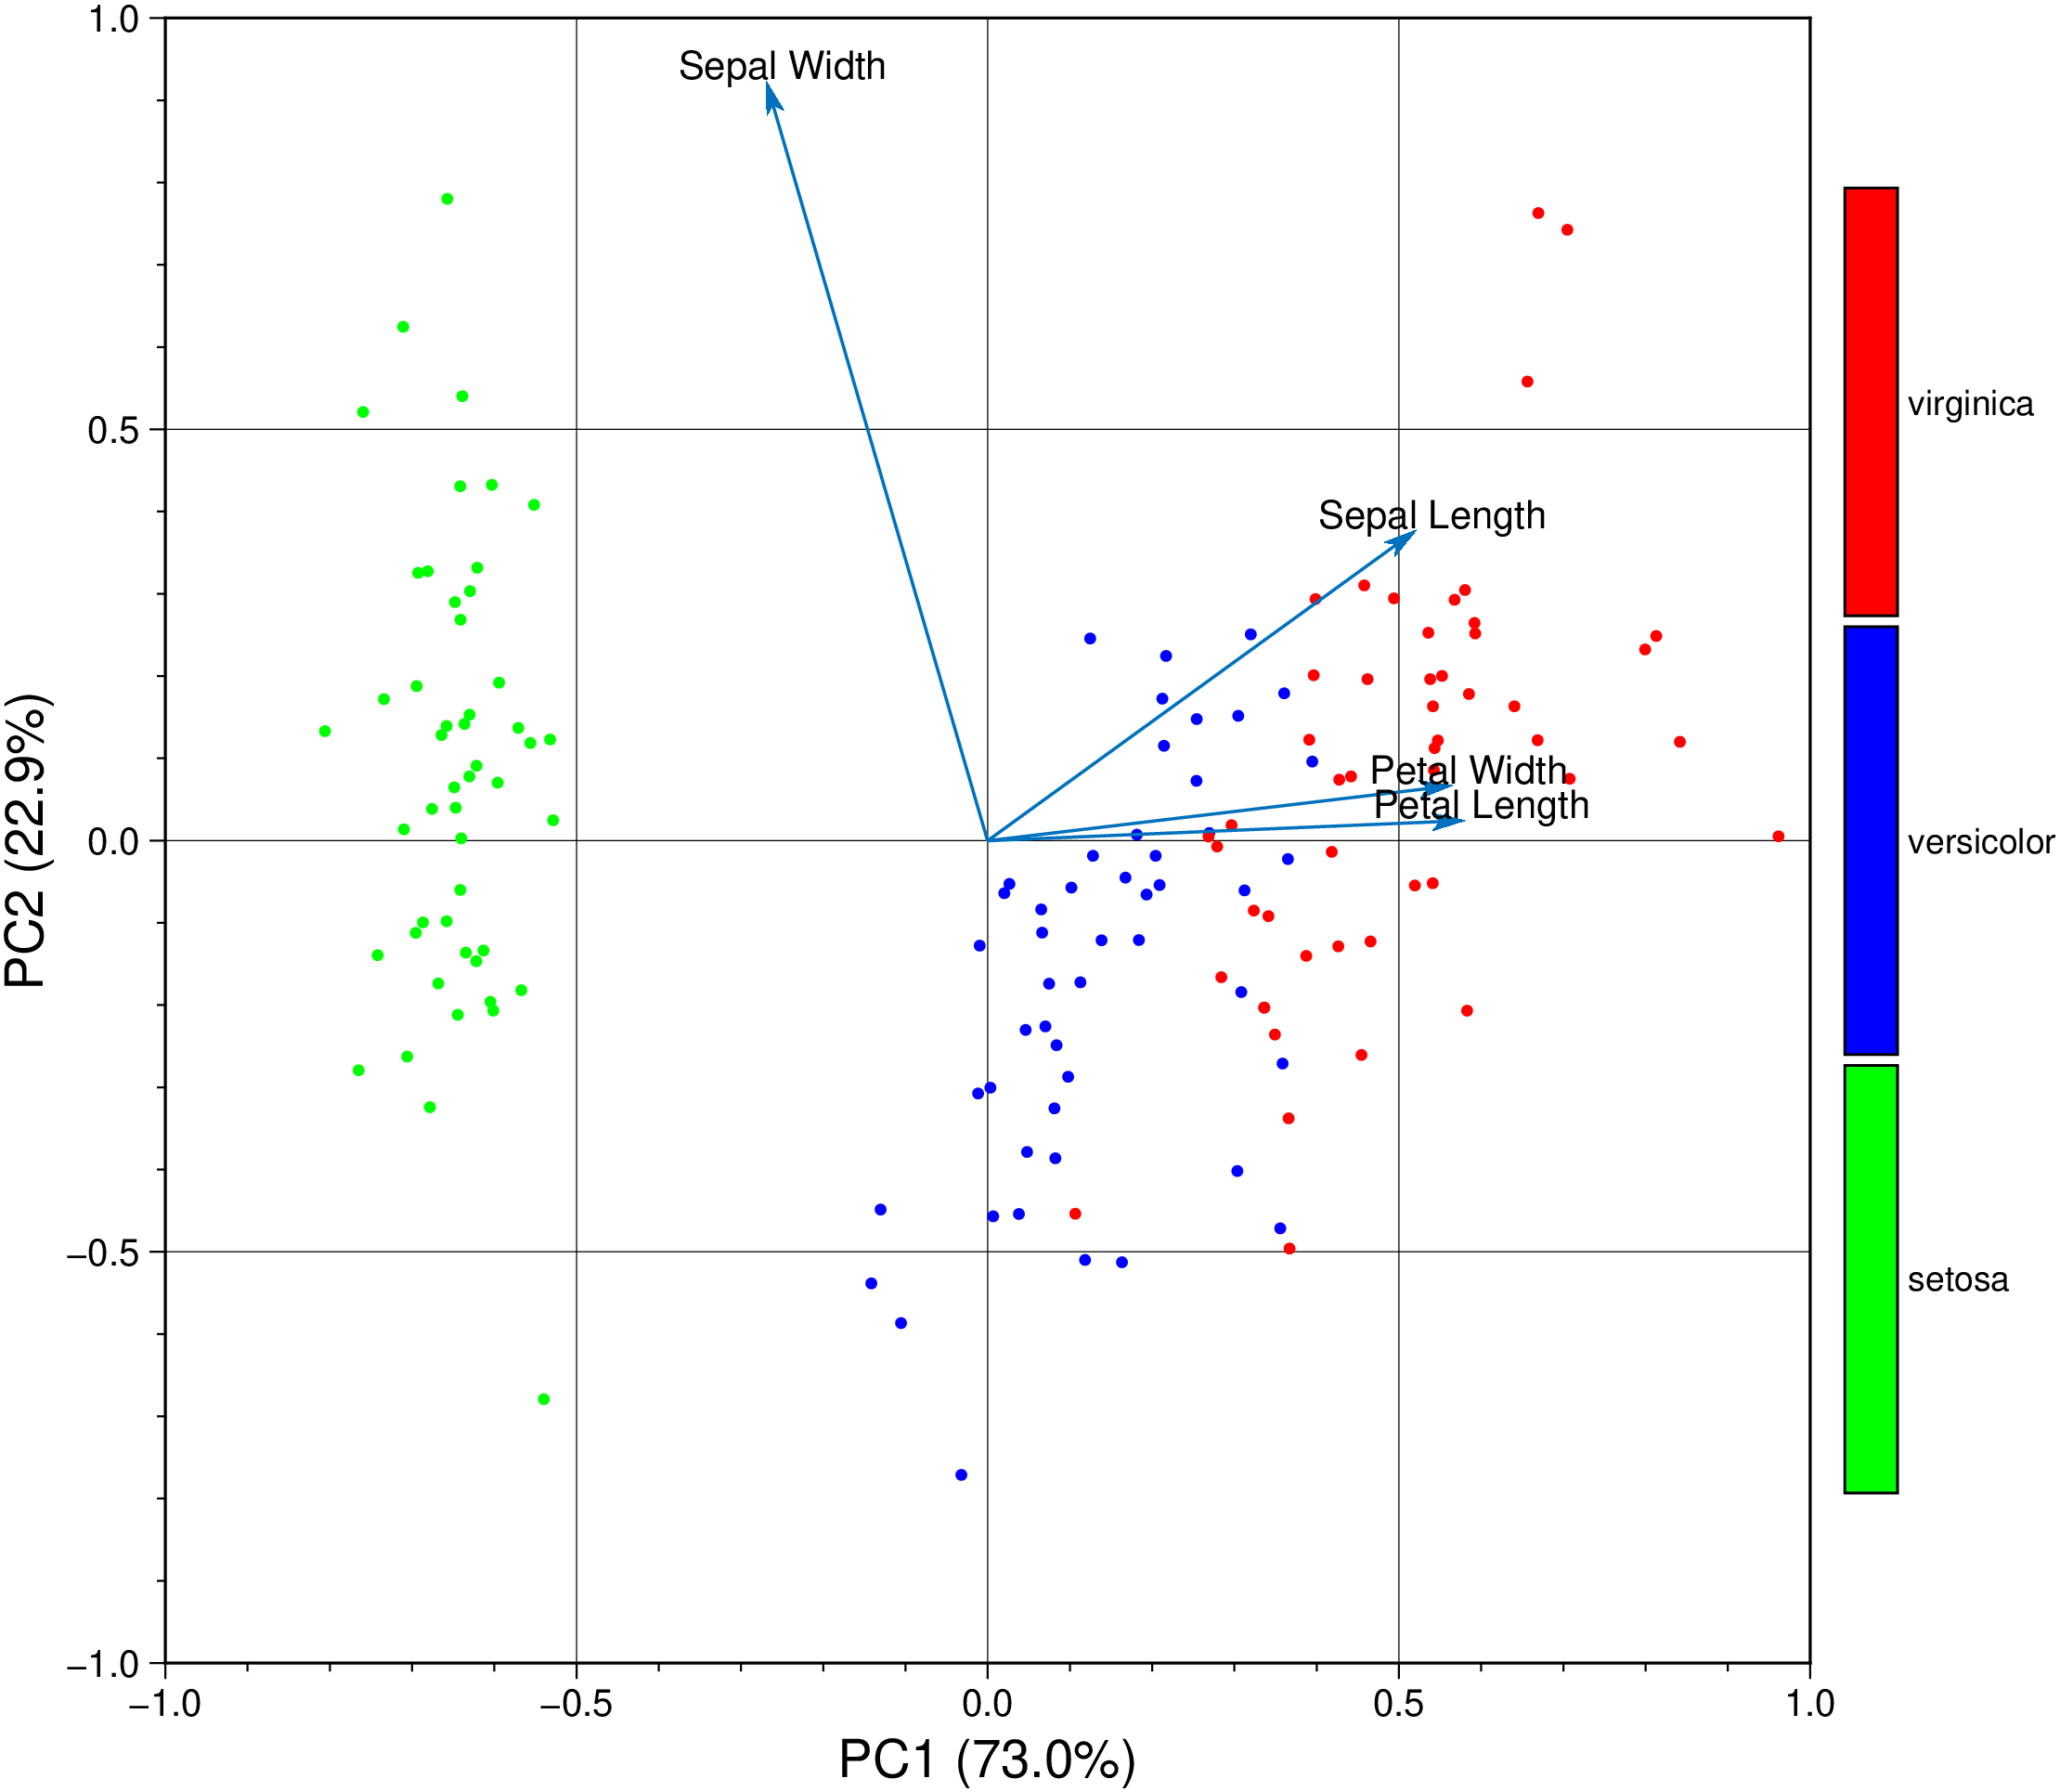
biplot(name::String | D::GMTDataset; arrow::Tuple=(0.3, 0.5, 0.75, "#0072BD"), cmap=:categorical,
       colorbar::Bool=true, marker=:point,ms="auto", obsnumbers::Bool=false, PC=(1,2),
       varlabels=:yes, xlabel="", ylabel="", kw...)
Create a 2D biplot of the Principal Component Analysis (PCA) of a two-dimensional chart that represents the relationship between the rows and columns of a table.
The biplot function:
Imposes a sign convention, forcing the element with the largest magnitude in each column of coefs to be positive. This action flips some of the vectors in coefs to the opposite direction, but often makes the plot easier to read. Interpretation of the plot is unaffected, because changing the sign of a coefficient vector does not change its meaning.
Scales the scores so that they fit on the plot. That is, the function divides each score by the maximum absolute value of all scores, and multiplies by the maximum coefficient length of coefs. Then biplot changes the sign of the score coordinates according to the sign convention for the coefficients.
cmd0: The name of a 2D data table file readable with gmtread(), or a GMTdataset with the data.
arrow: a tuple with the following values: (len, shape, width, color). If this default is used we scale them by fig size.
len: the length of the arrowhead in cm. Default is 0.3.shape: the shape of the arrow. Default is 0.5.width: the width of the arrow stem in points. Default is 0.75.color: the color of the arrow. Default is “#0072BD”.cmap: a String or Symbol with the name of a GMT colormap.
colorbar: whether to plot a colorbar. Default is true.
marker: a String or Symbol with the name of a GMT marker symbol. Default is “point”.
ms: a String or Symbol with the name of a GMT marker size. Default is “auto” (also scales sizes with the size of the plot).
obsnumbers: whether to plot observation numbers on the plot. Default is false. Note that in this case we are not able to plot colored numbers by category, so we plot the symbols as well (use cmap="none" if you don’t want this).
PC: a tuple with the principal components to plot. Default is (1, 2). For example, PC=(2,3) plots the 2nd and 3rd principal components.
varlabels: whether to plot variable labels. The default is :yes and it prints as labels the column names if the input GMTdataset. Is it hasn’t column names, then it prints “A,B,C,…”. Give a string vector to plot custom labels.
xlabel: a String with the x-axis label. Default is ““, which prints”PC[PC[1]]“.
ylabel: a String with the y-axis label. Default is ““, which prints”PC[PC[2]]“.
kw...: Any additional keyword argument to be passed to the plot() function.
figname or savefig or name : – figname=name.png
Save the figure with the figname=name.ext where ext chooses the figure image format.
See the classic analysis of the Iris dataset.
using GMT
biplot(TESTSDIR * "iris.dat", show=true)
Plot a 6 cm fig with the observarion numbers.
using GMT
biplot(TESTSDIR * "iris.dat", figsize=6, obsnumbers=true, show=true)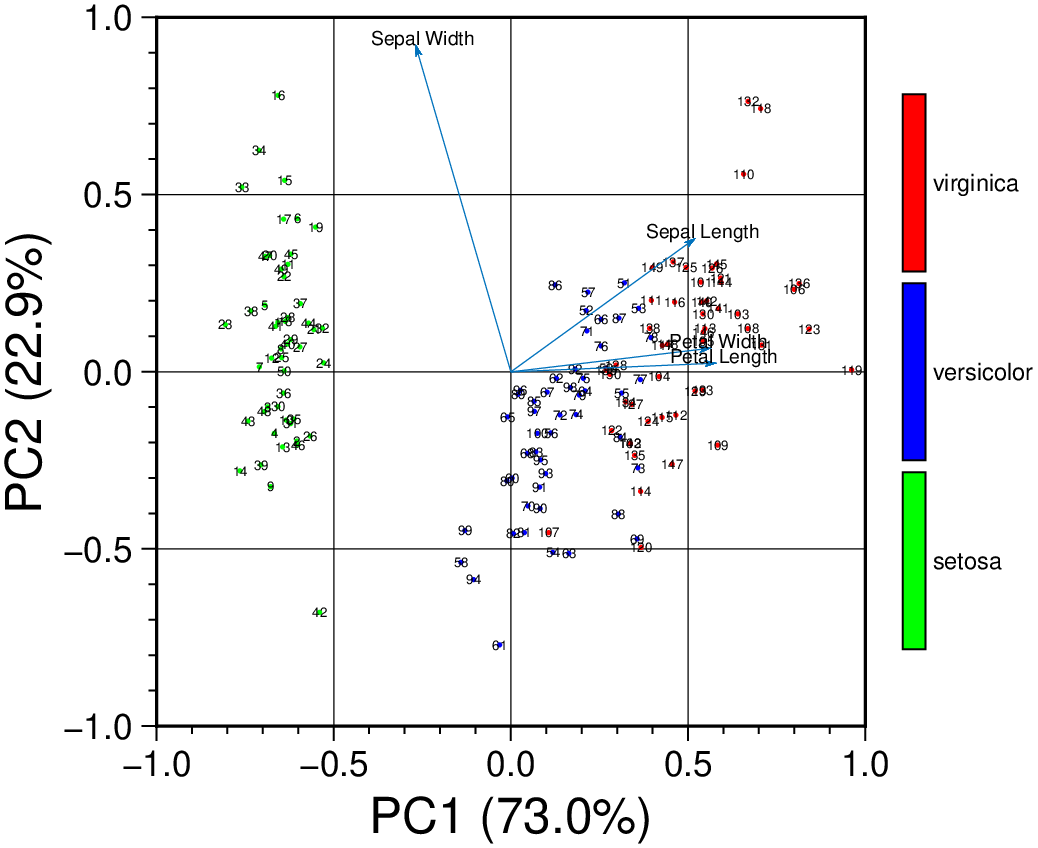
This function has multiple methods:
biplot(cmd0::String; first, PC, xlabel, ylabel, varlabels, cmap, marker, ms, obsnumbers, colorbar, arrow, kw...) - plot.jl:2158biplot(coefs::Matrix{Float64}, scores::Matrix{Float64}, explained::Vector{Float64}, varlabels::Vector{<:String}, obslabels::Vector{<:String}, obsnumb::Bool, xlabel::String, ylabel::String, cmap::String, marker::String, ms::String, colorbar::Bool, arrow_pars::Tuple{Float64, Float64, Float64, String}, first::Bool, d::Dict{Symbol, Any}) - plot.jl:2179biplot(D::GMTdataset{T, 2}; first, PC, cmap, xlabel, ylabel, varlabels, marker, ms, obsnumbers, colorbar, arrow, kw...) where T<:Real - plot.jl:2163